


On June 30, 2019, the EOS price reached a high of $6.4. A flash crash ensued and the price reached lows of $5.56 the next day.
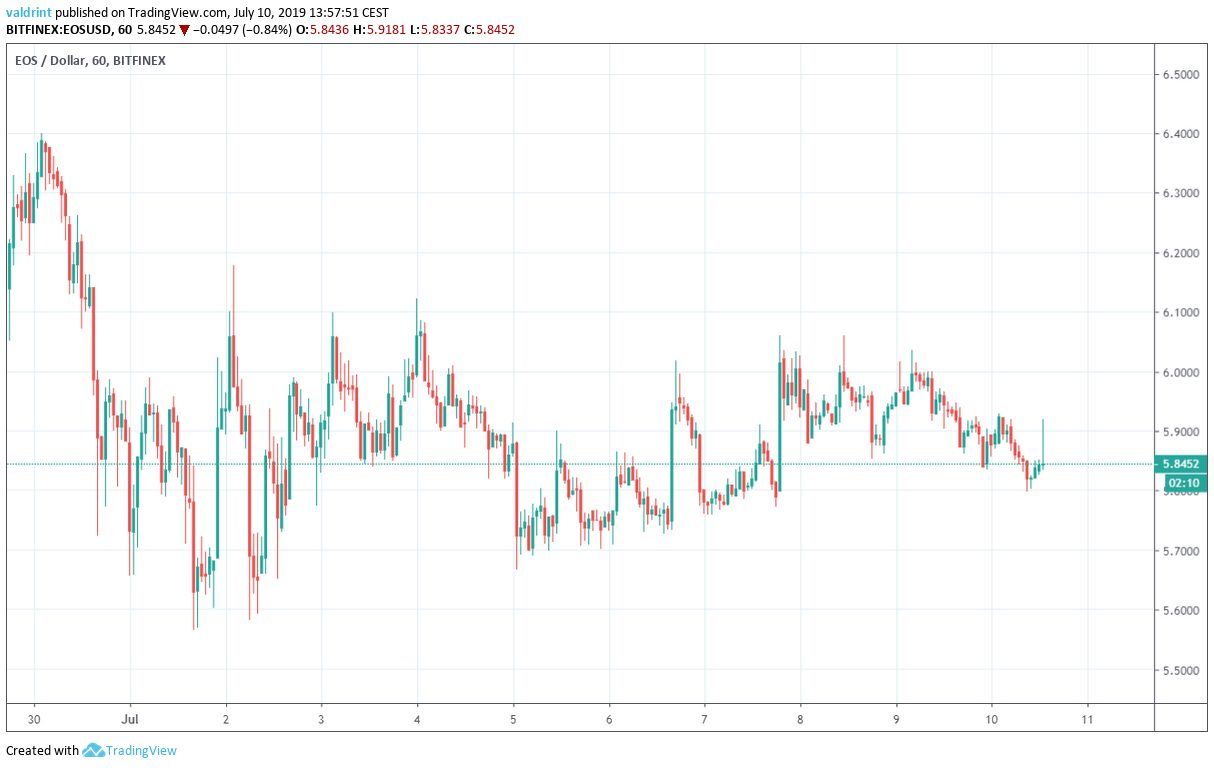
Since then, the EOS price has been gradually increasing.
How long will this increase continue? Keep reading below in order to find out.
If you want to trade EOS safely and securely on our partner exchange, follow this link to get set up on XCOEX.
For our previous analysis, click here.
EOS Price: Trends and Highlights for July 10
- EOS/USD is trading inside an ascending triangle.
- It is following a longer-term ascending support line.
- There is bullish divergence developing in the RSI.
- The closest resistance area is found near $6.4
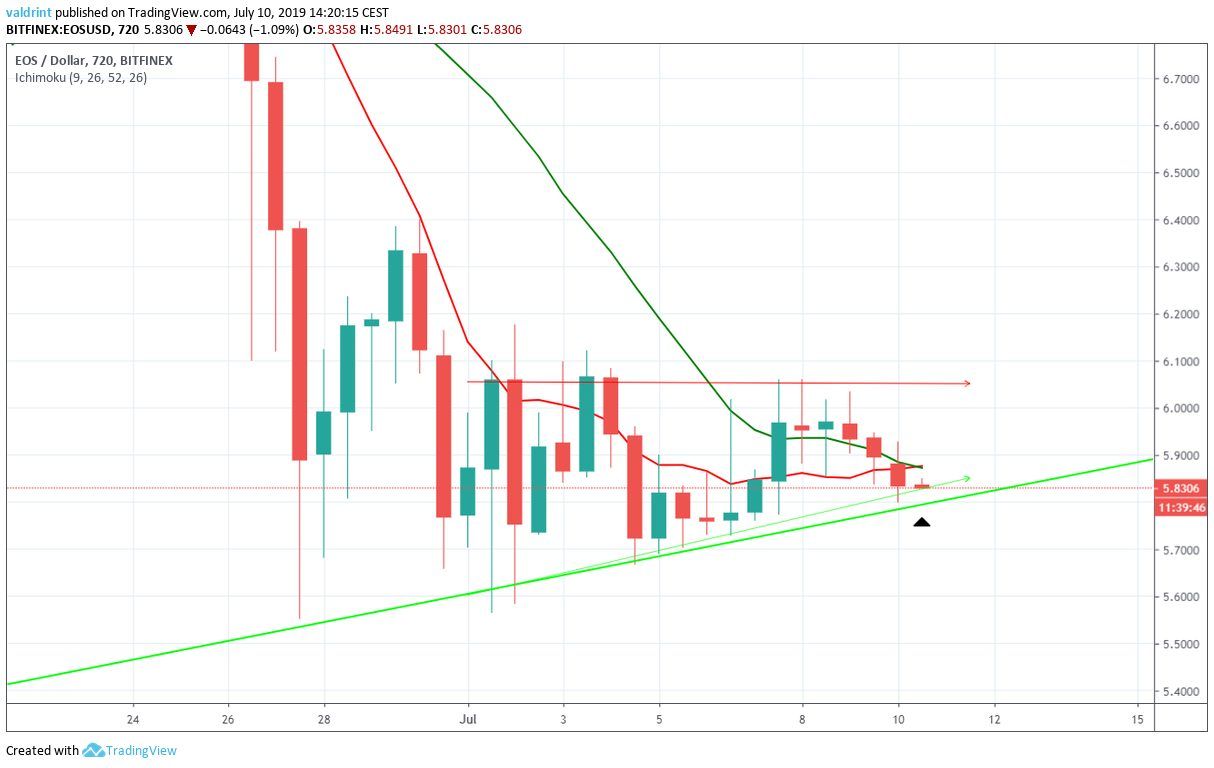
EOS Price in an Ascending Triangle
Since reaching a low of $5.56 on July 1, EOS has been gradually increasing — trading inside the ascending triangle outlined below:
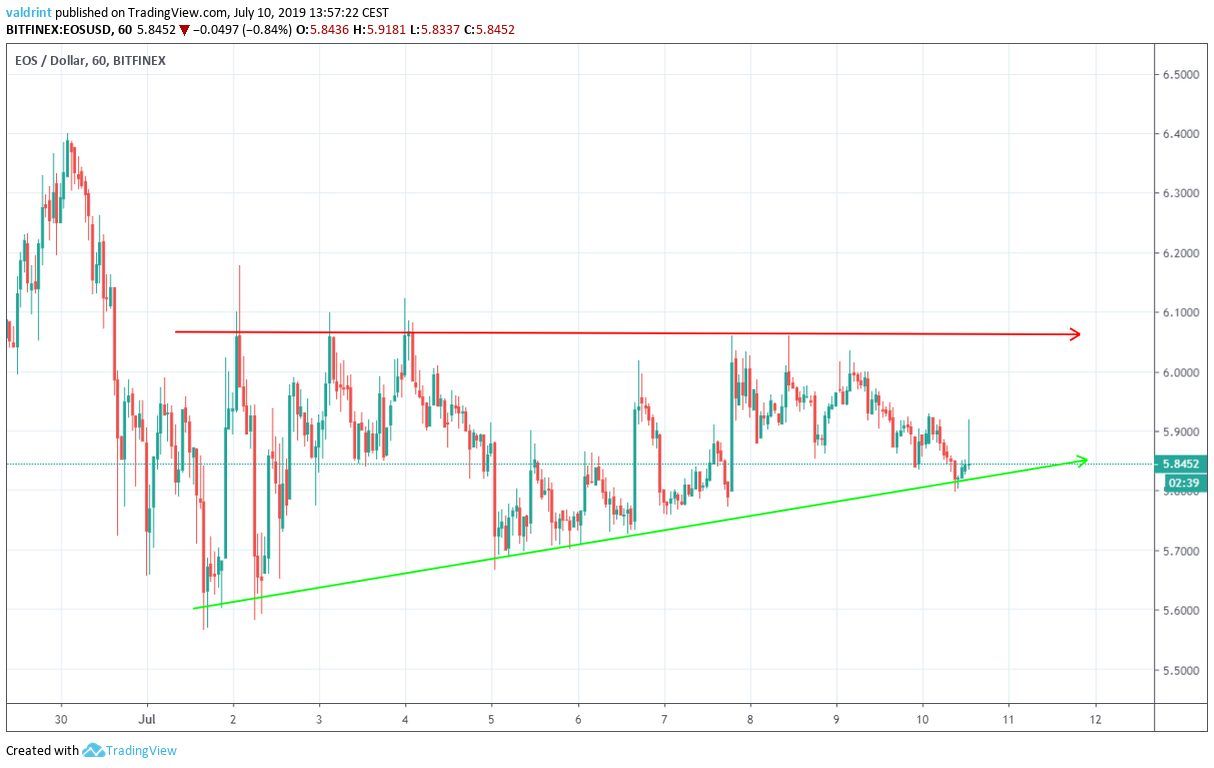
The ascending triangle is considered a bullish pattern, making a price breakout more likely.
Let’s take a look at a different time-frame alongside technical indicators to see if that is likely.
Possible Breakout
A look at the 12-hour time-frame shows that the EOS price has been following an ascending support line since the beginning of May.
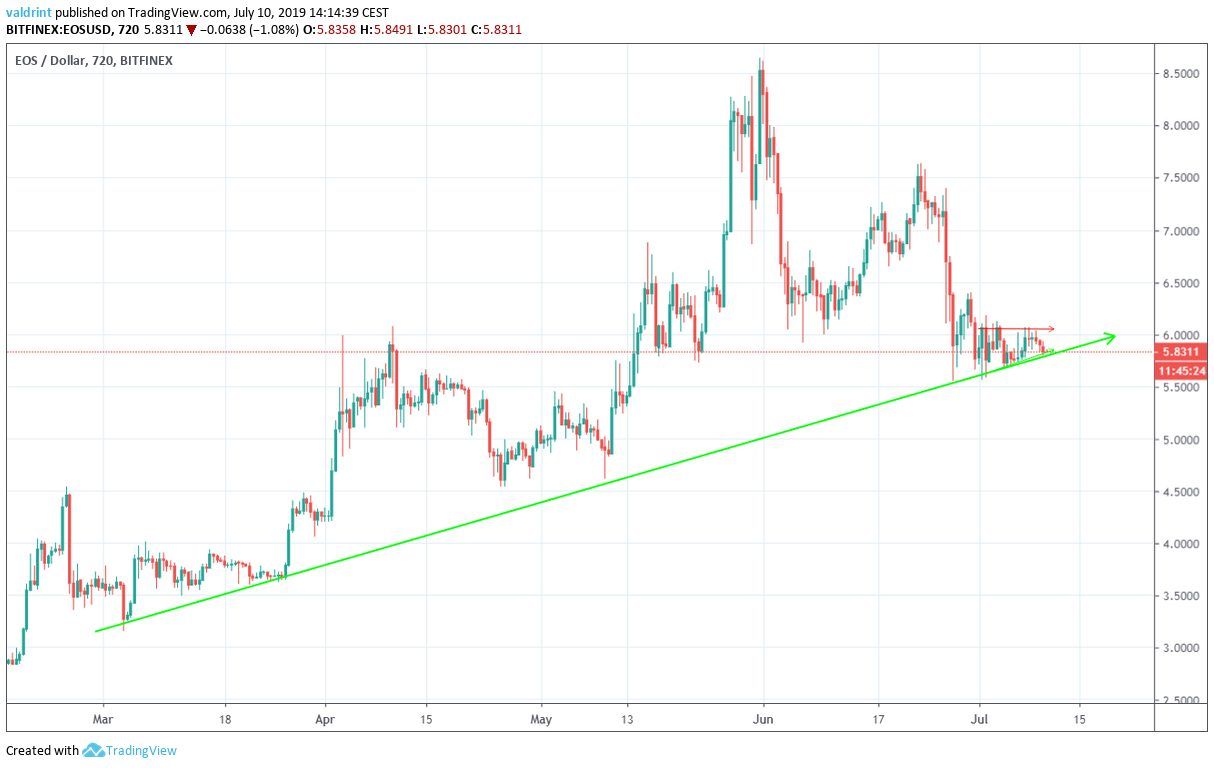
At the beginning of July, EOS touched the support line for the fourth time.
This line coincides with the ascending support line from the ascending triangle analyzed in the first section.
Therefore, a breakdown from the triangle would also mean a breakdown from the ascending support line.
However, a look at the RSI suggests that this is unlikely.
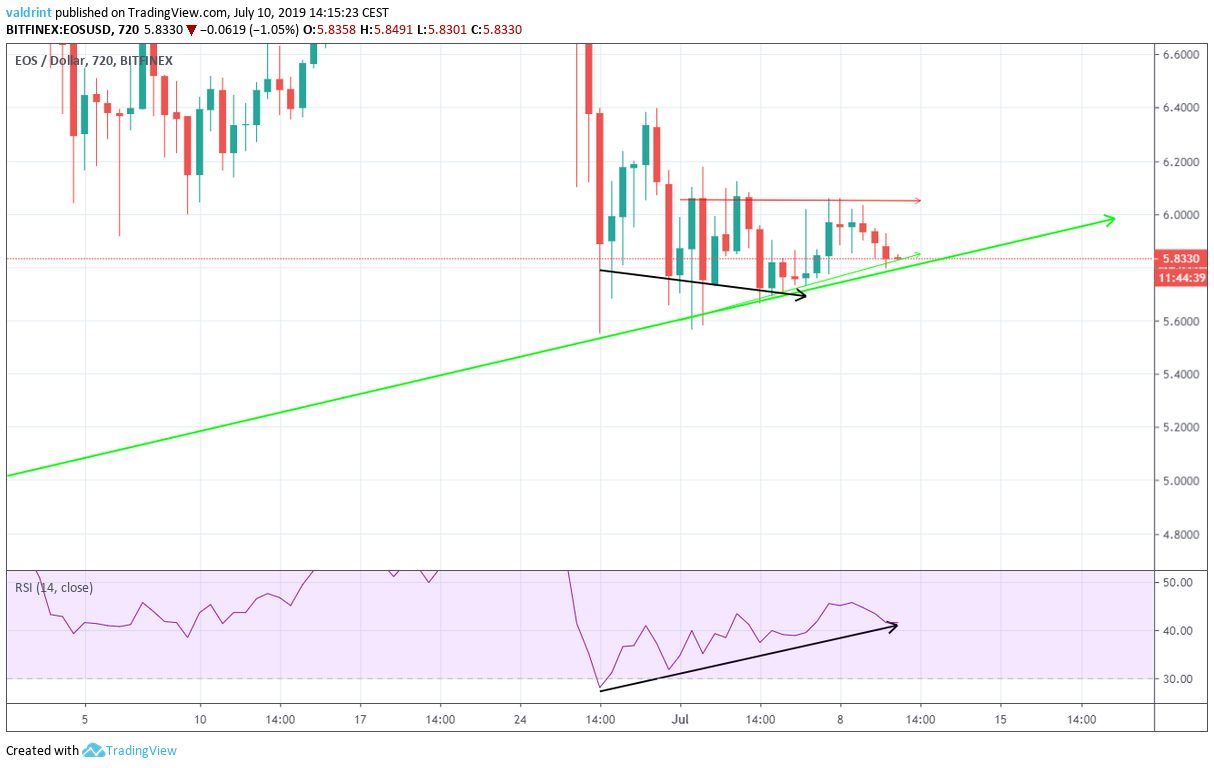
The RSI has been generating bullish divergence since June 25.
The divergence is significant, but it is not occurring in time-frames longer than the 12-hour.
Staying inside the same time-frame, the moving averages (MA) also support a price breakout.
A bullish cross has just transpired between the 10- and 20-period MAs.
This is often a sign that an uptrend has begun.
The combination of these indicators and the fact that the ascending triangle is a bullish pattern suggest that the price will soon breakout from the triangle.
Reversal Areas
If it does, one resistance area is outlined below.
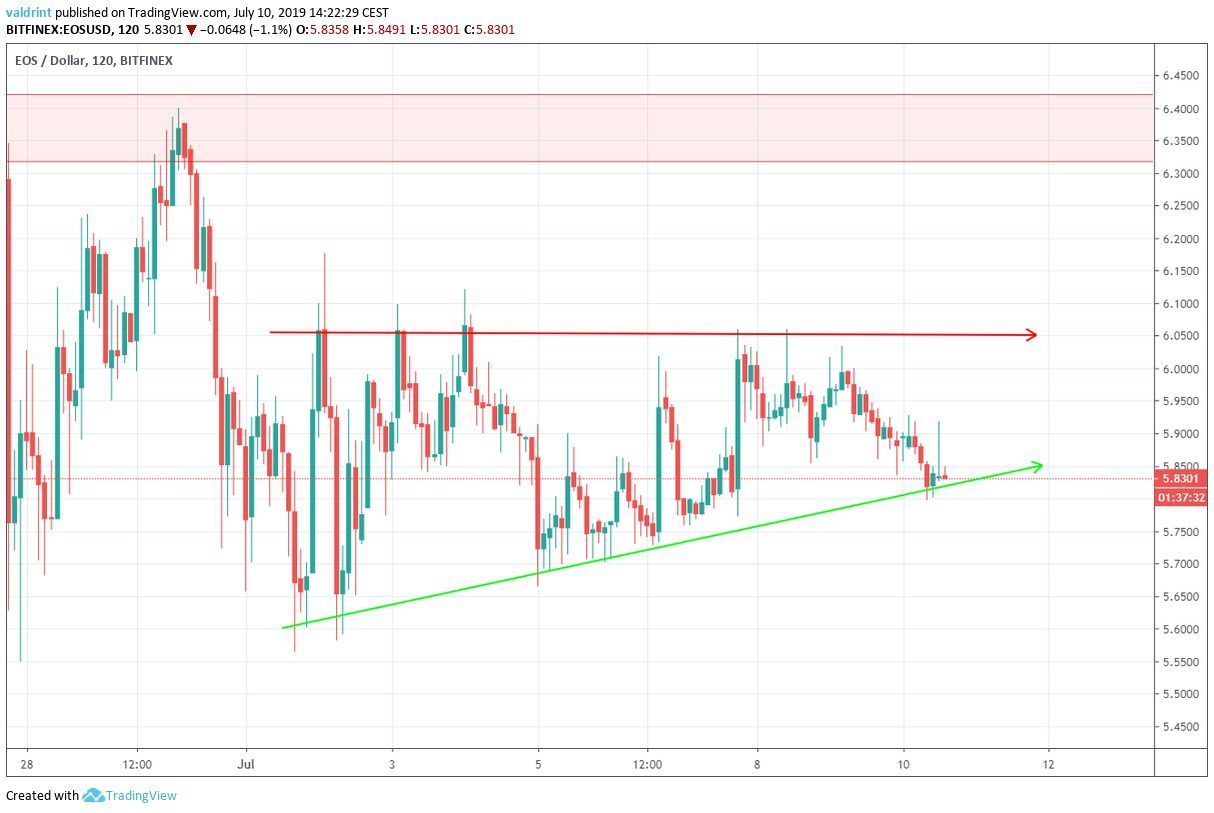
The closest resistance area is found near $6.4.
If the EOS price breaks out from the triangle, it is likely to initiate a short-term reversal.
Summary
The EOS price is trading inside a short-term ascending triangle.
Technical indicators suggest that a breakout will occur soon.
If it does, the closest resistance area can be found near $6.4
Do you think the EOS price will break out from the triangle? Let us know in the comments below.
Disclaimer: This article is not trading advice and should not be construed as such. Always consult a trained financial professional before investing in cryptocurrencies, as the market is particularly volatile.
Images are courtesy of Shutterstock, TradingView.


