On July 16, 2019, the EOS price reached a low of 3505 satoshis. An upward move ensued. On July 26, it reached a high of 4799 satoshis. It has been decreasing since. On August 6, it reached a low of 3472 satoshis.
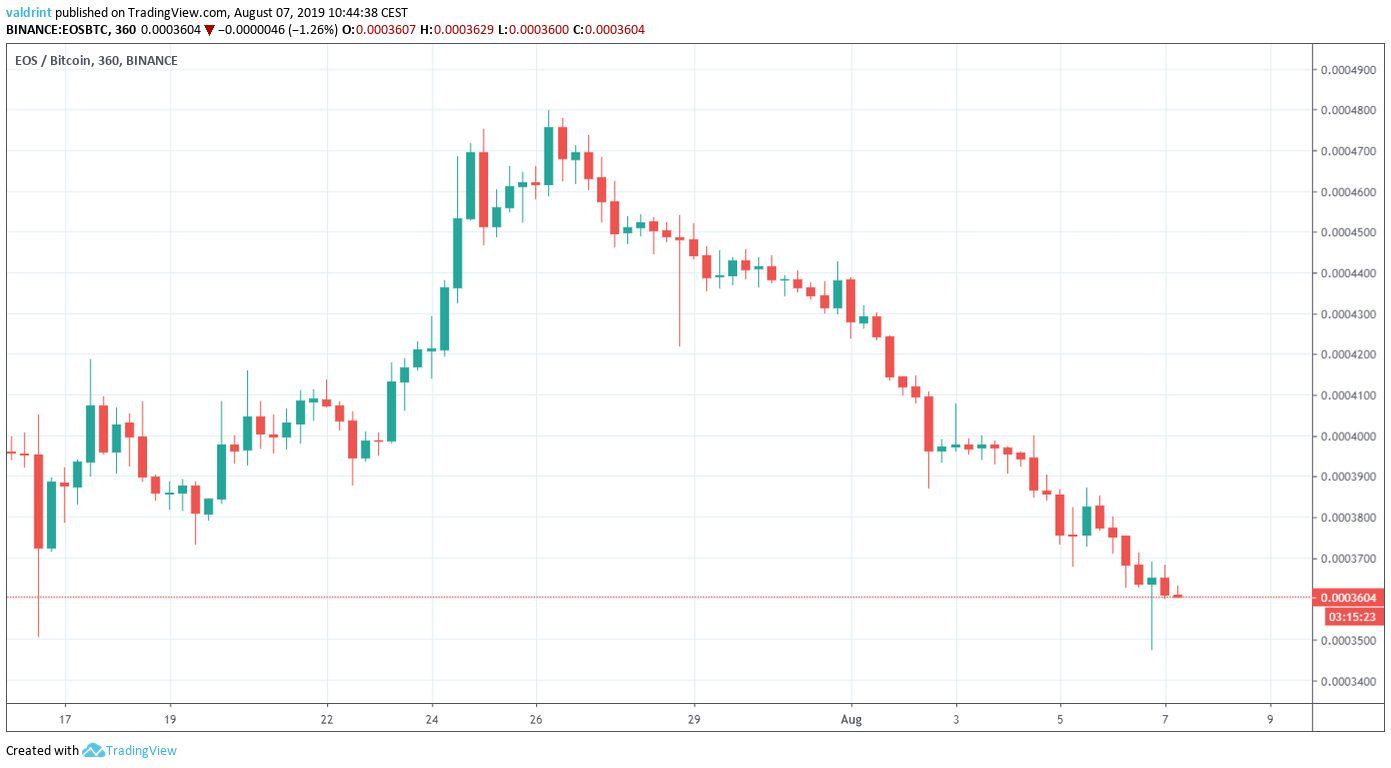
Will the EOS price initiate a reversal? Keep reading below if you want to find out.
For our previous analysis, click here.
If you are interested in trading EOS (EOS) with a multiplier of up to 100x on our new partner exchange with the lowest fees, follow this link to get a free StormGain account!
For those of you that would be more interested in a video analysis, click below:
EOS Price: Trends and Highlights for August 7
- EOS/BTC has made a double bottom pattern.
- There is support between 3000 and 3600 satoshis.
- There is a significant bullish divergence present in the daily RSI.
Double Bottom
A look at the six-hour time-frame shows that there is buying support between 3500 and 3600 satoshis.
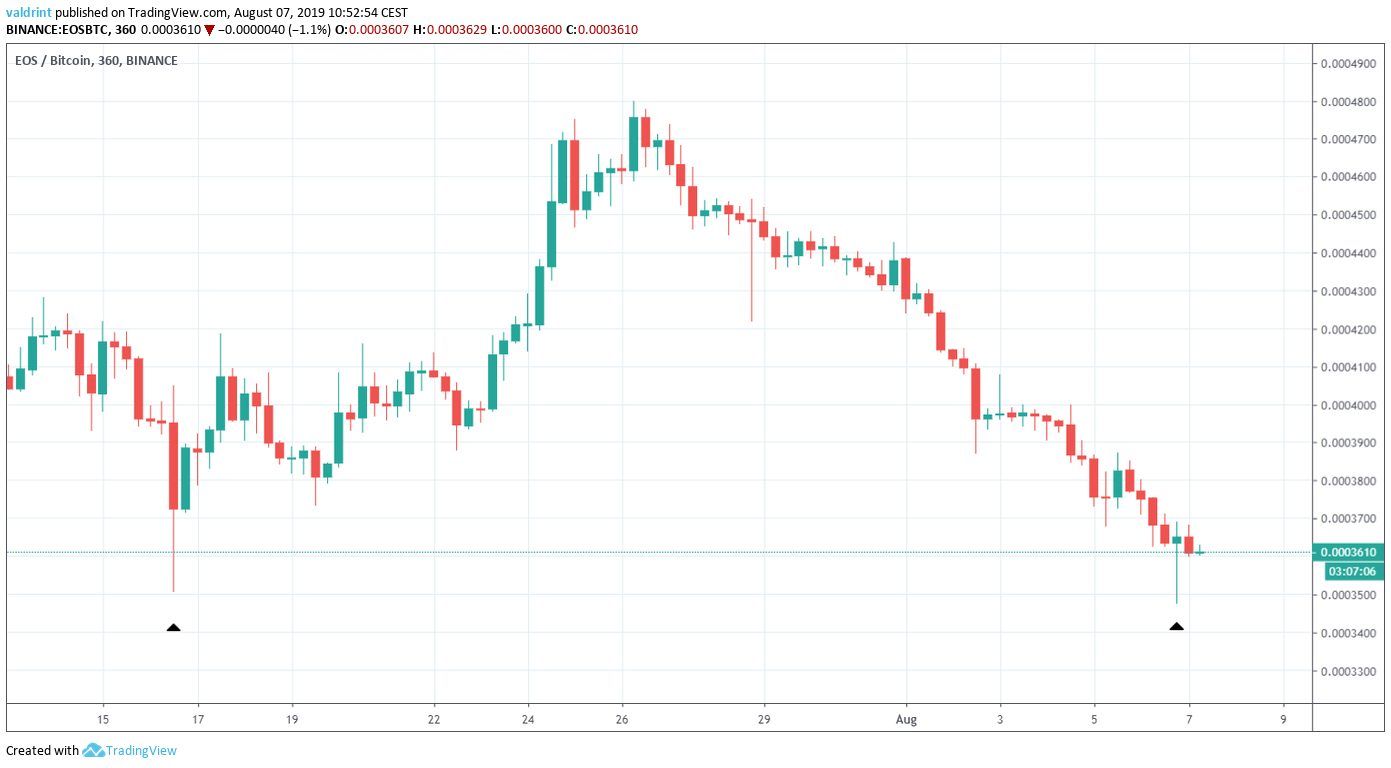
On July 16 and August 6, EOS reached a similar low.
This is known as a double bottom and is considered a bullish reversal pattern.
In both cases, it immediately increased, creating a long lower wick.
This is a sign of buying pressure around that area.
Additionally, the most recent time the EOS price visited this area, it has generated bullish divergence in the RSI.
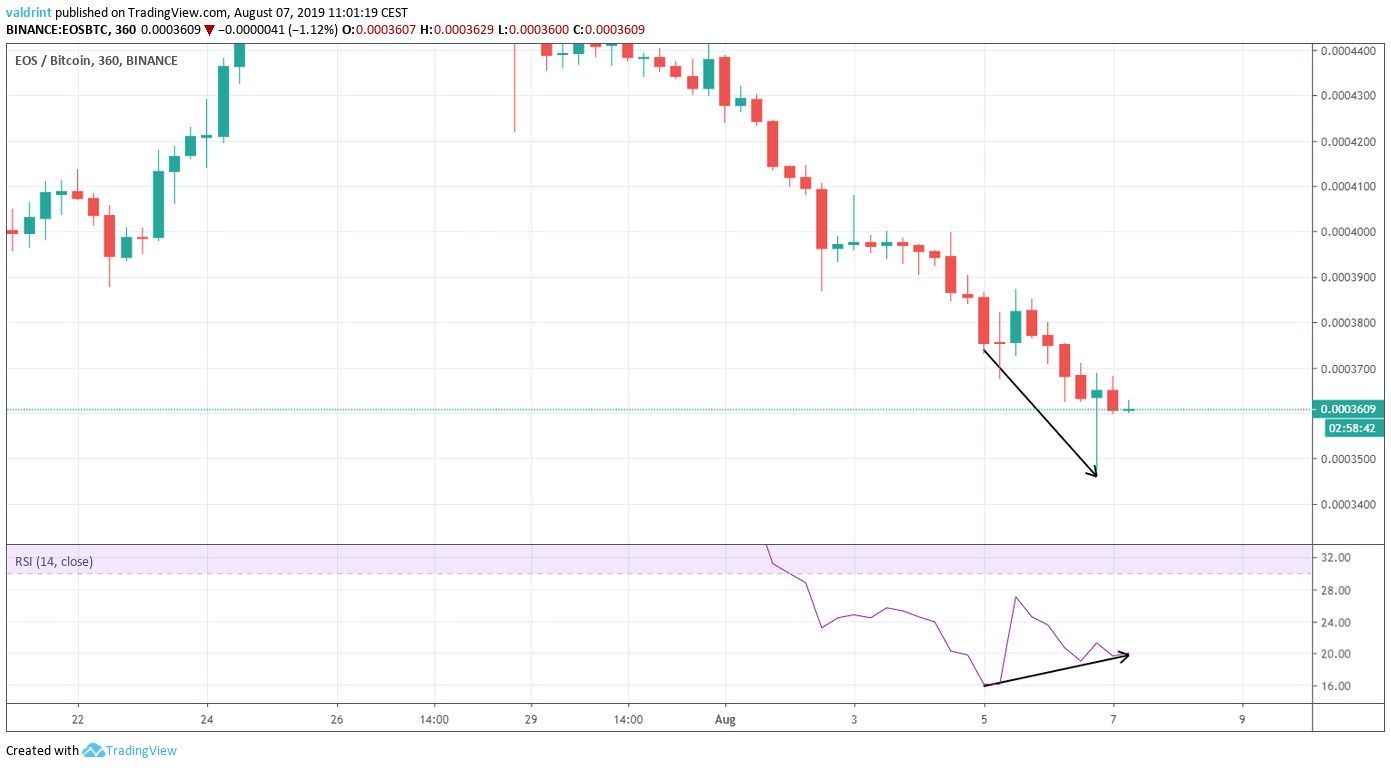
No upward move has begun as a result of the divergence.
However, the divergence is not very significant and is not present in longer-term time-frames.
Combined with the fact that it is not occurring at a support line or a bullish pattern, we do not think it is sufficient in predicting the initiation of an upward move.
Buy EOS and other cryptocurrencies on our partner exchange, KuCoin. Sign up for a free account today!
Long-Term Support
A look at the daily time-frame shows that the EOS price is trading inside a large support area that spans from 3000 to 36000 satoshis.
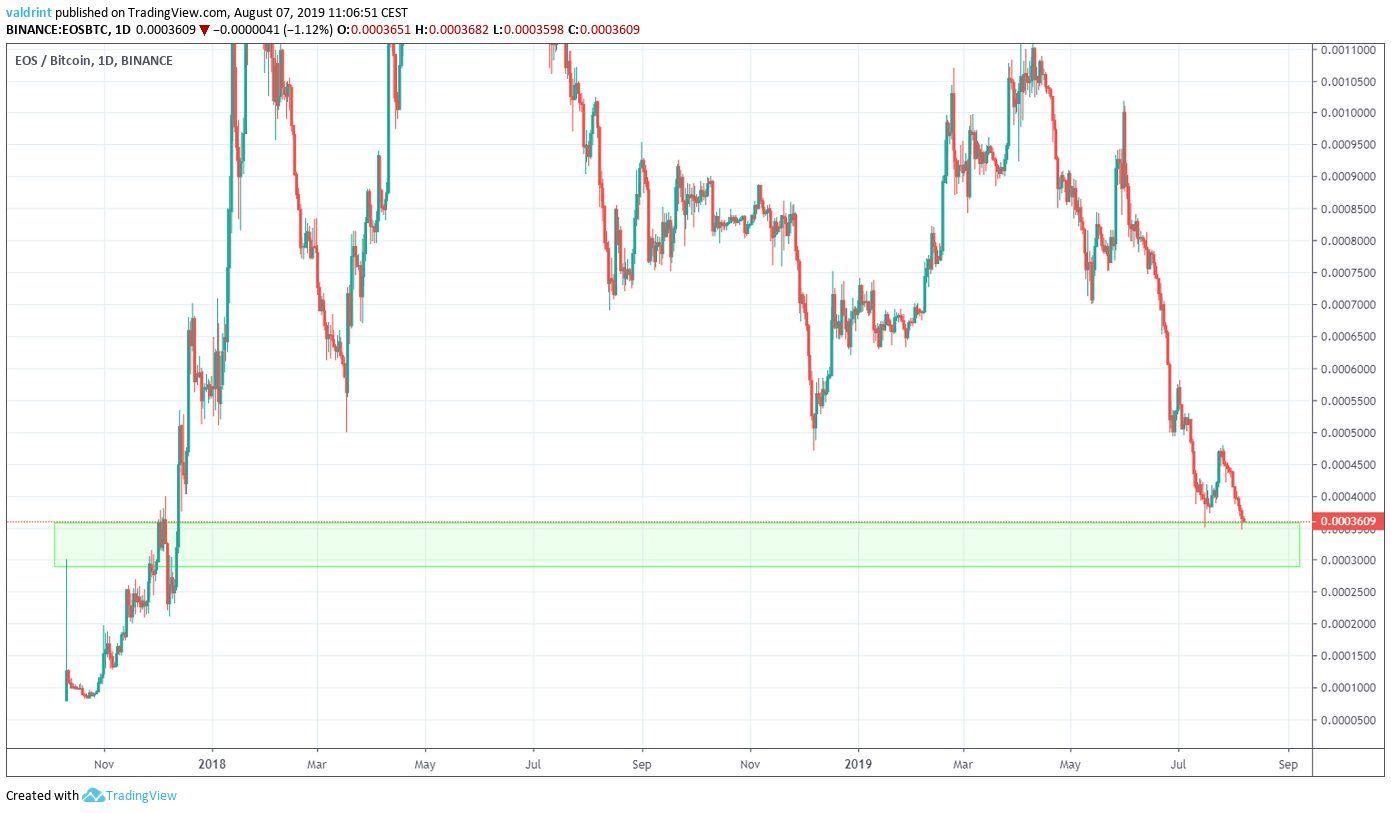
The price has barely reached the upper limit of the support area.
Unlike in the short-term, a look at the RSI shows a very significant bullish divergence developing.
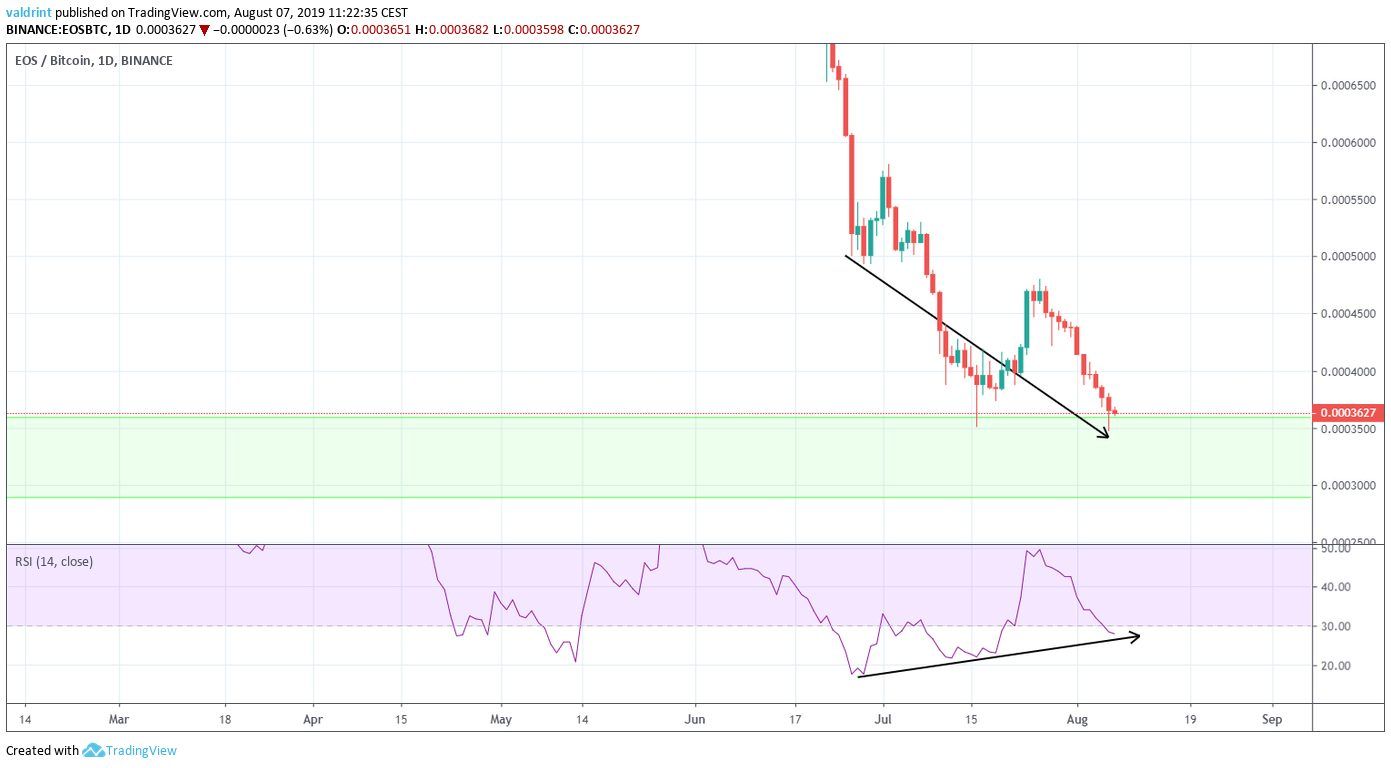
The divergence began on August 2.
Additionally, the upward trending slope of the divergence has yet to be broken.
Thus, we believe that the EOS price will soon begin an upward move.
Potential Reversal
Since the support line encompasses a large area, we will use a Fibonacci retracement tool to find a suitable price area for the initiation of a reversal.
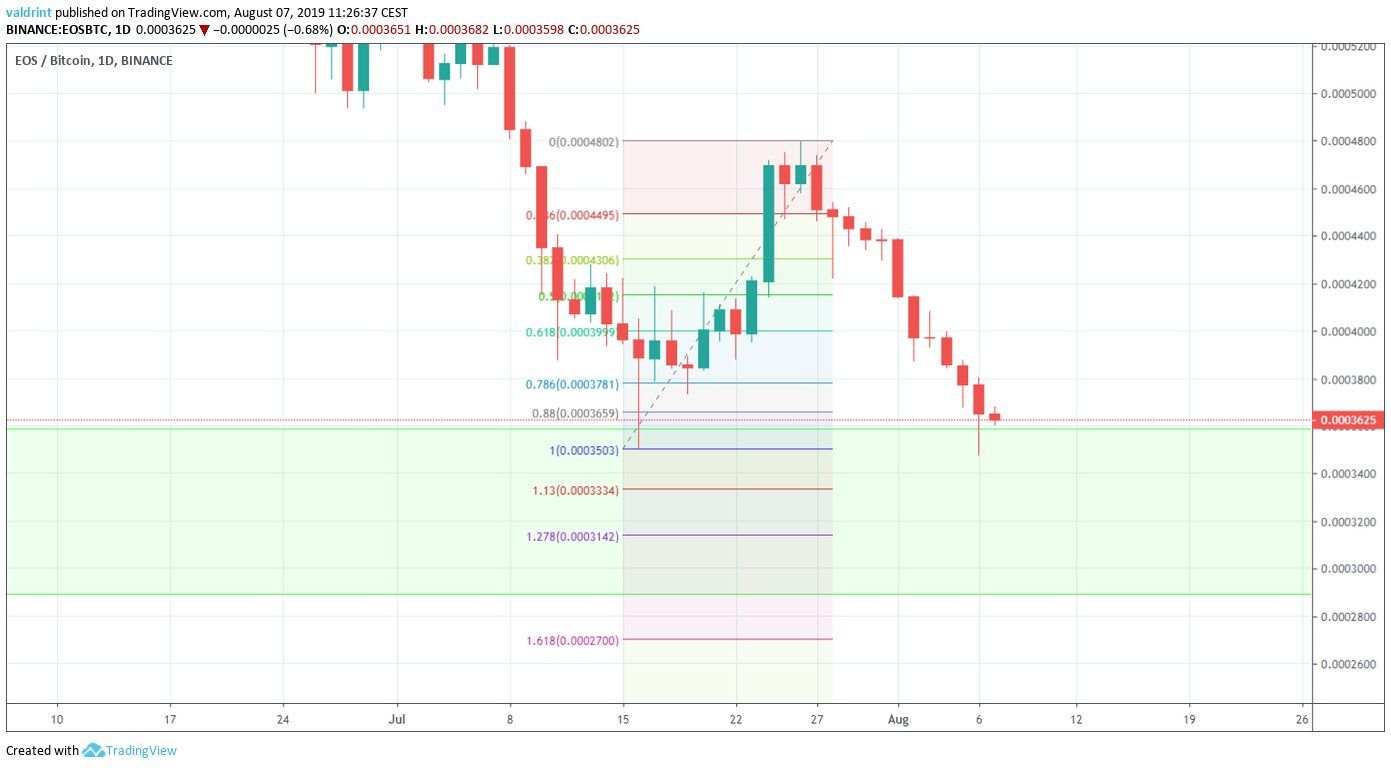
This area is found between 1.27 and 1.13 fib levels, between 3150 and 3300 satoshis.
Once the EOS price reaches this area, we would expect it to begin an upward move.
It is possible that the price immediately begins an upward move without decreasing to this level.
However, if it does, we would not expect it to go lower than 3150 satoshis.
EOS Price Summary
The EOS price has made a double bottom pattern inside a significant support area.
According to our analysis, it is likely to begin an upward move.
However, a short-term decrease is possible before this upward move begins.
Do you think EOS will continue to decrease? Let us know in the comments below.
Disclaimer: This article is not trading advice and should not be construed as such. Always consult a trained financial professional before investing in cryptocurrencies, as the market is particularly volatile.
Images are courtesy of Shutterstock, TradingView.