
On September 7, 2019, the EOS price reached a low of 3074 satoshis. A rapid upward move followed. On September 9, EOS reached a high of 3841 satoshis. Since then, it has been slowly decreasing.
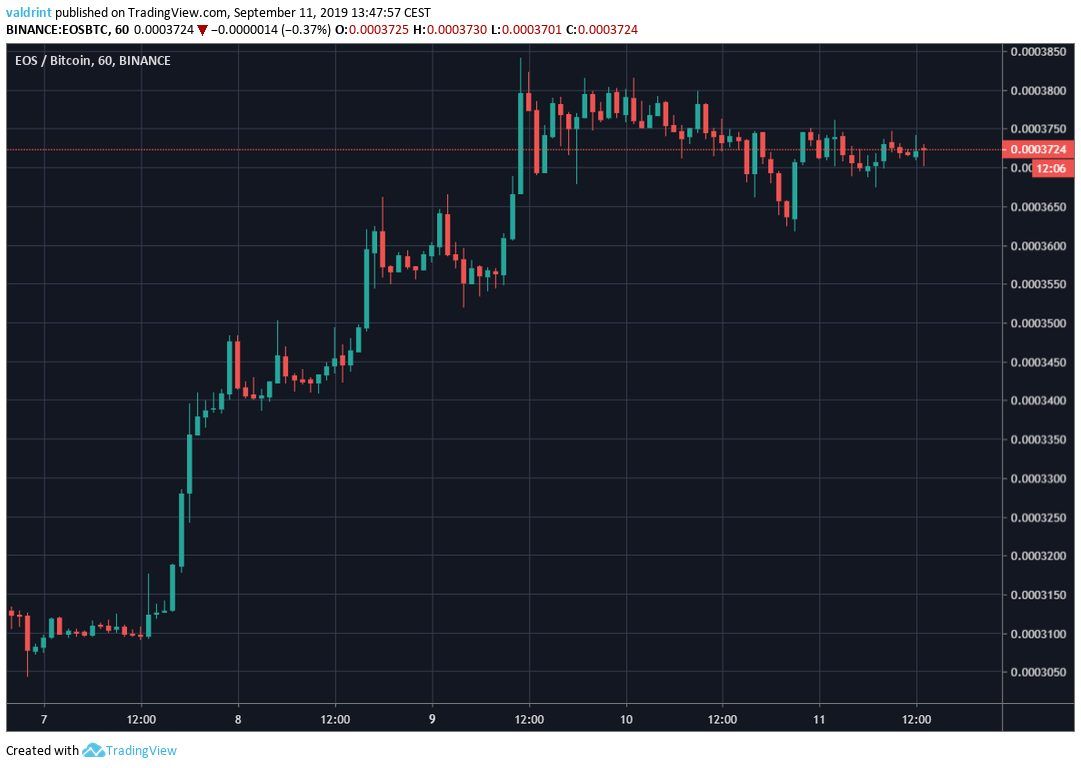
At the time of writing, it was trading close to 3700 satoshis.
Will EOS continue to increase or does a bearish period await? Continue reading if you are interested in finding out.
For our previous analysis, click here.
For those of you that are more interested in a video analysis, please click below:
https://www.youtube.com/watch?v=KdsUB4i-Oog
EOS Price: Trends and Highlights for September 11
- EOS/BTC broke out from a descending wedge
- There is resistance at 3850 and 4200 satoshis.
- Daily moving averages have made a bullish cross.
- The daily MACD has almost turned positive.
- EOS has finished a five-wave Elliott formation.
Previous Movement
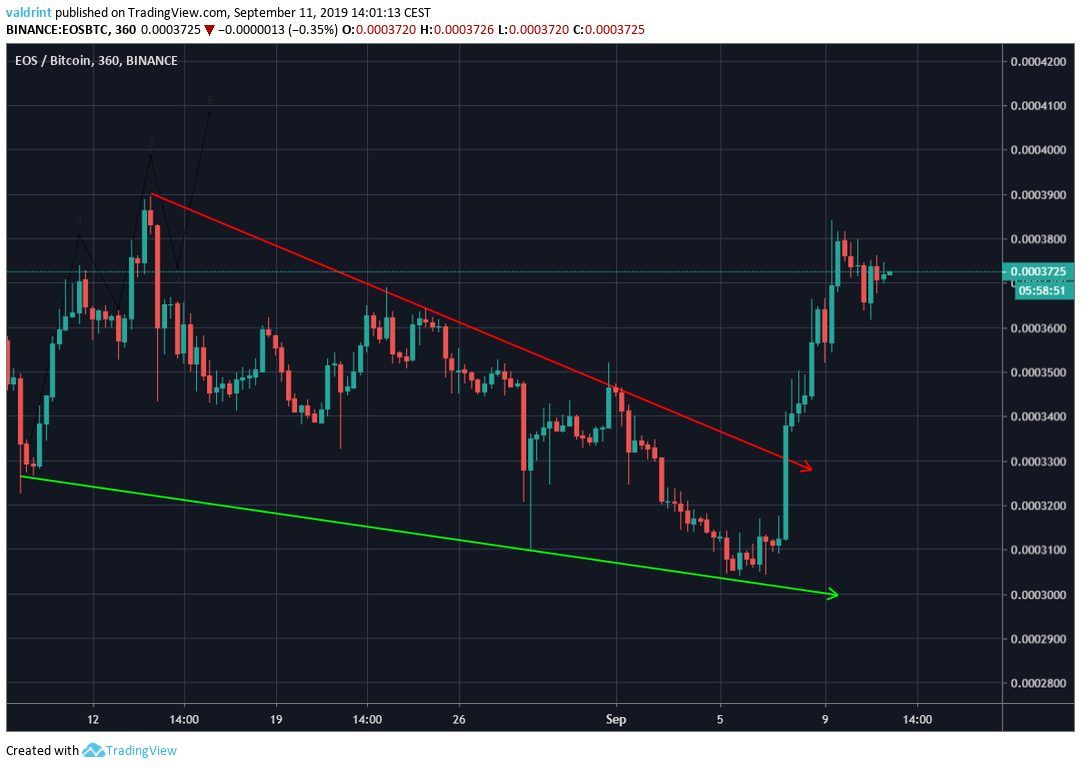
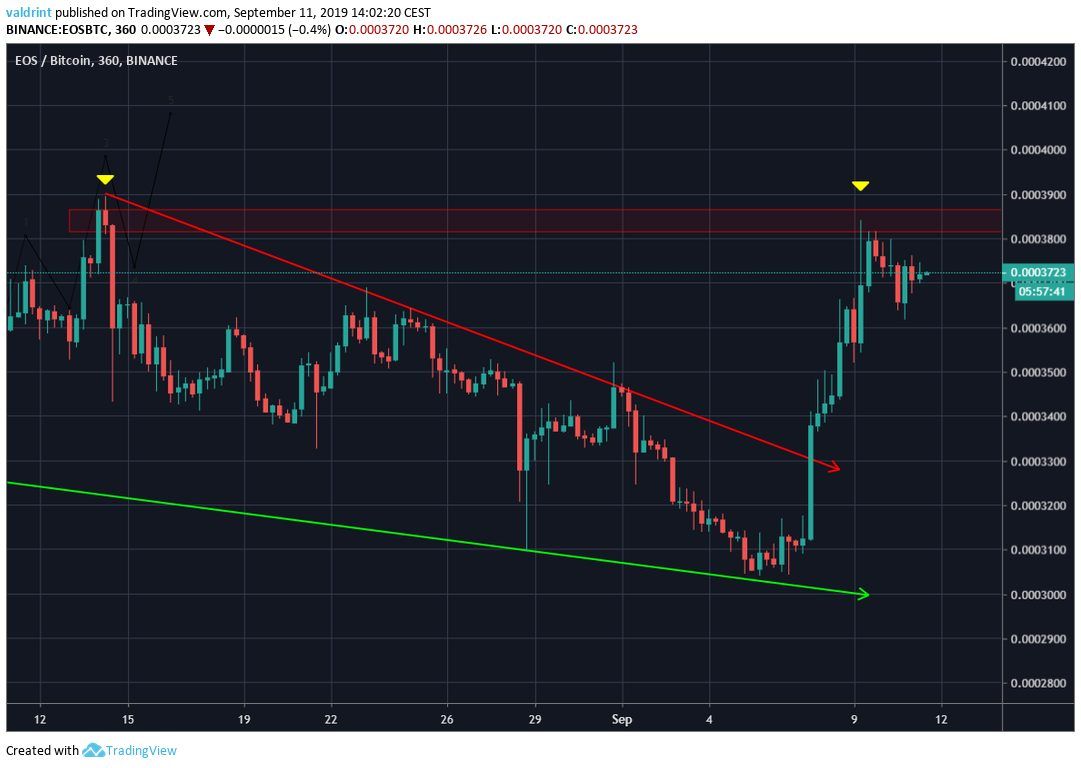
A look at the six-hour time-frame shows that EOS recently broke out from a descending wedge.
Additionally, we can see one resistance area, which is found at 3850 satoshis.
The area marked the beginning of the descending wedge.
Once the price reached it, it began to decrease.
Upward Move
Incorporating the daily moving averages (MA) and the MACD into the analysis reveals that EOS might have begun an uptrend.
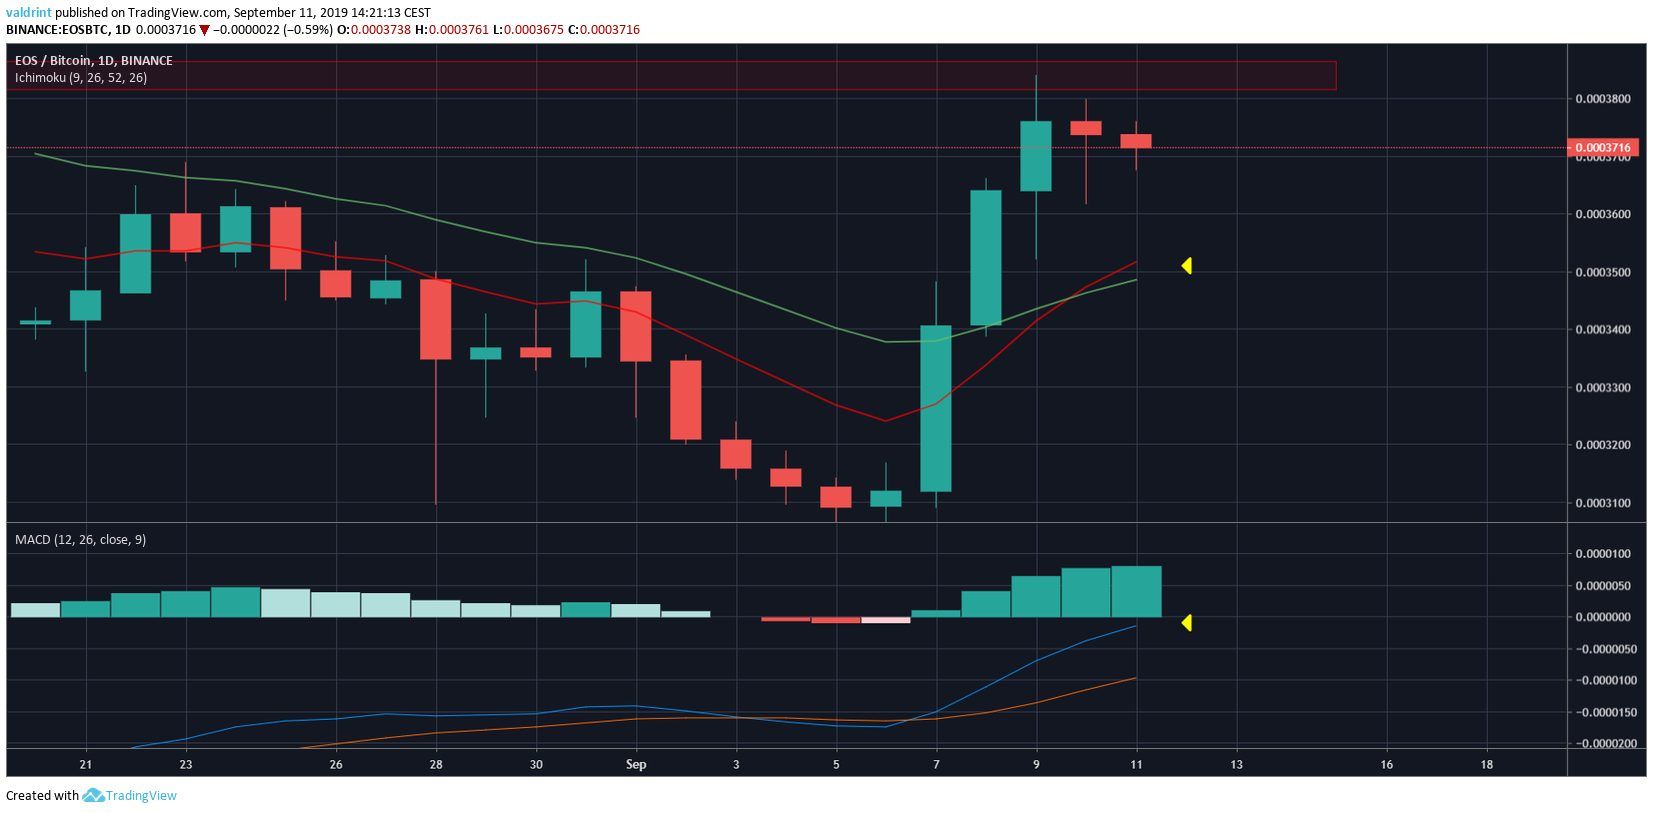
A bullish cross between the 10- and 20-day MAs occurred on September 8.
The price has been trading above both of them since.
Additionally, the MACD has almost crossed into positive territory.
The combination of these two events often indicates that an upward move has begun.
Let’s take a look at the short-term to see how this move might unfold.
EOS Price Elliott Wave
Looking at the two-hour time-frame, we can see that the upward movement has lost most of its power.
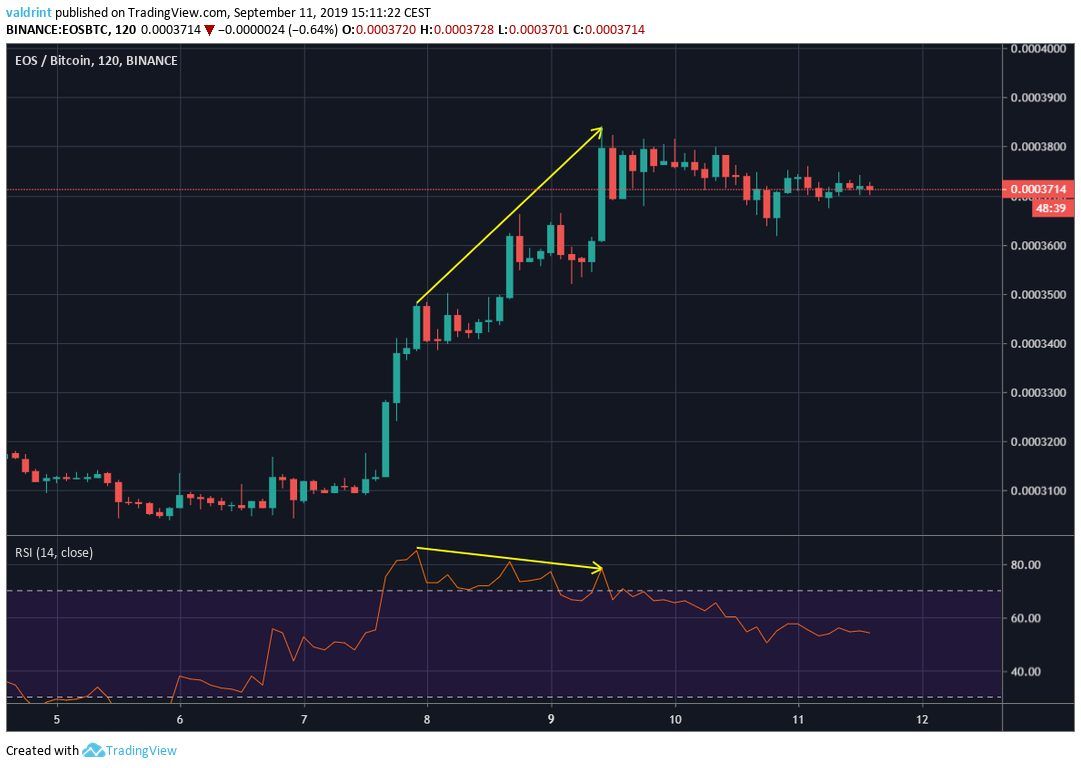
The RSI has been generating bearish divergence since September 7, culminating with the September 9 high.
Additionally, it looks as if the price has finished a five-wave Elliott formation.
After this, a retracement is often likely.
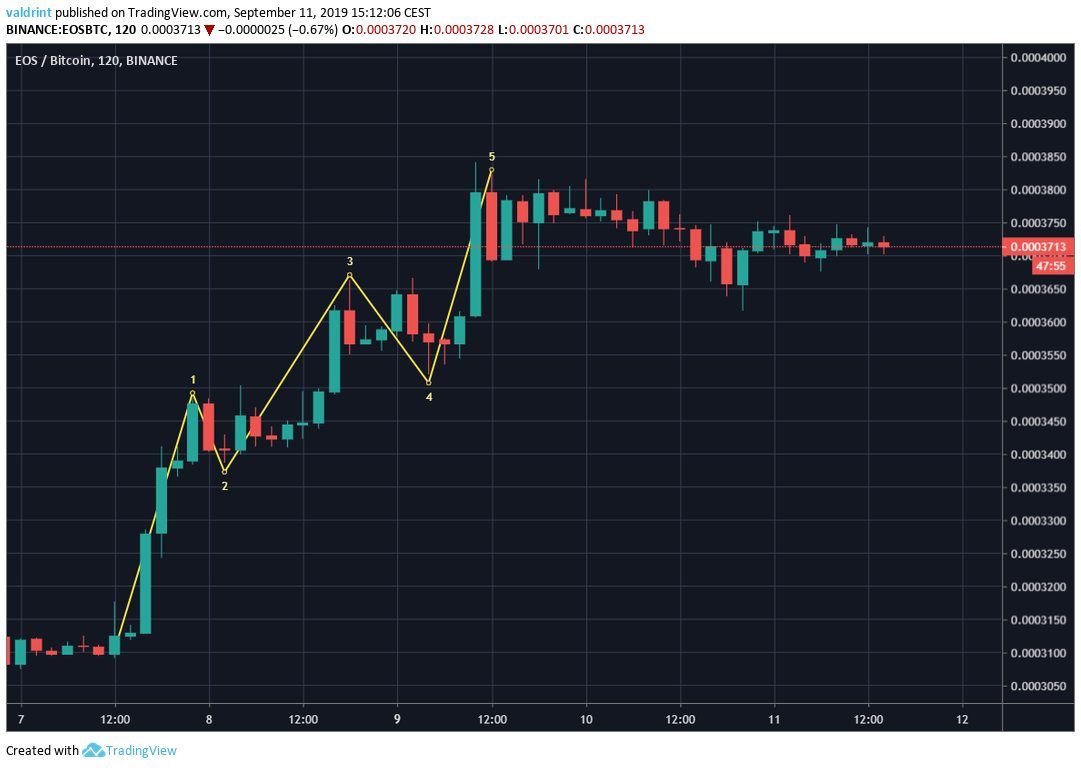
This makes us believe that while EOS has begun a long-term upward move, a brief correction is likely before the price resumes its upward movement.
Future Movement
A possible outline of future price movement is given below.
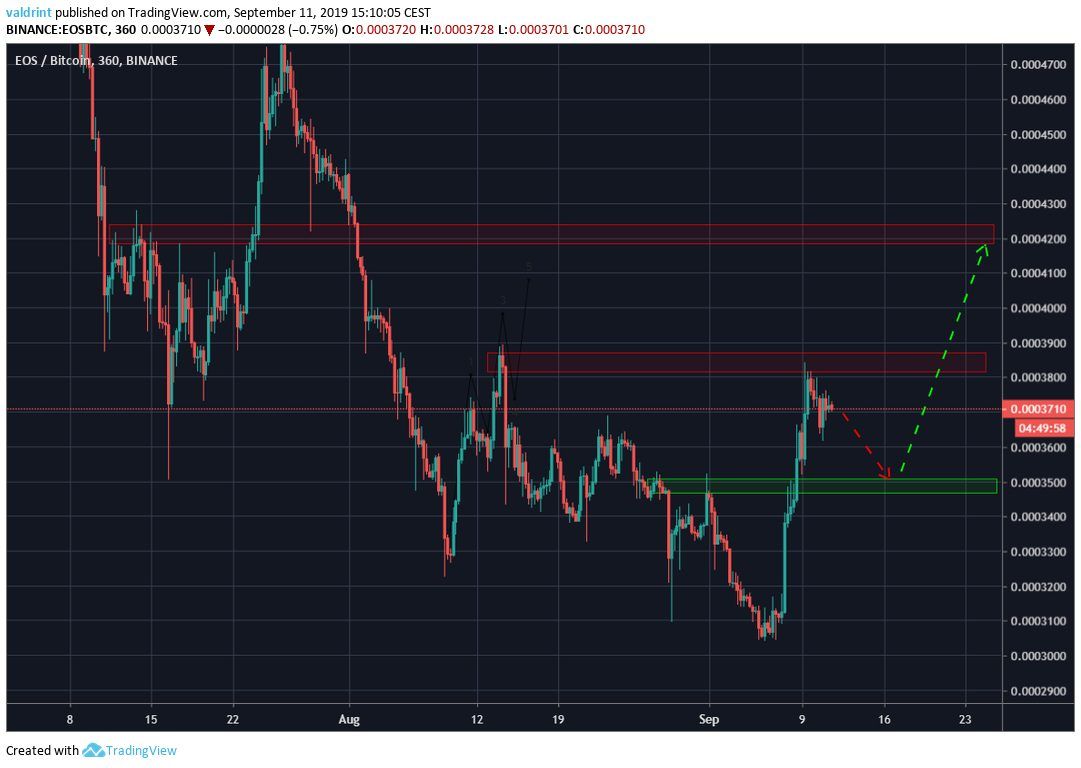
EOS is likely to decrease towards the first minor support area at 3500 satoshis, before resuming its upward movement.
EOS Price Summary
The EOS price recently broke out from a descending wedge.
According to our analysis, it is likely to increase until it reaches the second resistance area.
For hypothetical trading purposes, EOS is considered a buy near 3500 satoshis.
Do you think that EOS will reach our target? Let us know in the comments below.
Disclaimer: This article is not trading advice and should not be construed as such. Always consult a trained financial professional before investing in cryptocurrencies, as the market is particularly volatile.
Images are courtesy of Shutterstock, TradingView.
