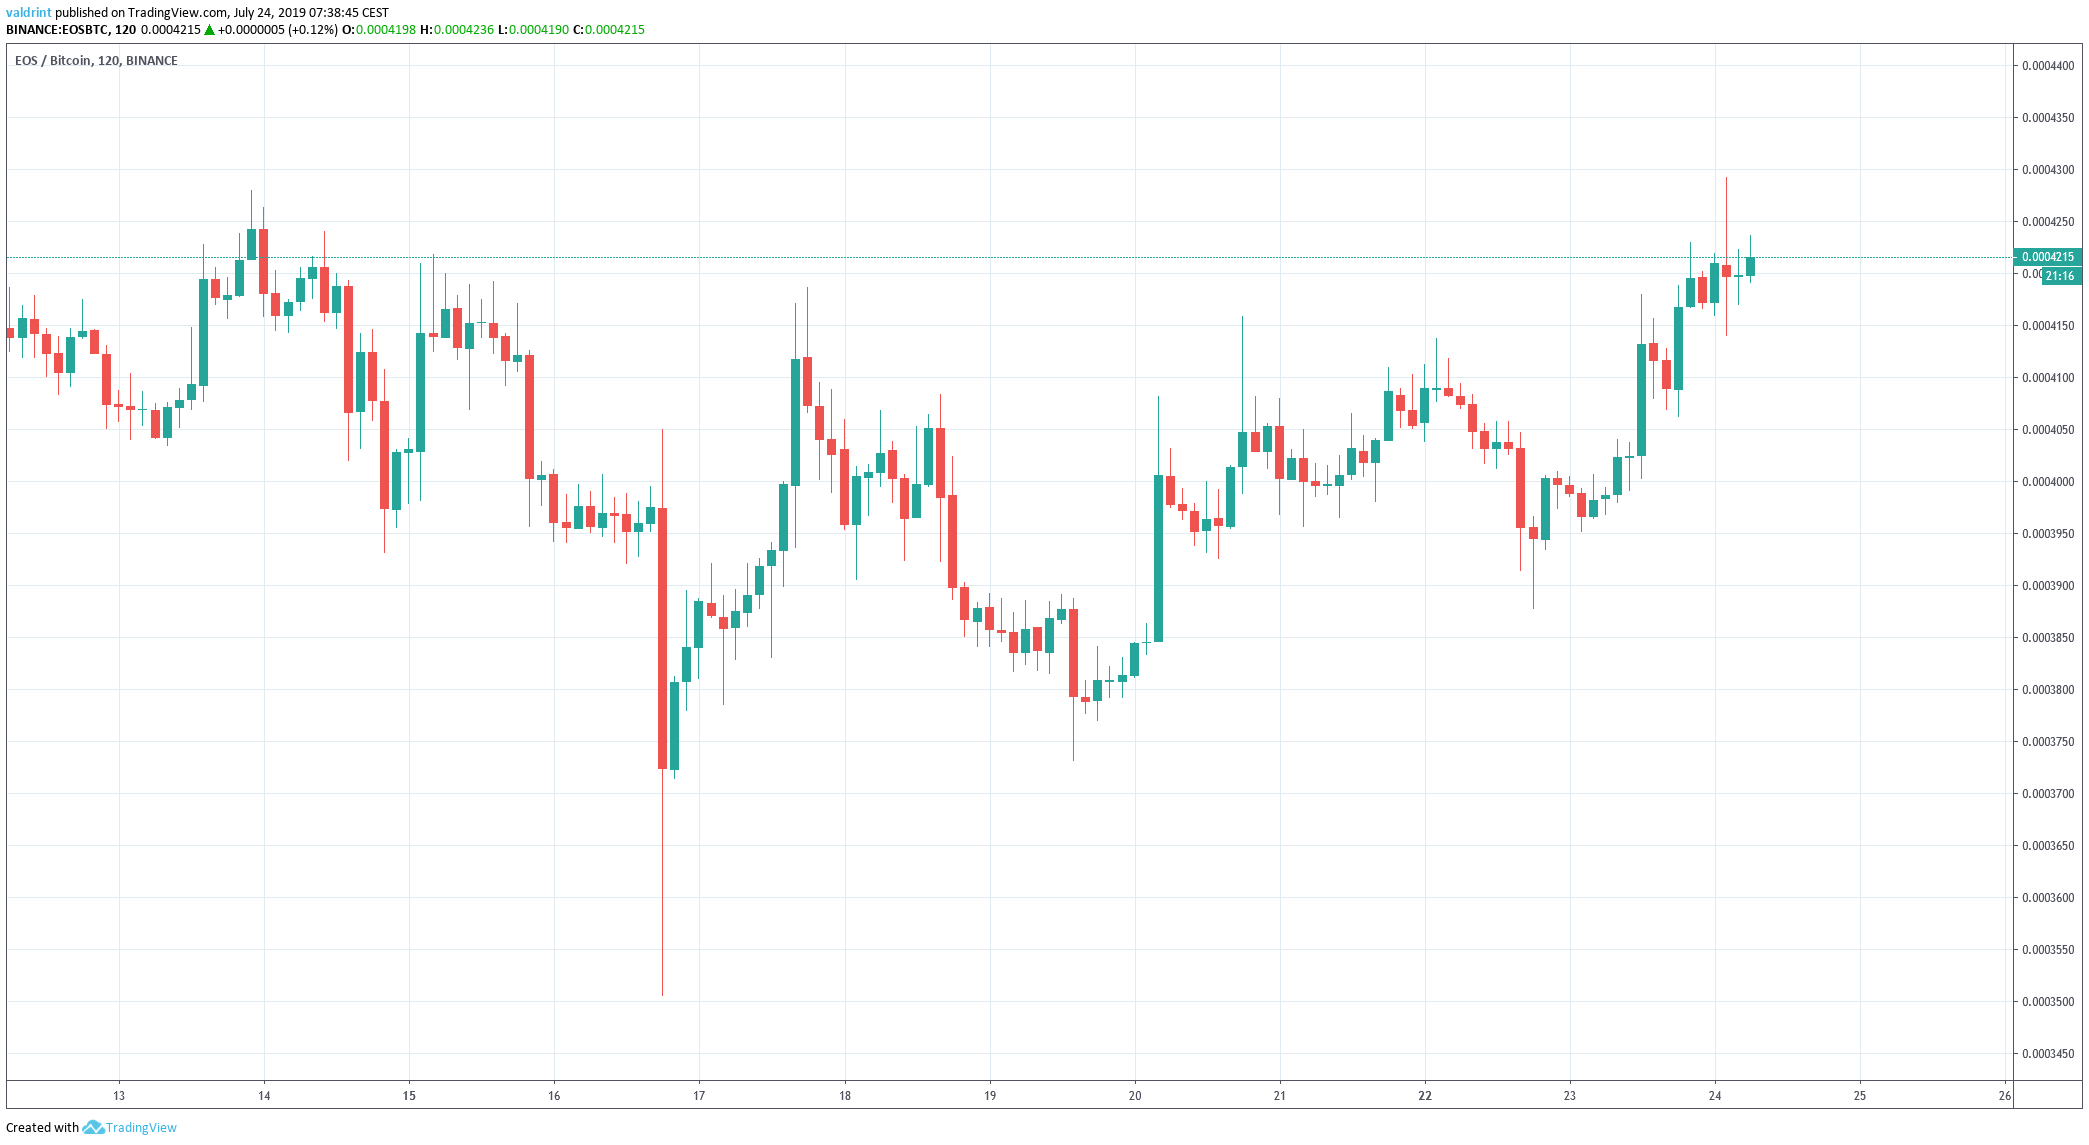
On July 13, 2019, the EOS price reached a high of 4280 satoshis. A decrease ensued. On July 16, it reached a low of 3505 satoshis. It has been increasing since — making highs near 4200 satoshis on several occasions.
Will the EOS price finally break out above this level? Below, we are going to analyze the price in different time-frames alongside technical indicators in order to answer this question.
For our previous analysis, click here.
If you are interested in trading EOS (EOS) with a multiplier of up to 100x on our new partner exchange with the lowest fees, follow this link to get a free StormGain account!
EOS Price: Trends and Highlights for July 24
- EOS/BTC is trading inside an ascending triangle.
- There is resistance at 5200 satoshis.
- There is support at 3800 satoshis.
- Daily moving averages have made a bullish cross.
- Bullish divergence is developing in the RSI.
- There is a minor resistance area at 4700 satoshis.
Significant Areas for the EOS Price
First, we will begin with a long-term view in order to see the current position of EOS’ price relative to significant areas.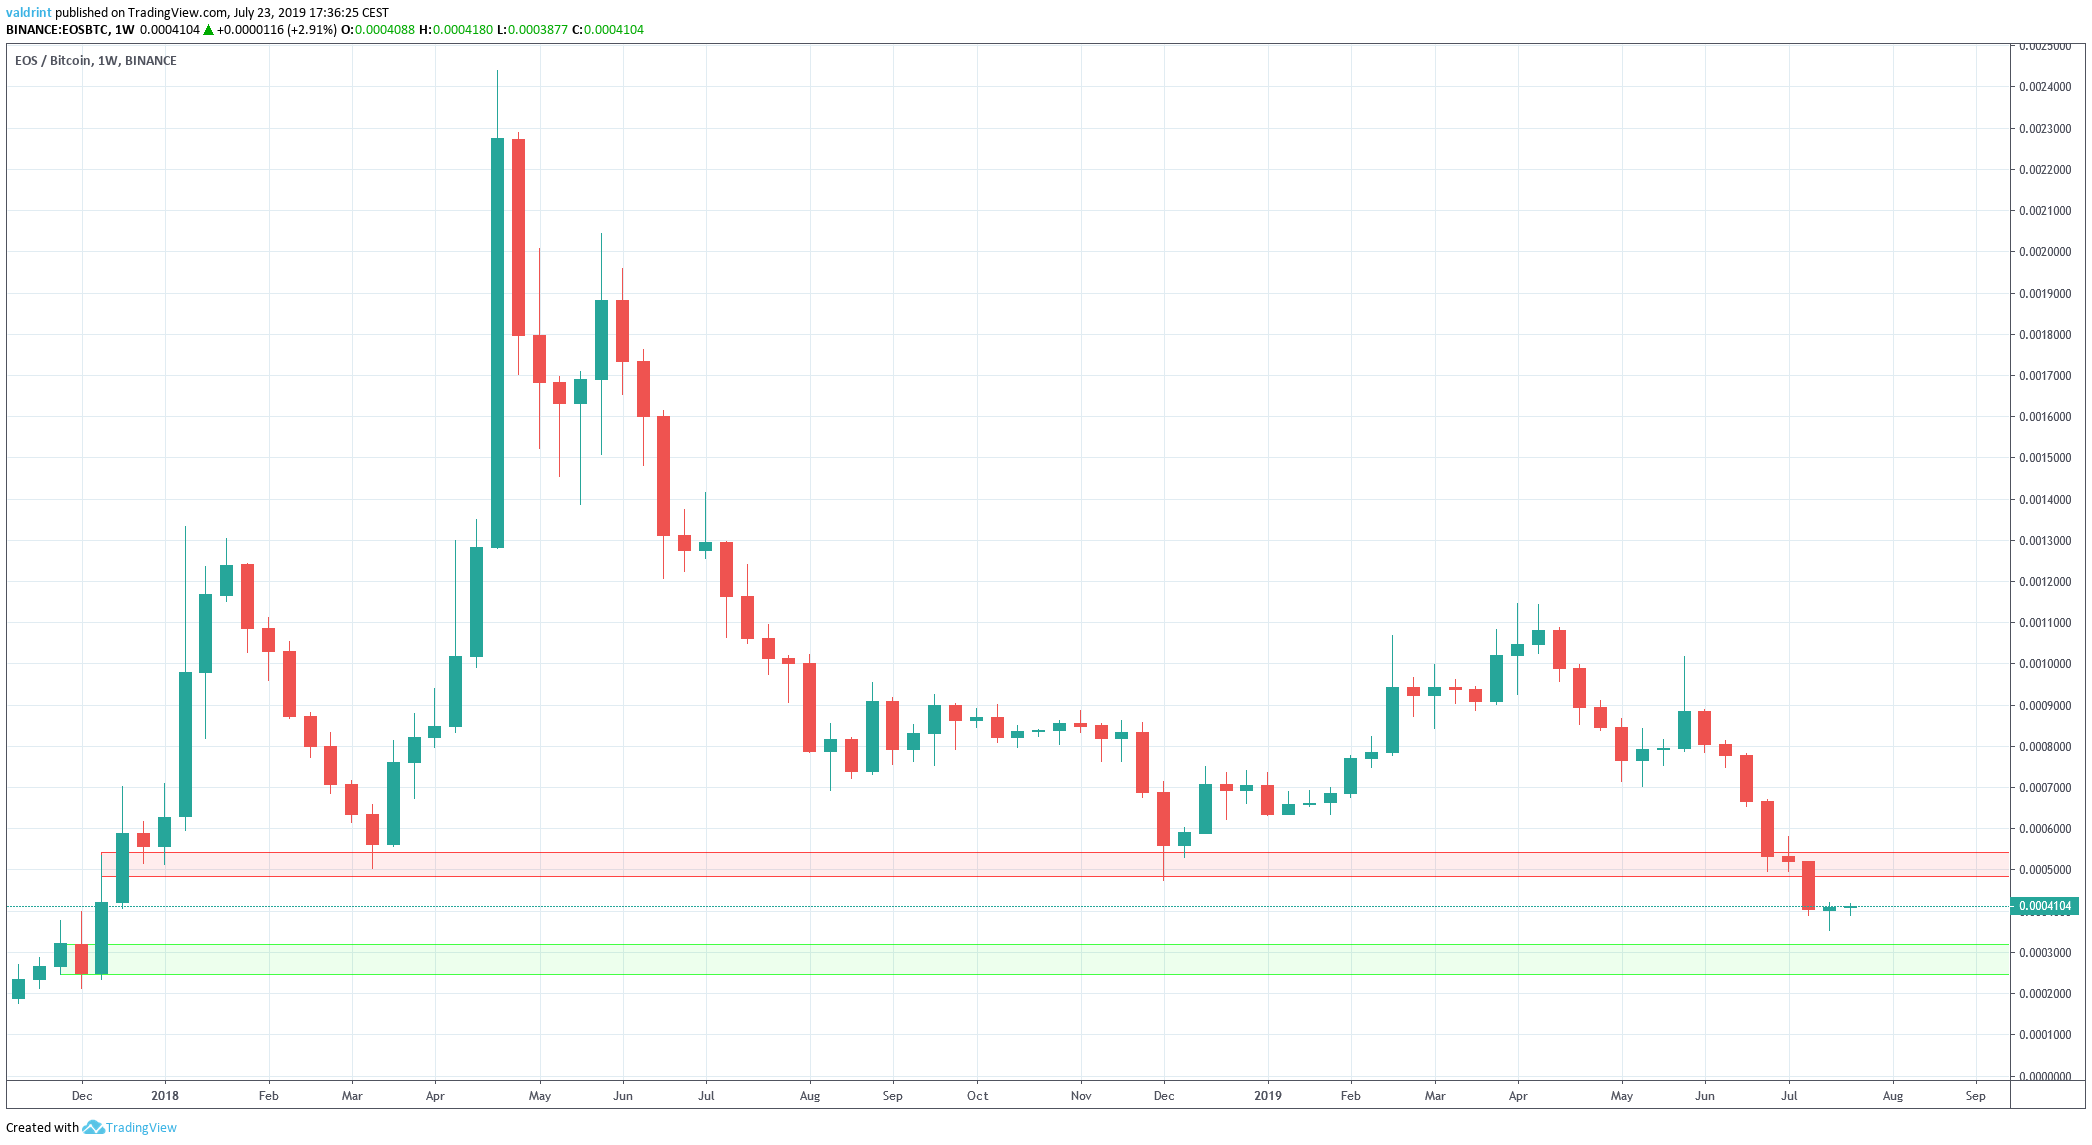 The first significant resistance area is found at 5200 satoshis. This area acted as support on four occasions since the beginning of 2018.
However, recent price decreases at the beginning of July caused the price to break down from it.
The next closest support area is found at 3200 satoshis, created by the lows of December 2018.
At the time of writing, the EOS price was trading between these two areas.
EOS Price in an Ascending Triangle
A look at the short-term shows that, since reaching a low on July 16, EOS has been increasing gradually — trading inside the ascending triangle outlined below.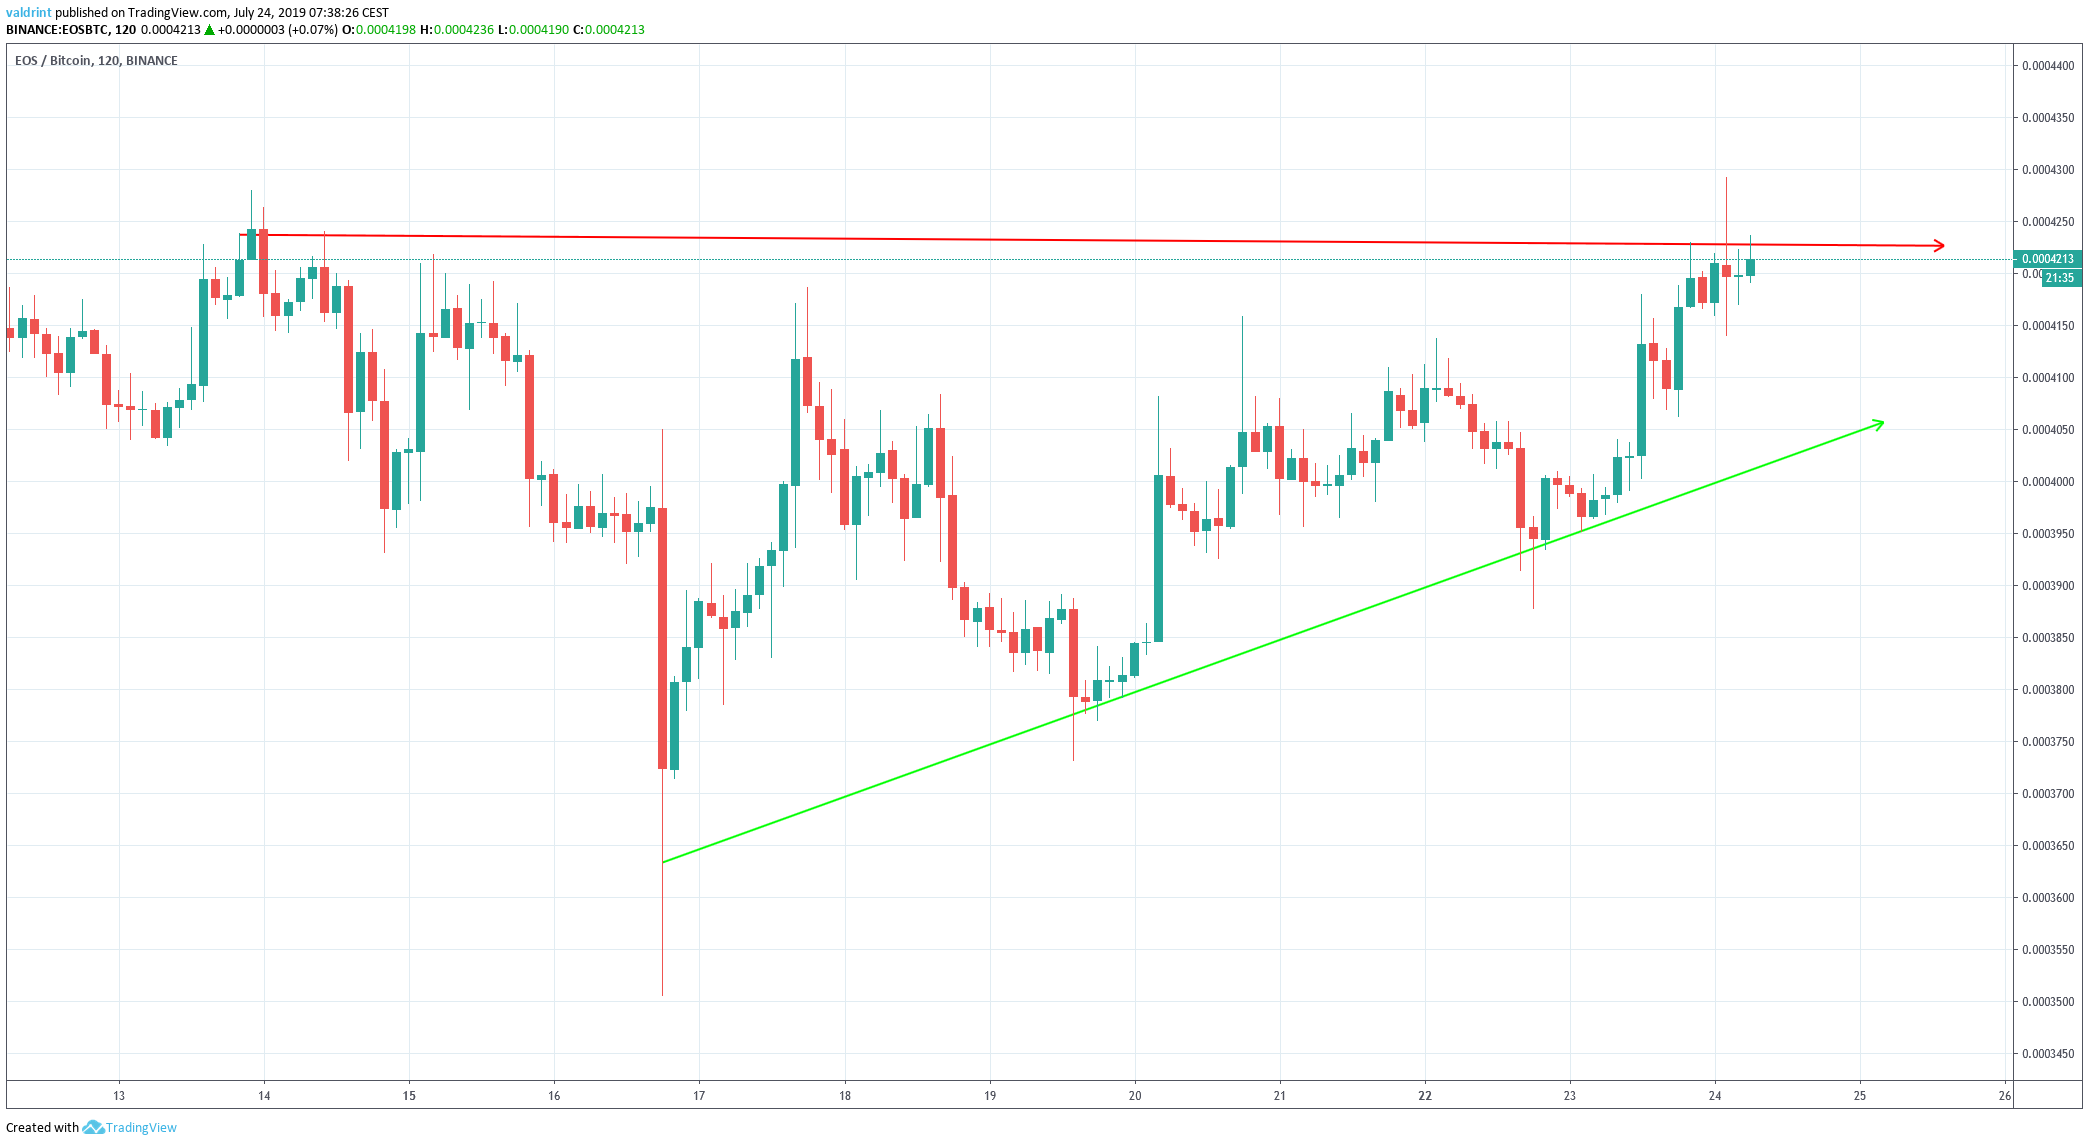 The ascending triangle is considered a bullish pattern — making price breakouts more likely.
Furthermore, the massive lower wick of the bearish triangle on July 16 indicates that there is significant buying pressure.
At the time of writing, the EOS price was on the verge of breaking out.
This is the fourth time it has done so.
Will it finally be successful in doing so?
Technical Indicators
The EOS price is analyzed alongside the MACD and the 10- & 20-period moving average (first graph) and the RSI in the second
A look at the 10- and 20-day moving averages (MA) & the MACD indicates that the EOS price is in the first stages of a possible uptrend.
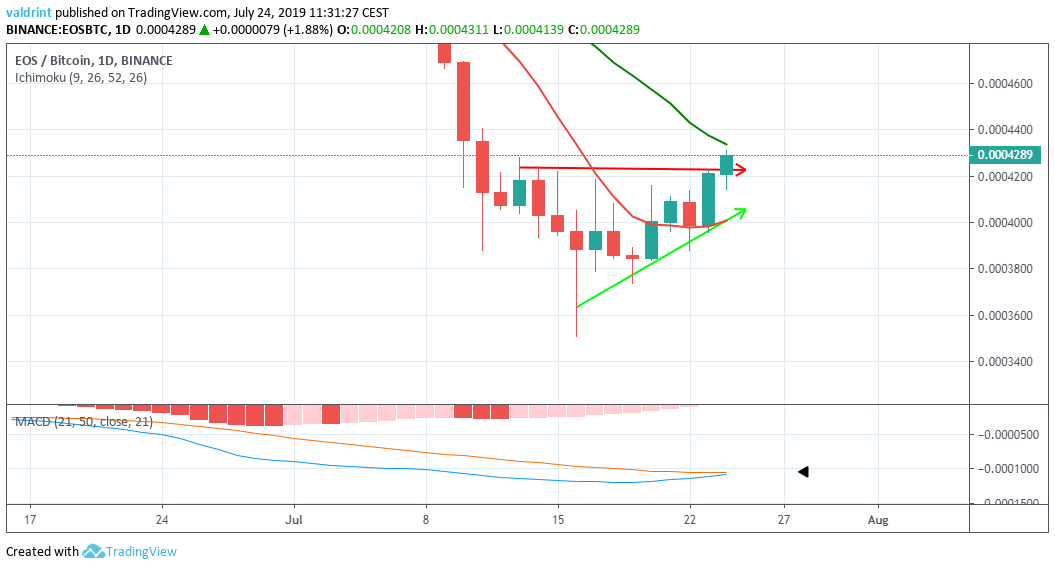 The EOS price has moved well above the 10-day moving average and has briefly reached the 20-day one.
The 10-day MA is turning upward, possibly setting itself up for a bullish cross.
However, the price is still facing resistance from the 20-day MA.
Another bullish indication is given by the RSI.
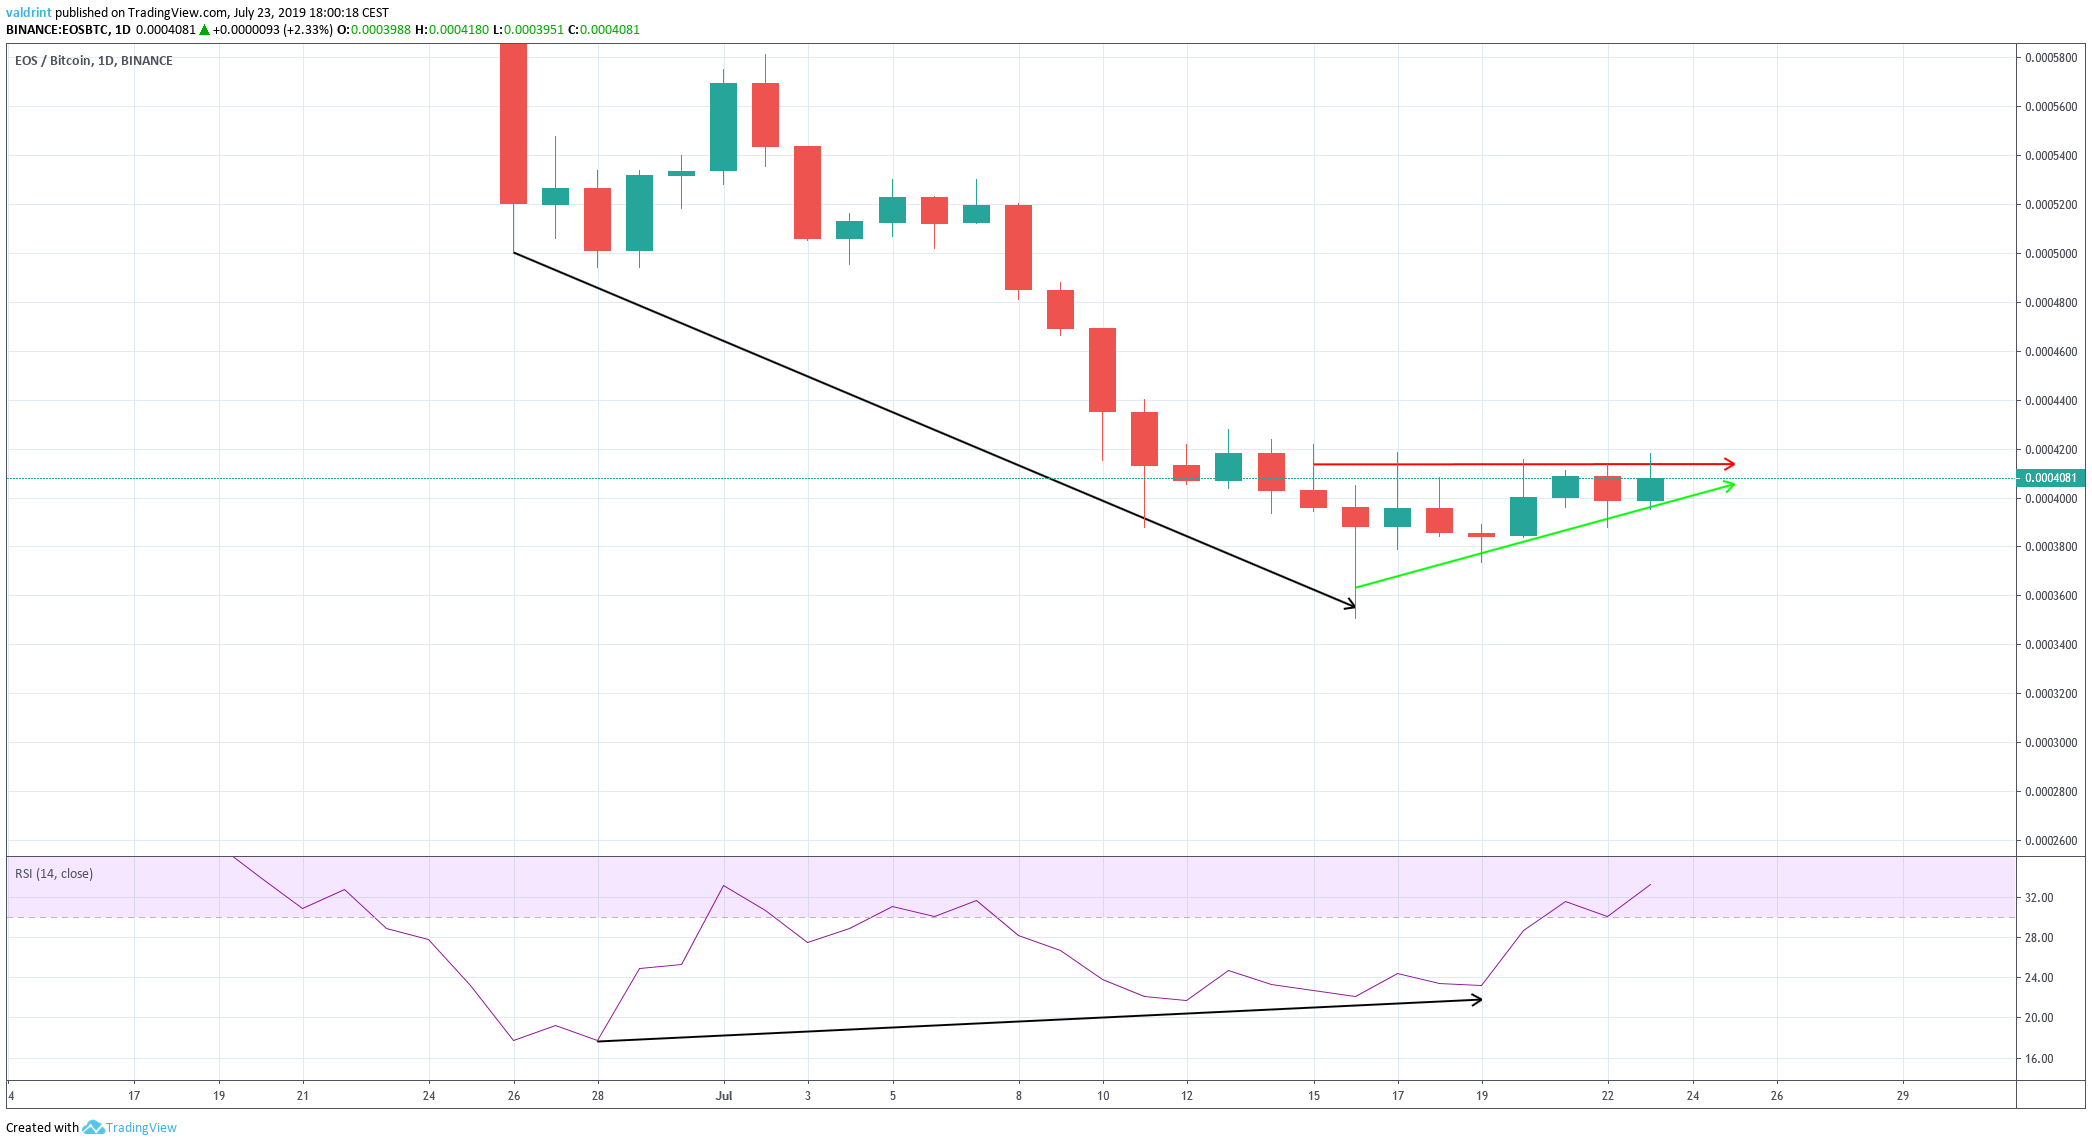 A significant bullish divergence has been developing in the daily time-frame.
This divergence, however, is not present in the MACD or in longer-term time frames.
The combination of these indicators suggests that the EOS price will soon break out of the current pattern.
Potential Reversal
If the EOS price breaks out, one area that is likely to provide a reversal is outlined below: The closest resistance area is found near 4700 satoshis.

