


On Apr 10, 2019, the price of EOS reached a high of $6.07 and €5.38. A sharp decrease ensued, and the price reached a low of $5.07 and €4.53 on Apr 12. It reached the same levels on Apr 24.
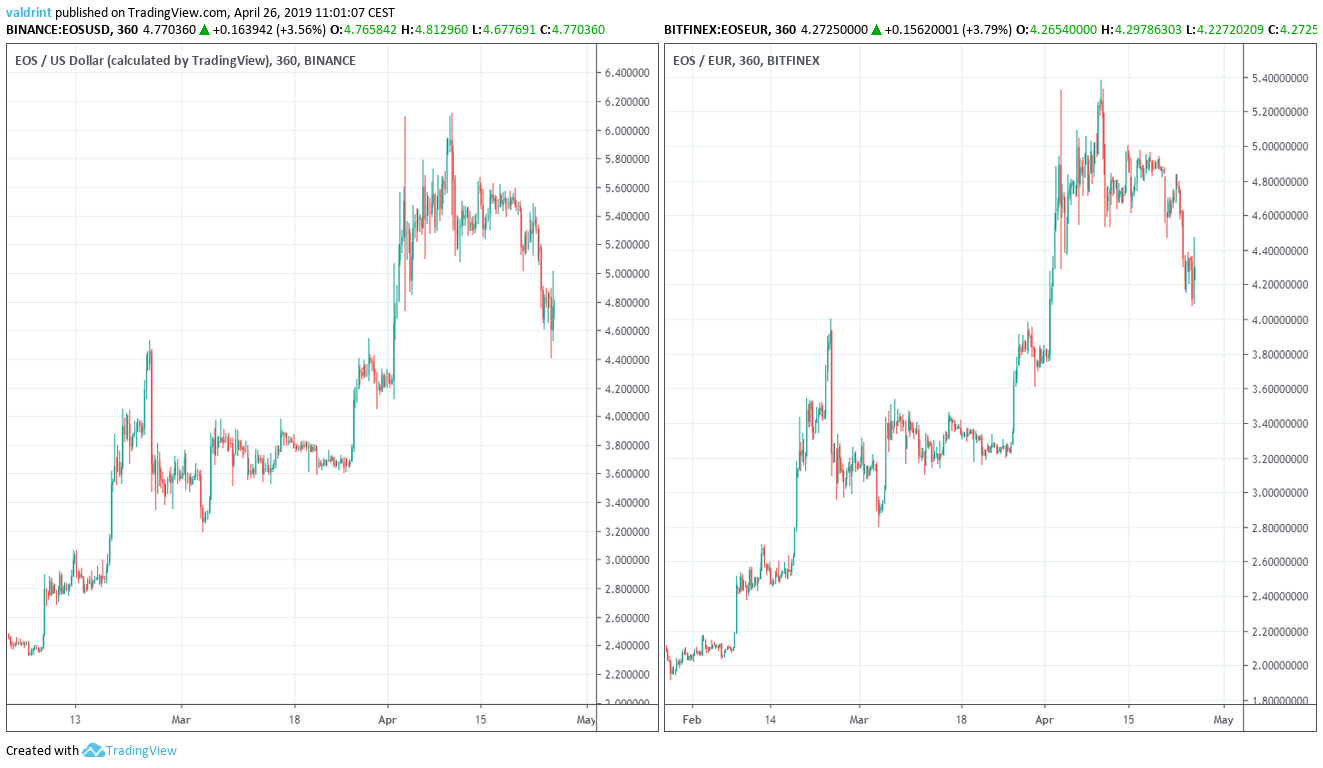
A sharp decrease began At the time of writing, the price of EOS has made lows close to $4.4 and €4.0
Where will the price go next? Let’s find out.
EOS: Trends And Highlights For April 26, 2019
- The price reached a high of $6.07 and €5.38 on Apr 10.
- It is trading inside a symmetrical triangle.
- Bullish divergence is developing in the RSI.
- There is support near $4.0 and €3.4.
Tracing the Current Trading Pattern
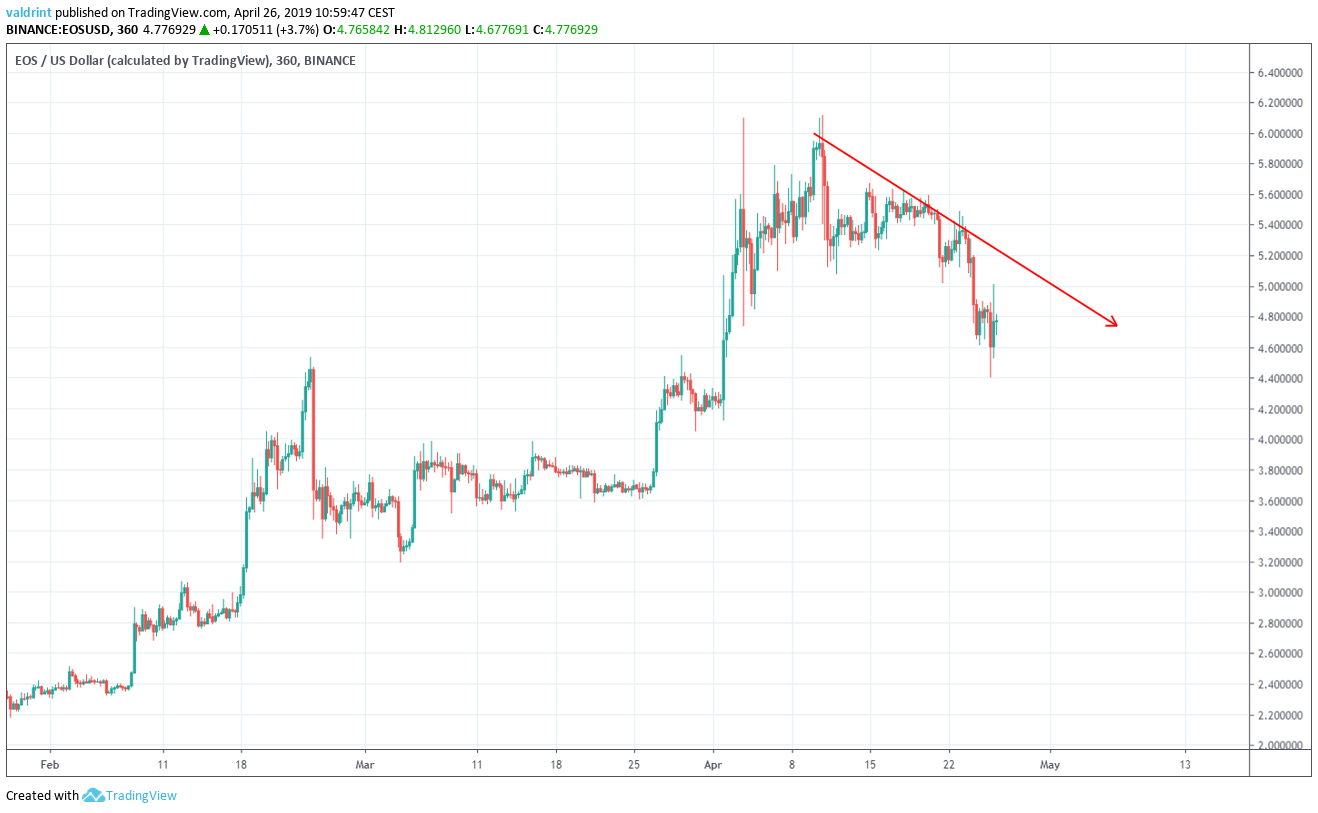
On Apr 10, the price made a high of $6.27. Several market cycles have been completed and the price has made several lower highs.
Tracing these highs gives us a descending resistance line:
Tracing these lows gives us an ascending support line. The support and resistance lines combine to create a symmetrical triangle:
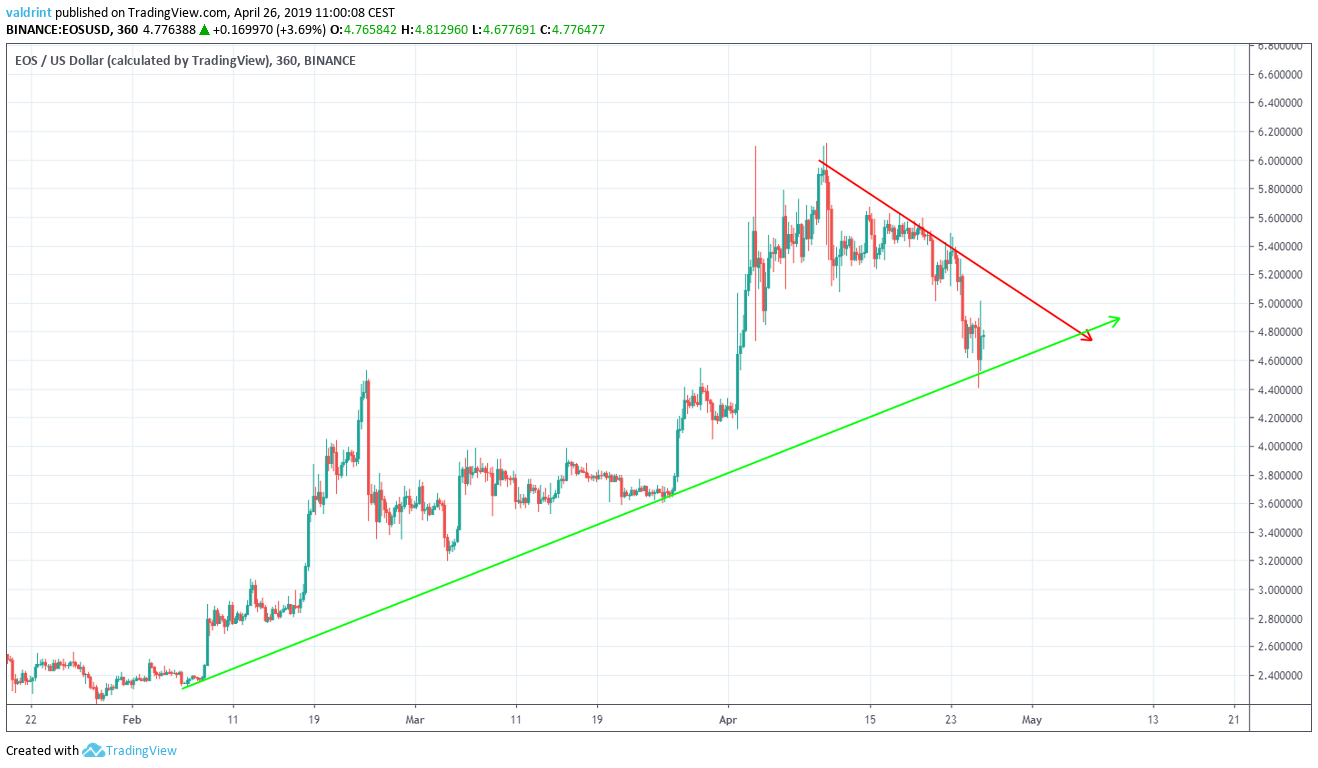
It is likely that the price will keep trading inside the confines of this triangle until a decisive move occurs. In order to figure out the direction of the move, we need to look at some technical indicators.
Technical Indicators
In this section, we incorporate the relative strength index into our analysis.

On Apr 24, the price made a low of $4.14. It made a lower low of $4.11 on Apr 25.
Similarly, the RSI reached a low on Apr 24. However, it has proceeded to generate higher values.
This is known as bullish divergence and often precedes price increases.
The use of this indicator makes it likely that the price will increase towards the resistance line of the triangle.
Future Movement
In this section, we incorporate support areas into the analysis to determine possible future price levels beyond the support line alone.
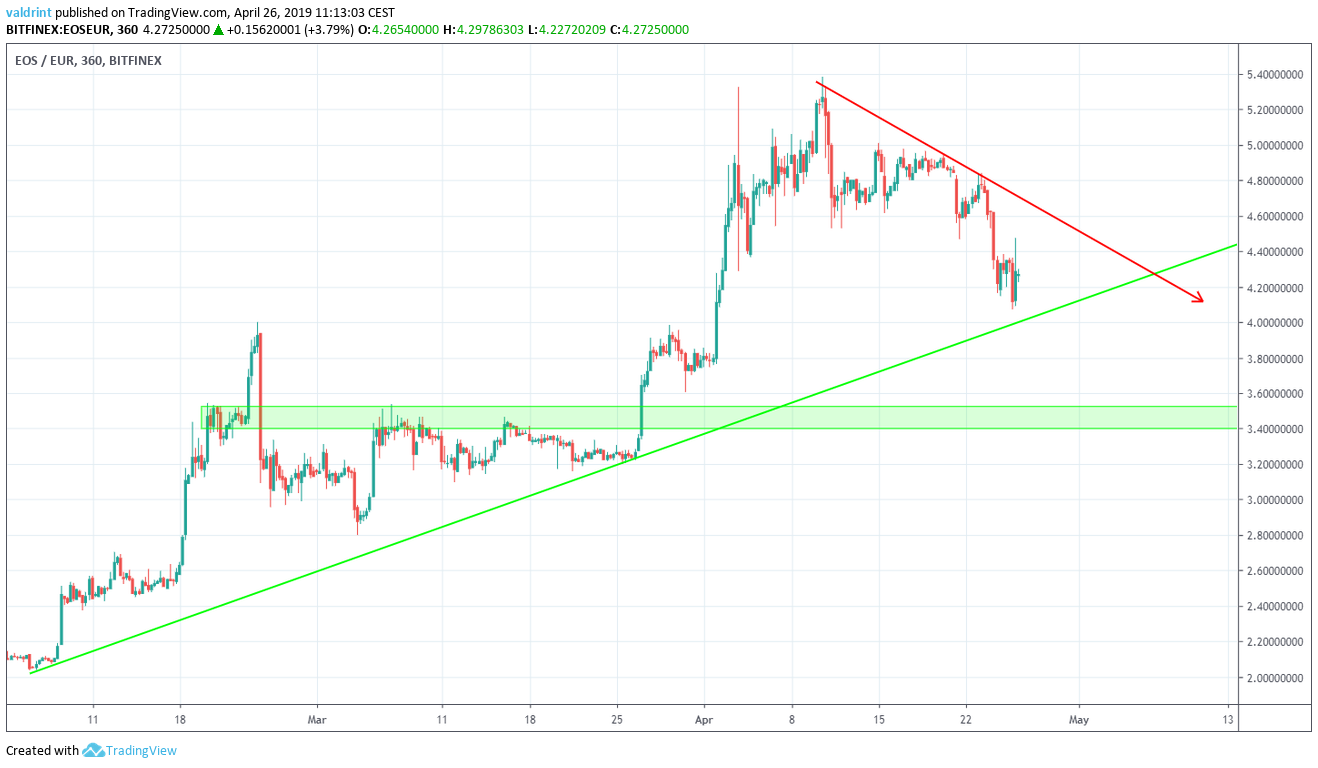
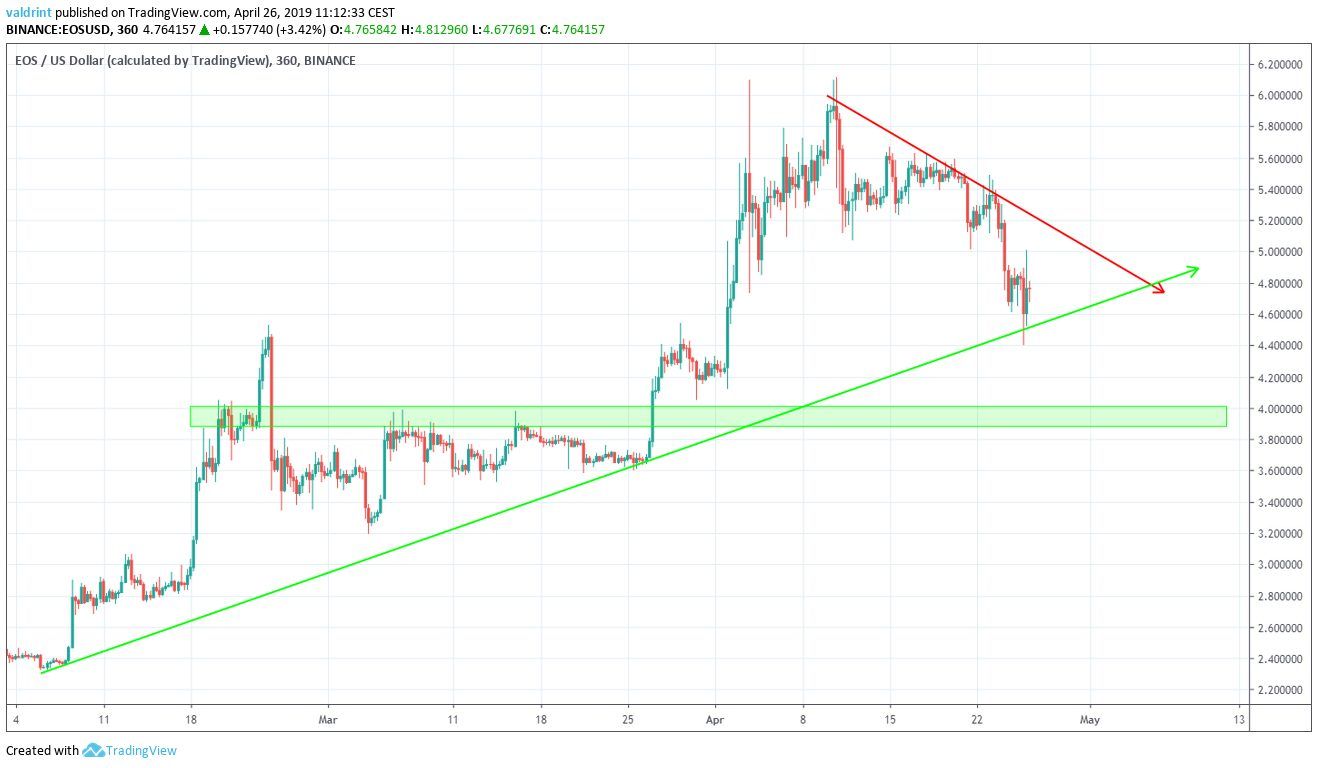
The closest support area is found near $4 and €3.4. If the price breaks down from the triangle, it is likely to reach this area.
We do not believe this to be likely. On the contrary, EOS appears more likely to rise toward the resistance area. A breakout is possible but not expected.
Summary of Analysis
Based on our analysis, it is likely that the price will begin to increase towards the resistance line of the triangle. While prices may near $5, it may still be sometime before EOS breaks this threshold. However, levels over $4.80 and €4.3 may be reached.
Do you think the price of EOS will begin a reversal? Let us know your thoughts in the comments below!
For 2019 and 2020 price predictions, click on the green button below:
Disclaimer: This article is not trading advice and should not be construed as such. Always consult a trained financial professional before investing in cryptocurrencies, as the market is particularly volatile.


