See More

EOS Crashes Below $5! (EOS/USD and EOS/EUR Price Analysis for 04/24/19)

3 mins
Updated by Alexander Fred
Join our Trading Community on Telegram
At BeInCrypto, we offer regular price analyses and predictions of the most popular and relevant cryptoassets. In our Apr 22 analysis of EOS (EOS), we predicted a slight price increase. The price increases and reached the resistance area on Apr 23. However, a sharp decrease ensued and the price broke down from the channel we defined.  To learn more, read our EOS/USD($) and EOS/EUR(€) analysis below:

On Apr 10, 2019, the price of EOS reached a high of  $6.07 and €5.38. A sharp decrease ensued, and the price reached a low of $5.07 and €4.53 on Apr 12.
After a gradual increase, the price dropped to the same levels on Apr 22.
EOS Market Outlook
EOS /USD & EOS/EUR Prices: Apr 11 – 24
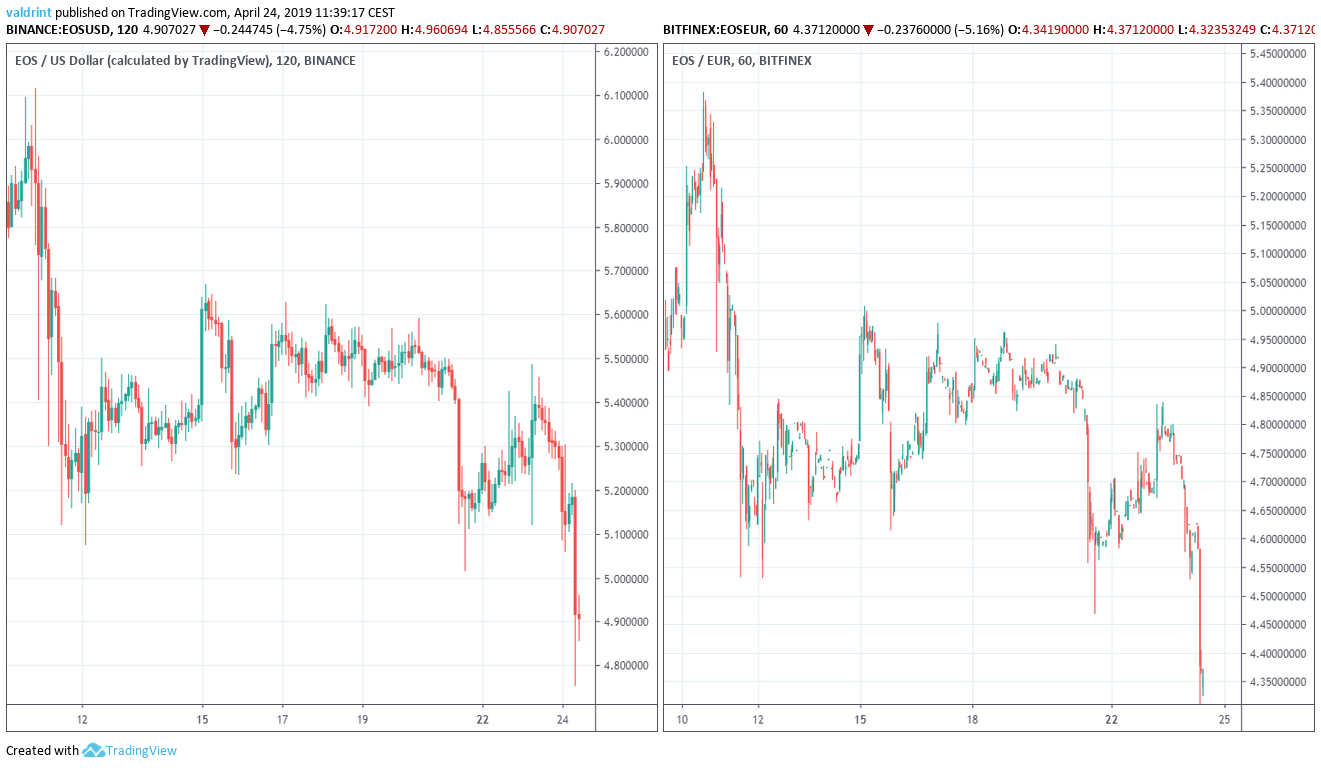
A sharp decrease began on Apr 24. At the time of writing, the price of EOS was trading close to $4.8 and €4.2 Where will the price go next? Let’s find out.

EOS: Trends And Highlights For April 24, 2019

  • EOS reached a high of $6.07 and €5.38 on Apr 10.
  • It is trading inside a symmetrical triangle.
  • Moving averages have made a bearish cross
  • There is support near $4.5 and €4.0.

Tracing the Current Trading Pattern

The price of EOS/USD on Binance was analyzed at two-hour intervals from Apr 12 to Apr 24 to trace the current trading pattern. We do not include euros in this section because only one trading pair is needed to accomplish this. Both EOS/USD and EOS/EUR are discussed in the final section.
On Apr 10, the price made a high of $6.27. Several market cycles have been completed and the price has made several lower highs. Tracing these highs gives us a descending resistance line. Resistance Line
Price losses along this downward facing resistance line are occuring as part of longer-term gains. EOS has been following a long-term support line since Feb 1 as shown in the graph below:
Support Line 
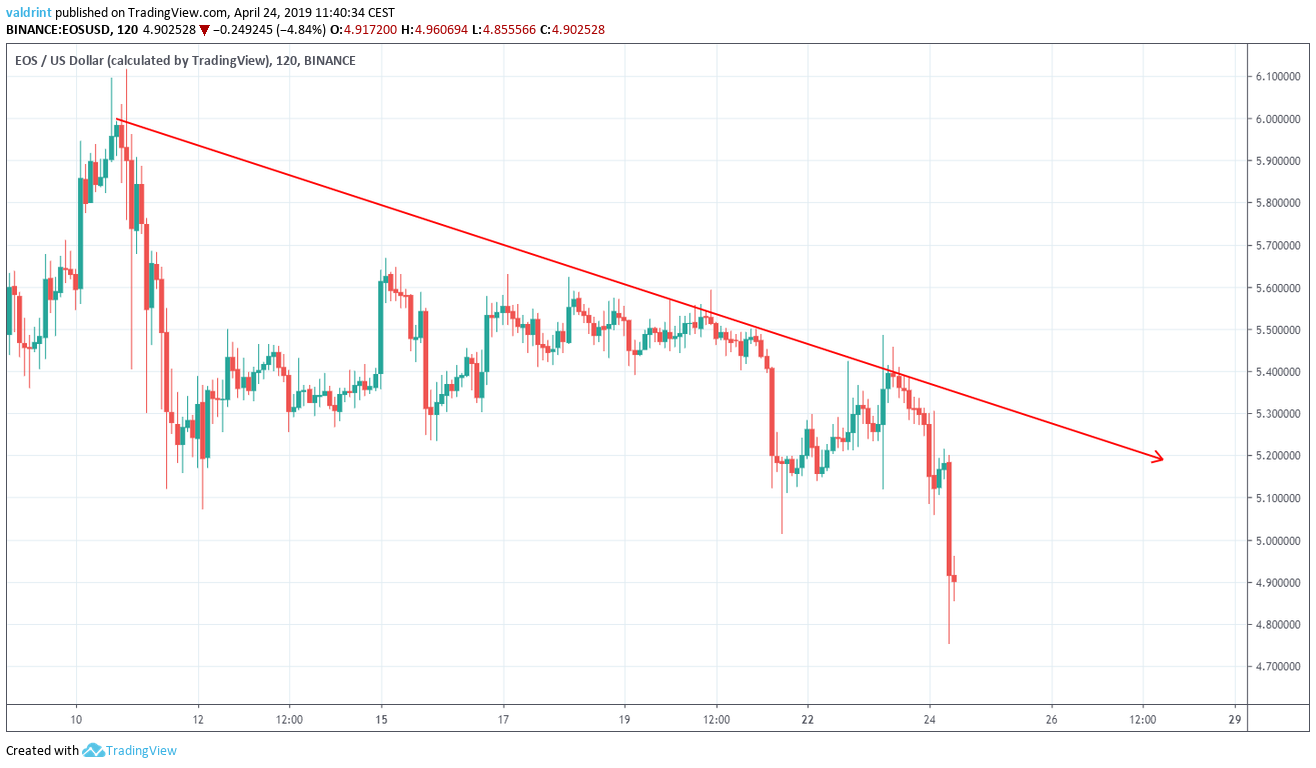
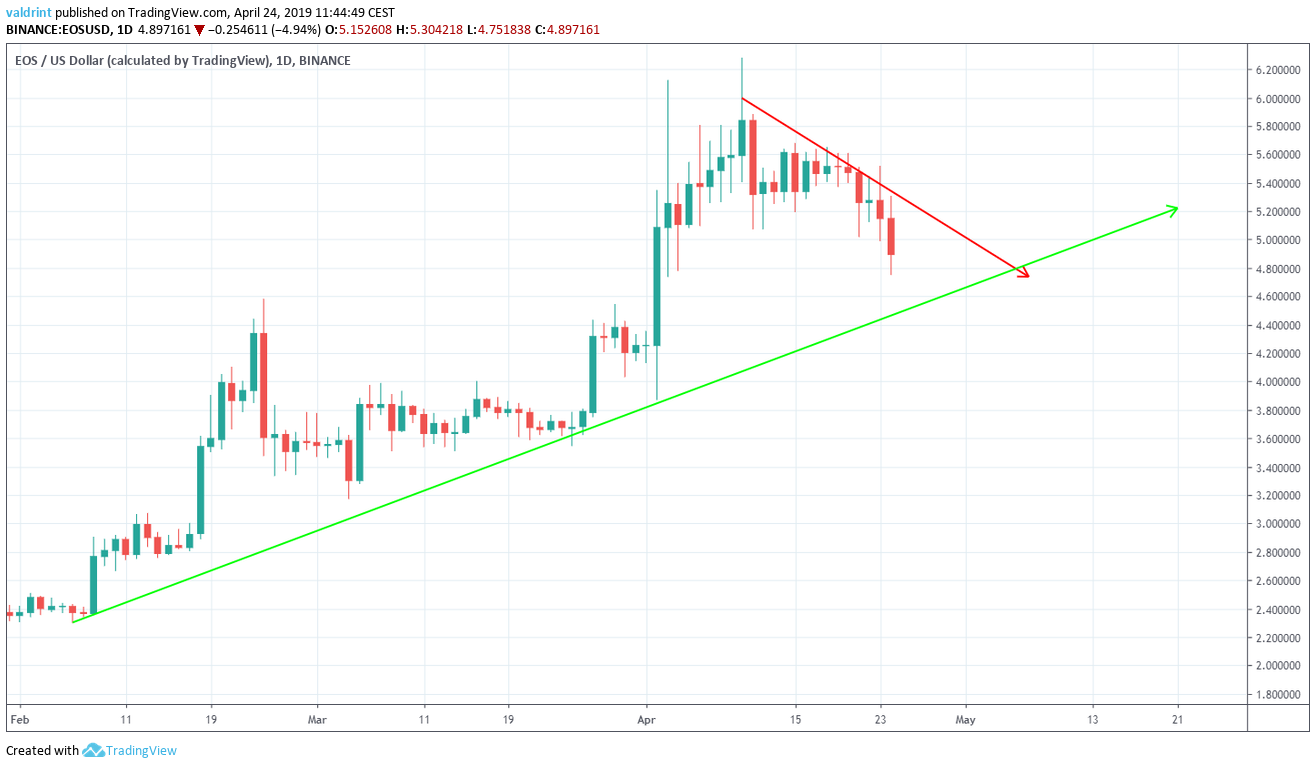
The resistance and support lines combine to create a symmetrical triangle. It is likely that the price will keep trading inside the confines of this triangle until a decisive move occurs. In order to figure out the direction of the move, we need to look at some technical indicators.

Technical Indicators

In this section, we incorporate moving averages into our analysis.
Moving averages are tools used in technical analysis to smooth out price action. It is a lagging indicator since it is based on past prices. The relationship between short and long-term moving averages can help in identifying the beginning and end of a trend.
The 10-day and 20-day moving average (MA) is traced for EOS/USD below:
Moving Averages
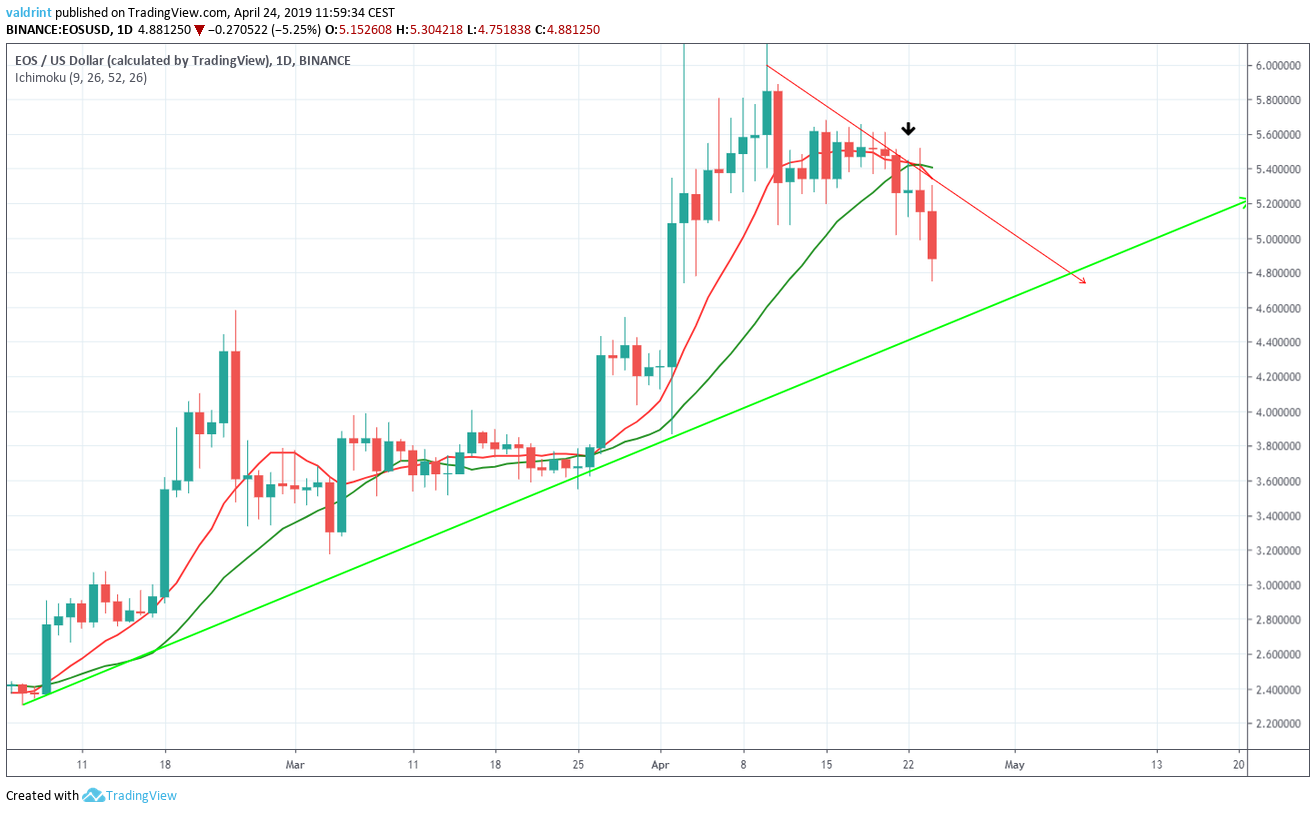
On Apr 23, the 10-day MA crossed below the 20-day MA. This is known as a bearish cross and often indicates that a downtrend may begin. The price decreased the next day and may continue doing so in the near future. We believe that EOS may reach the support line soon.

Future Movement

In this section, we incorporate support areas into the analysis to determine possible future price levels beyond the support line alone.
Support areas are created when the price reaches a certain level numerous times. They can act as a reversal area in case a breakdown or breakout occurs.
One support area is shown for EOS/EUR (first graph) and EOS/USD (second graph) below:
Support Areas
EOS/EUR
Reversal Areas
EOS/USD
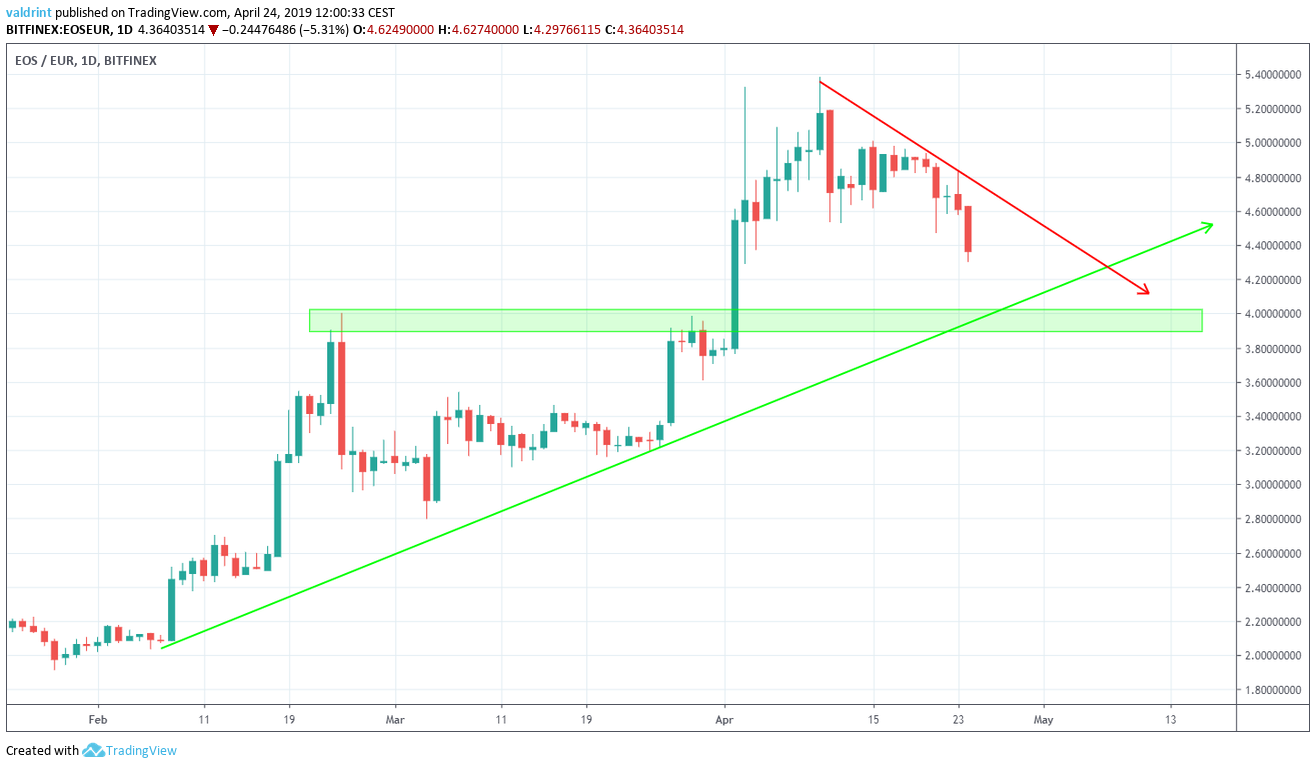
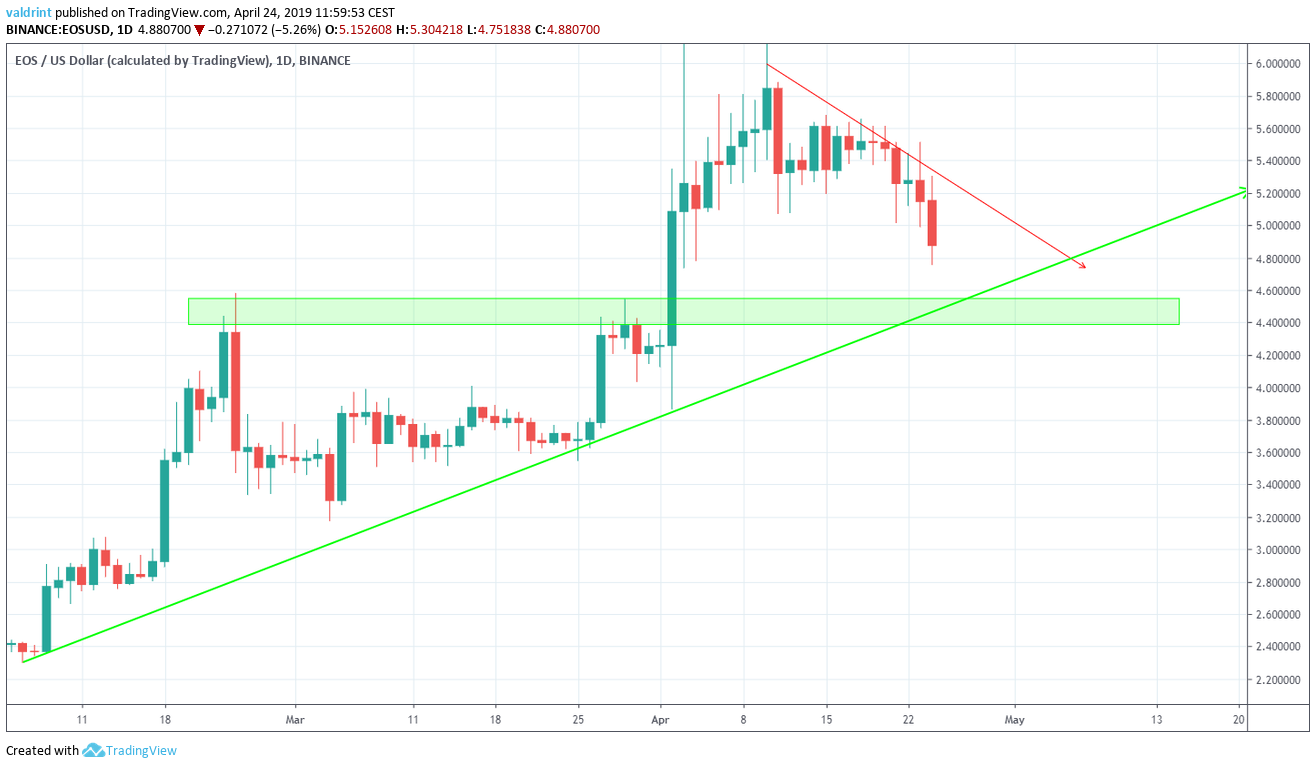
The closest support area is found near $4.50 and €4.0. It coincides with the ascending support line. We believe the price will reach this area.

Summary of Analysis

Based on our analysis, it is likely that the price of EOS will begin to decrease towards the ascending support line. Lows around $4.50 and €4.0 appear likely. Do you think the price of EOS will continue to decrease? Let us know your thoughts in the comments below! For 2019 and 2020 price predictions, click on the green button below:

2019/2020 EOS/USD PREDICTIONS

Disclaimer: This article is not trading advice and should not be construed as such. Always consult a trained financial professional before investing in cryptocurrencies, as the market is particularly volatile.
Top crypto platforms in the US | April 2024
Coinbase Coinbase Explore →
AlgosOne AlgosOne Explore →
Chain GPT Chain GPT Explore →
iTrustCapital iTrustCapital Explore →

Trusted

Disclaimer

In line with the Trust Project guidelines, this price analysis article is for informational purposes only and should not be considered financial or investment advice. BeInCrypto is committed to accurate, unbiased reporting, but market conditions are subject to change without notice. Always conduct your own research and consult with a professional before making any financial decisions. Please note that our Terms and ConditionsPrivacy Policy, and Disclaimers have been updated.

Valdrin-Tahiri.jpg
Valdrin Tahiri
Valdrin discovered cryptocurrencies while he was getting his MSc in Financial Markets from the Barcelona School of Economics. Shortly after graduating, he began writing for several different cryptocurrency related websites as a freelancer before eventually taking on the role of BeInCrypto's Senior Analyst. (I do not have a discord and will not contact you first there. Beware of scammers)
READ FULL BIO
Sponsored
Sponsored