
On Apr 3, 2019, the price of EOS reached a high of $6.09. After a gradual decrease, a slightly higher high was reached on Apr 11.
The price has steadily fallen from the $6 level. Lows near $5 have been reached. At the time of writing, prices were trading around $5.40.
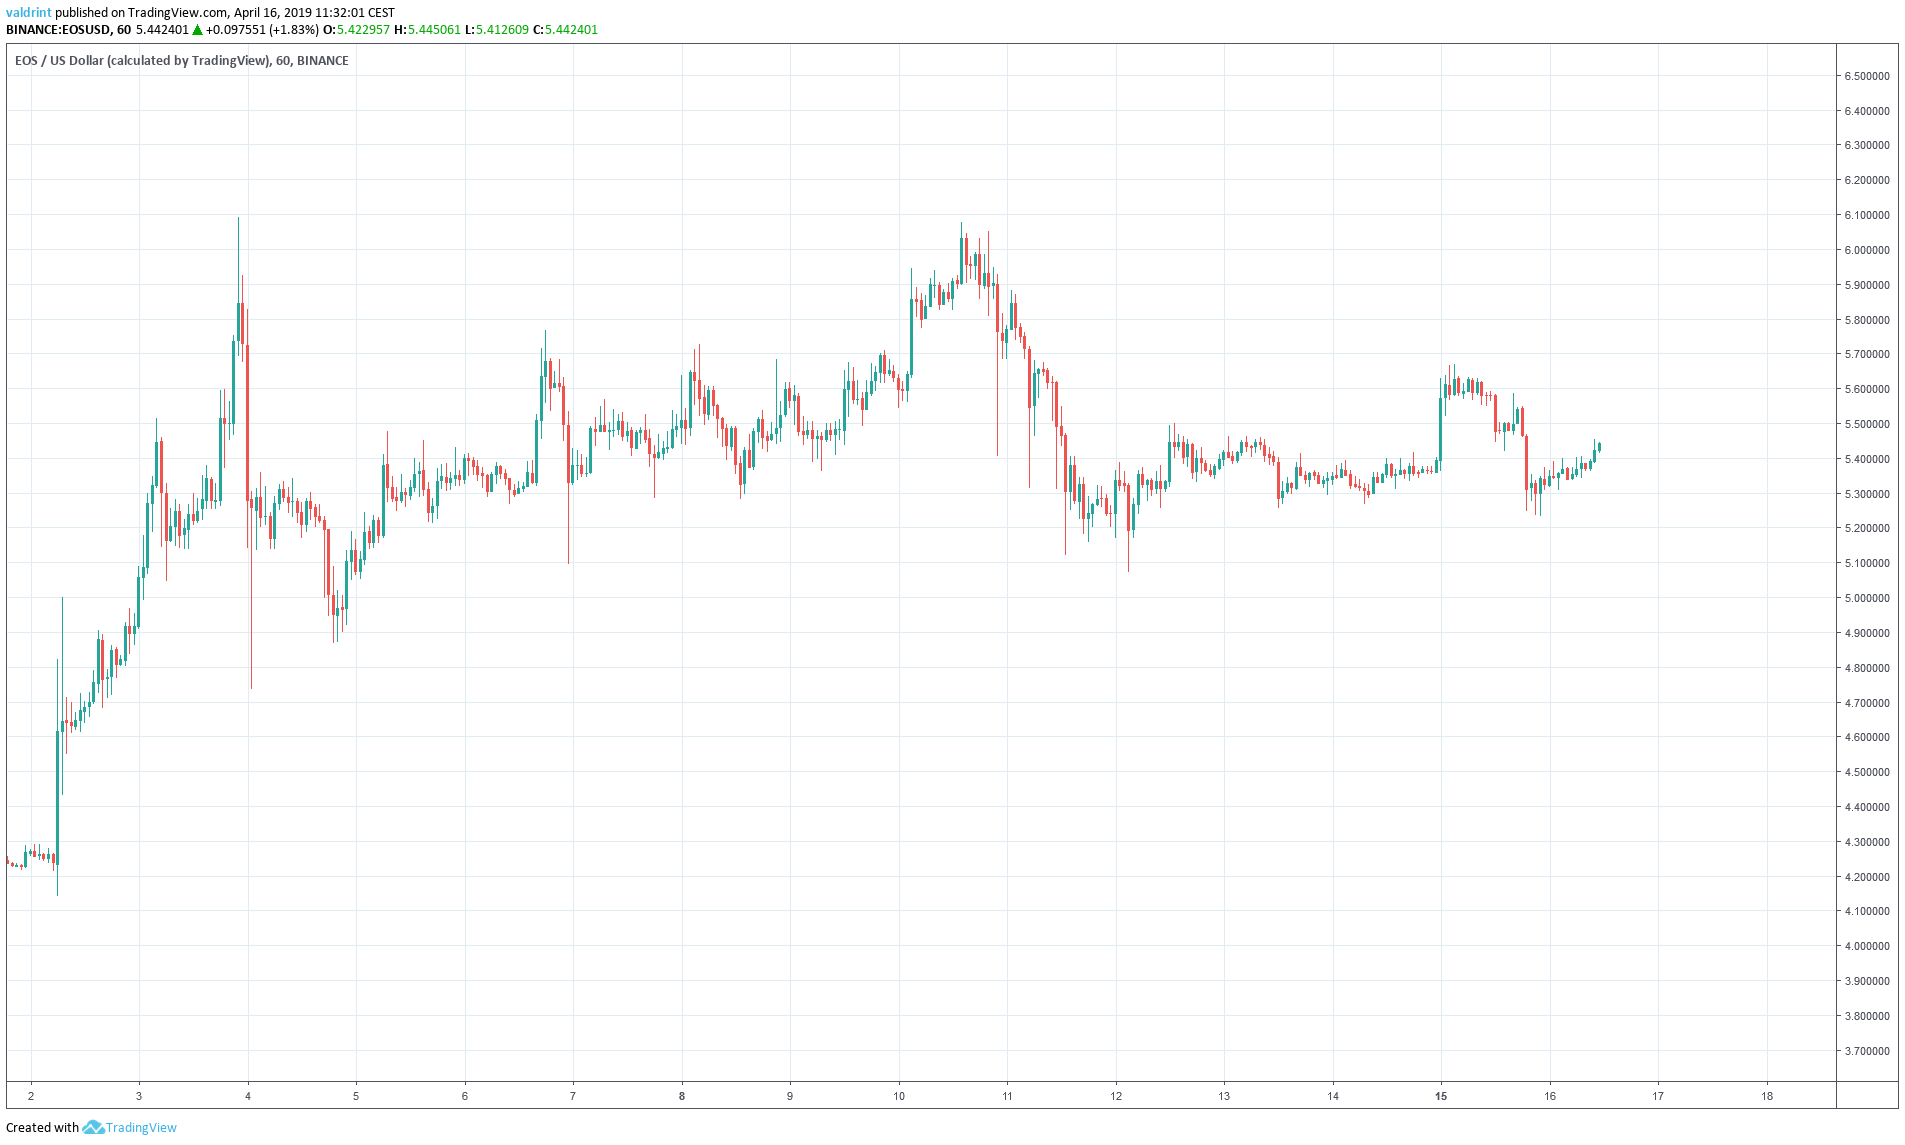
Will EOS rise back up to $6 or fall back down to $5?
Let’s find out:
EOS (EOS): Trends And Highlights For April 16, 2019
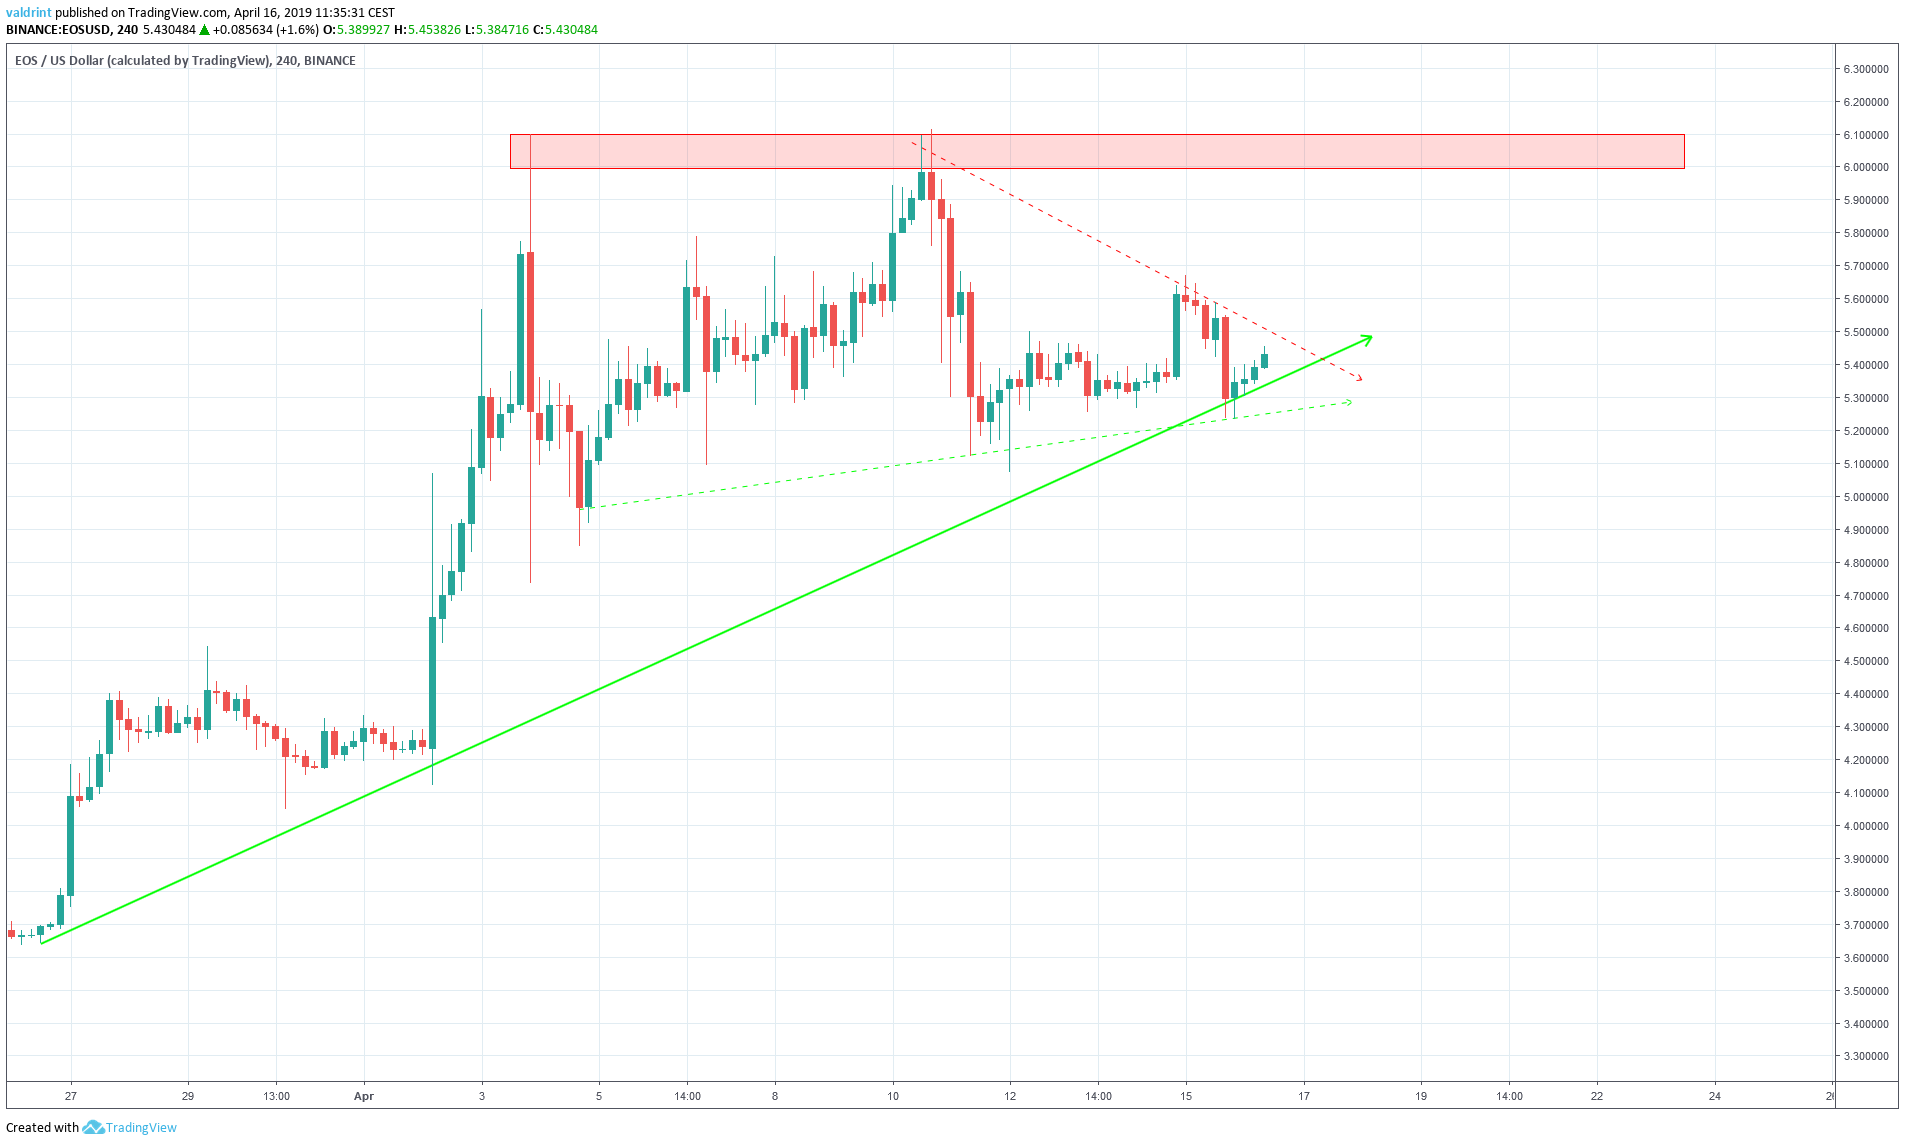
- EOS/USD reached a high of $6.11 on Apr 10.
- It appears to be trading inside a symmetrical triangle.
- EOS is following a long term support line.
- Bullish divergence is developing in the RSI.
- There is resistance near $6.
Tracing the Current Trading Pattern
On Apr 4, the price made a low of 4.84. Since then, it has been increasing, creating several higher lows.
Tracing these lows gives us an ascending support line:
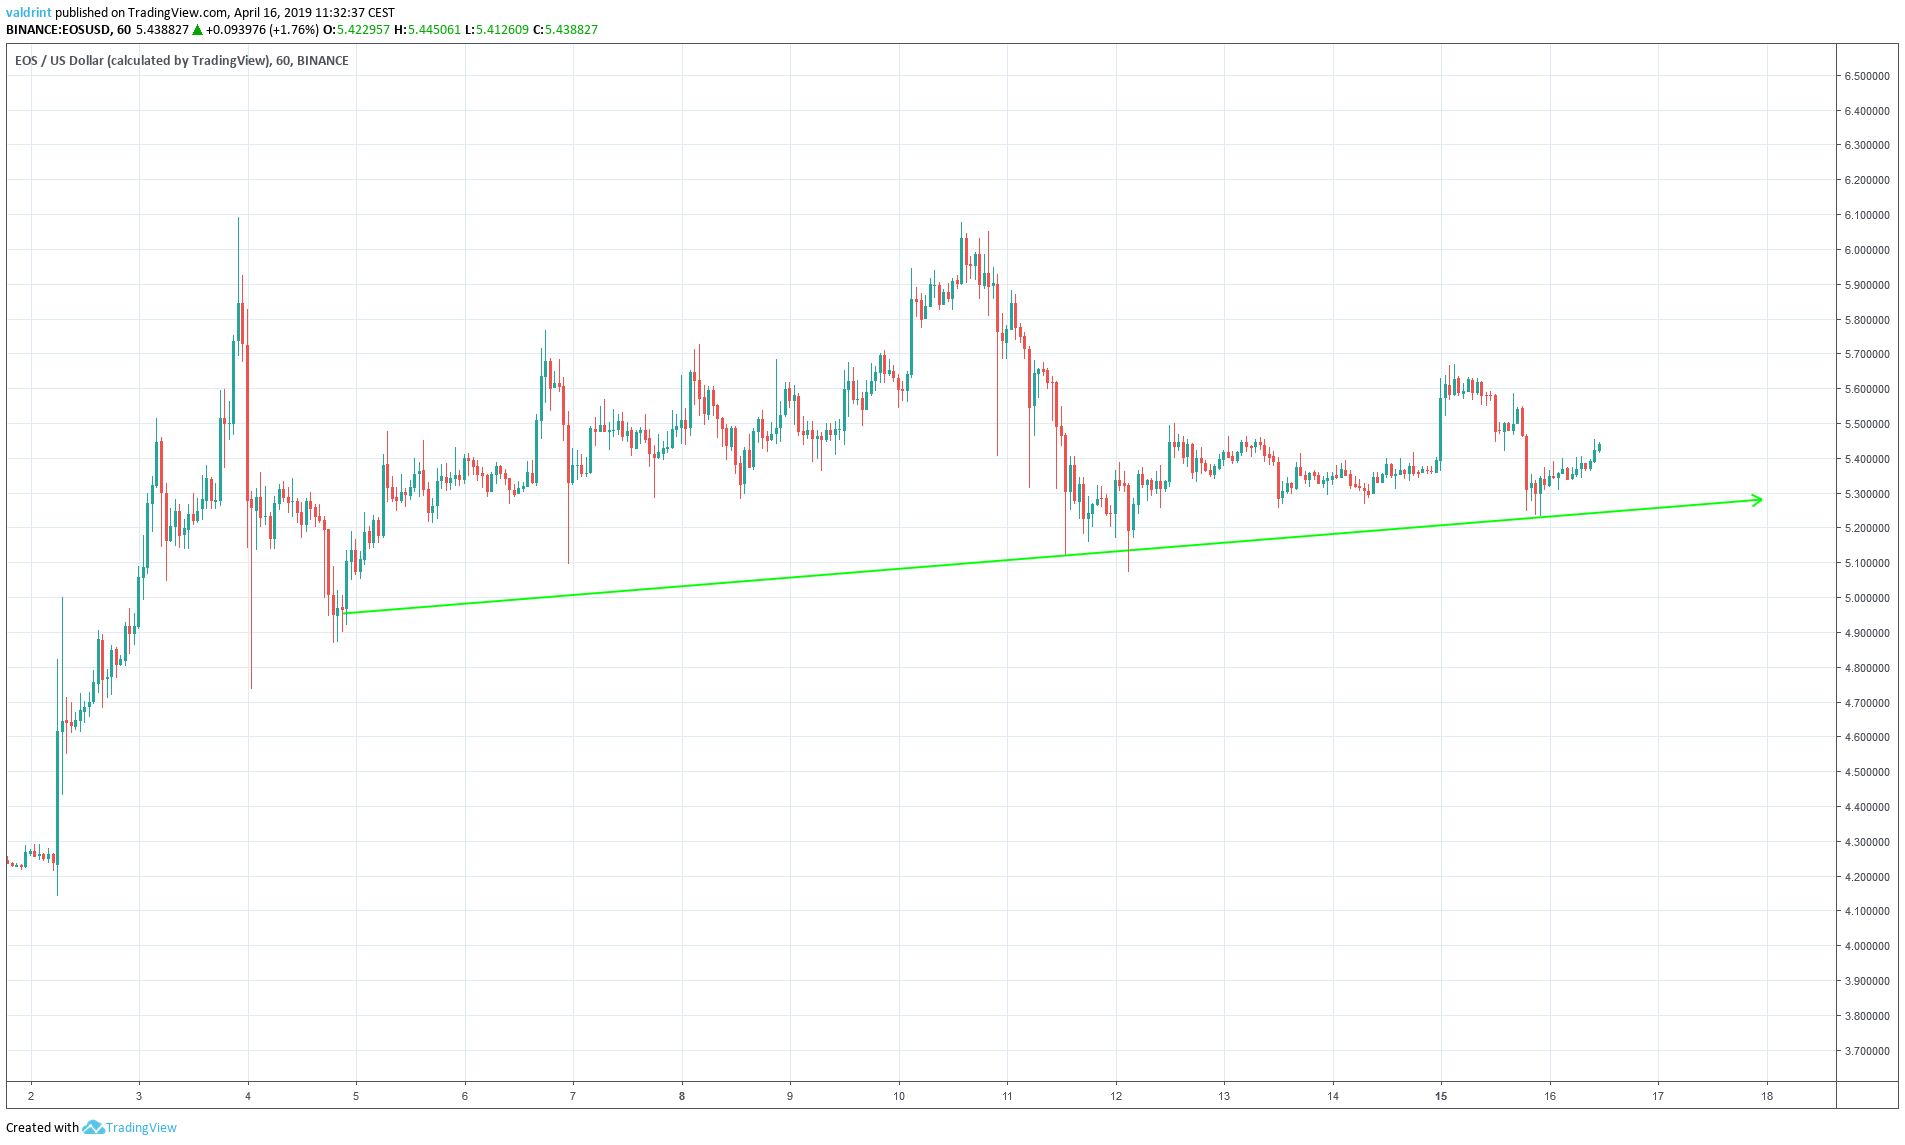
On Apr 10, the price reached a high of $6.11. Several market cycles have been completed and the price has made several lower highs.
Tracing these highs gives us a descending resistance line. However, the line has only been touched twice, therefore it is possible that the price follows a slightly different line.
The resistance and support lines combine to create a symmetrical triangle:
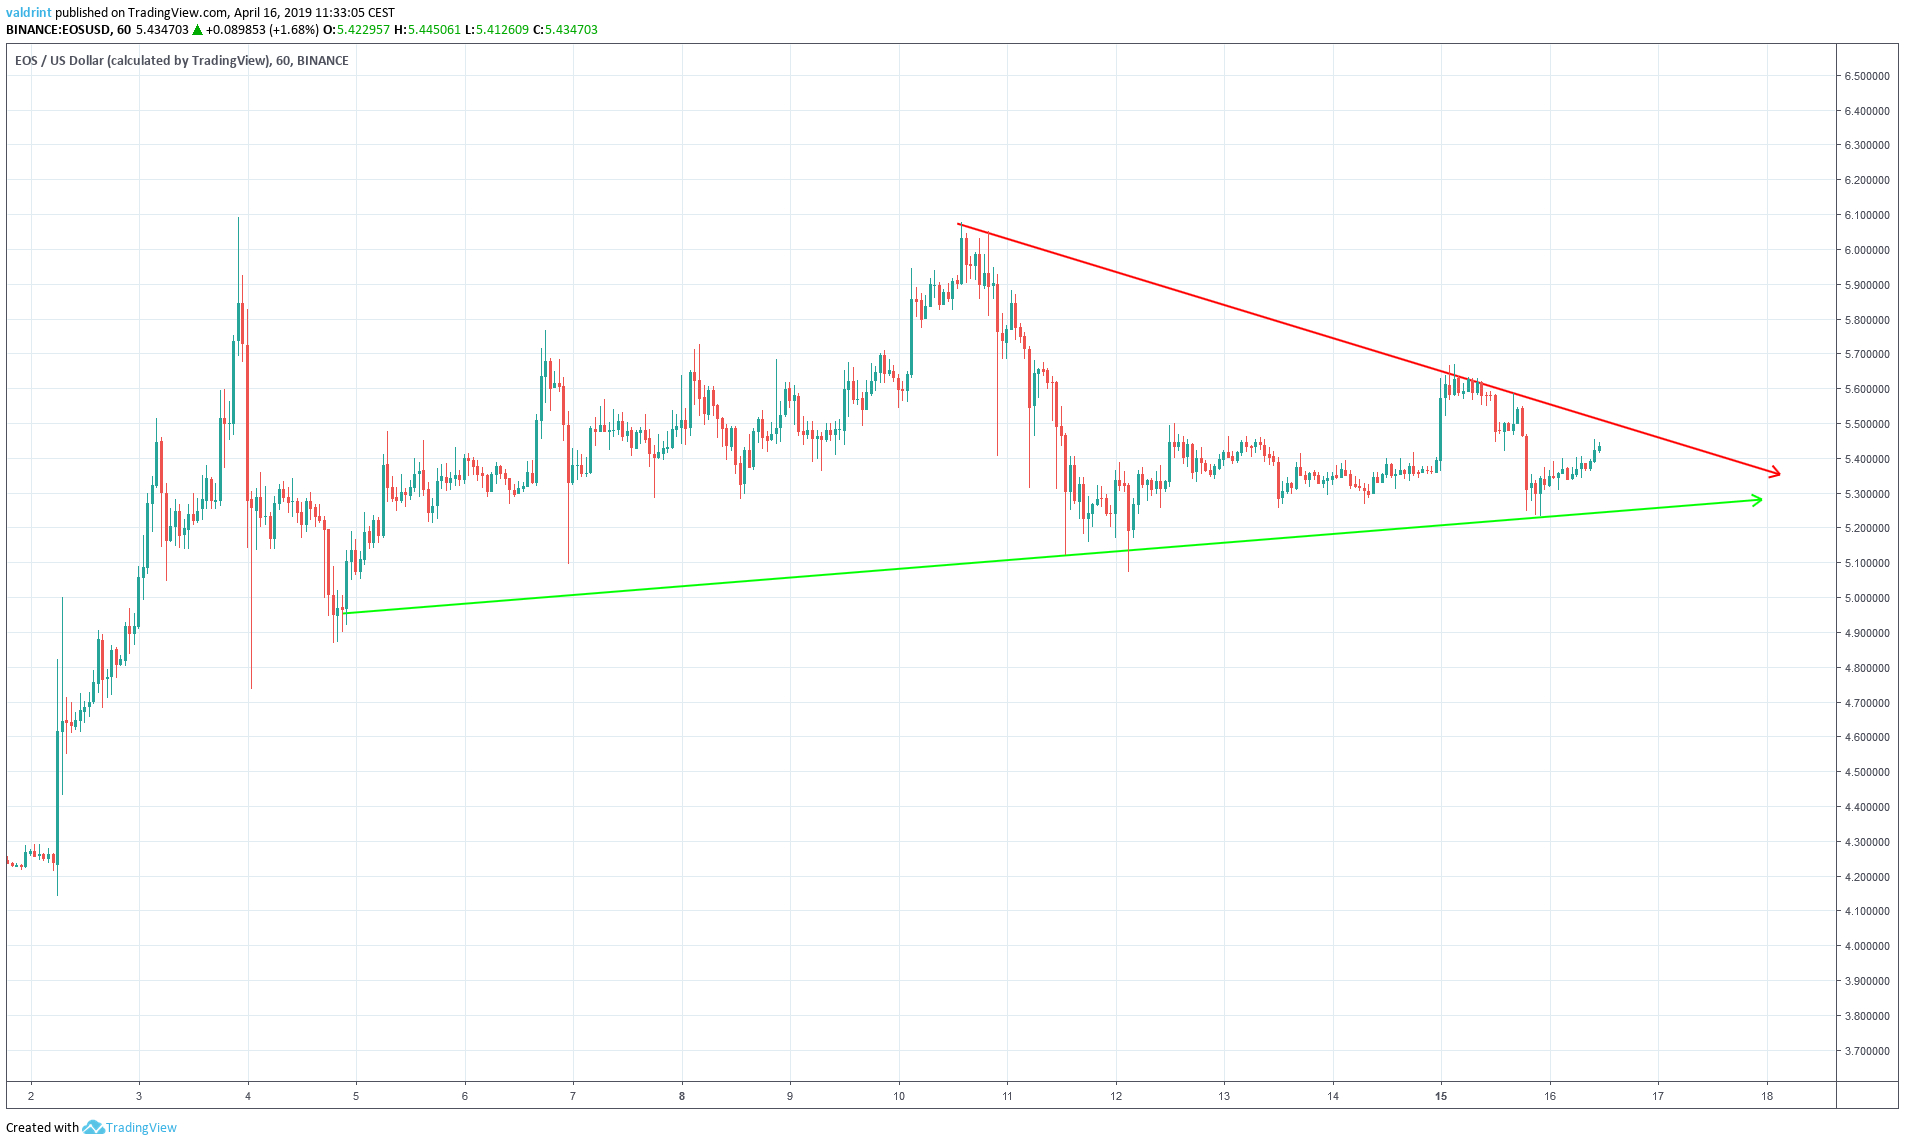
It is likely that the price will keep trading inside the confines of this triangle until a decisive move occurs.
In order to figure out the direction of the move, we need to look at a longer time-frame and incorporate technical indicators.
Technical Indicators
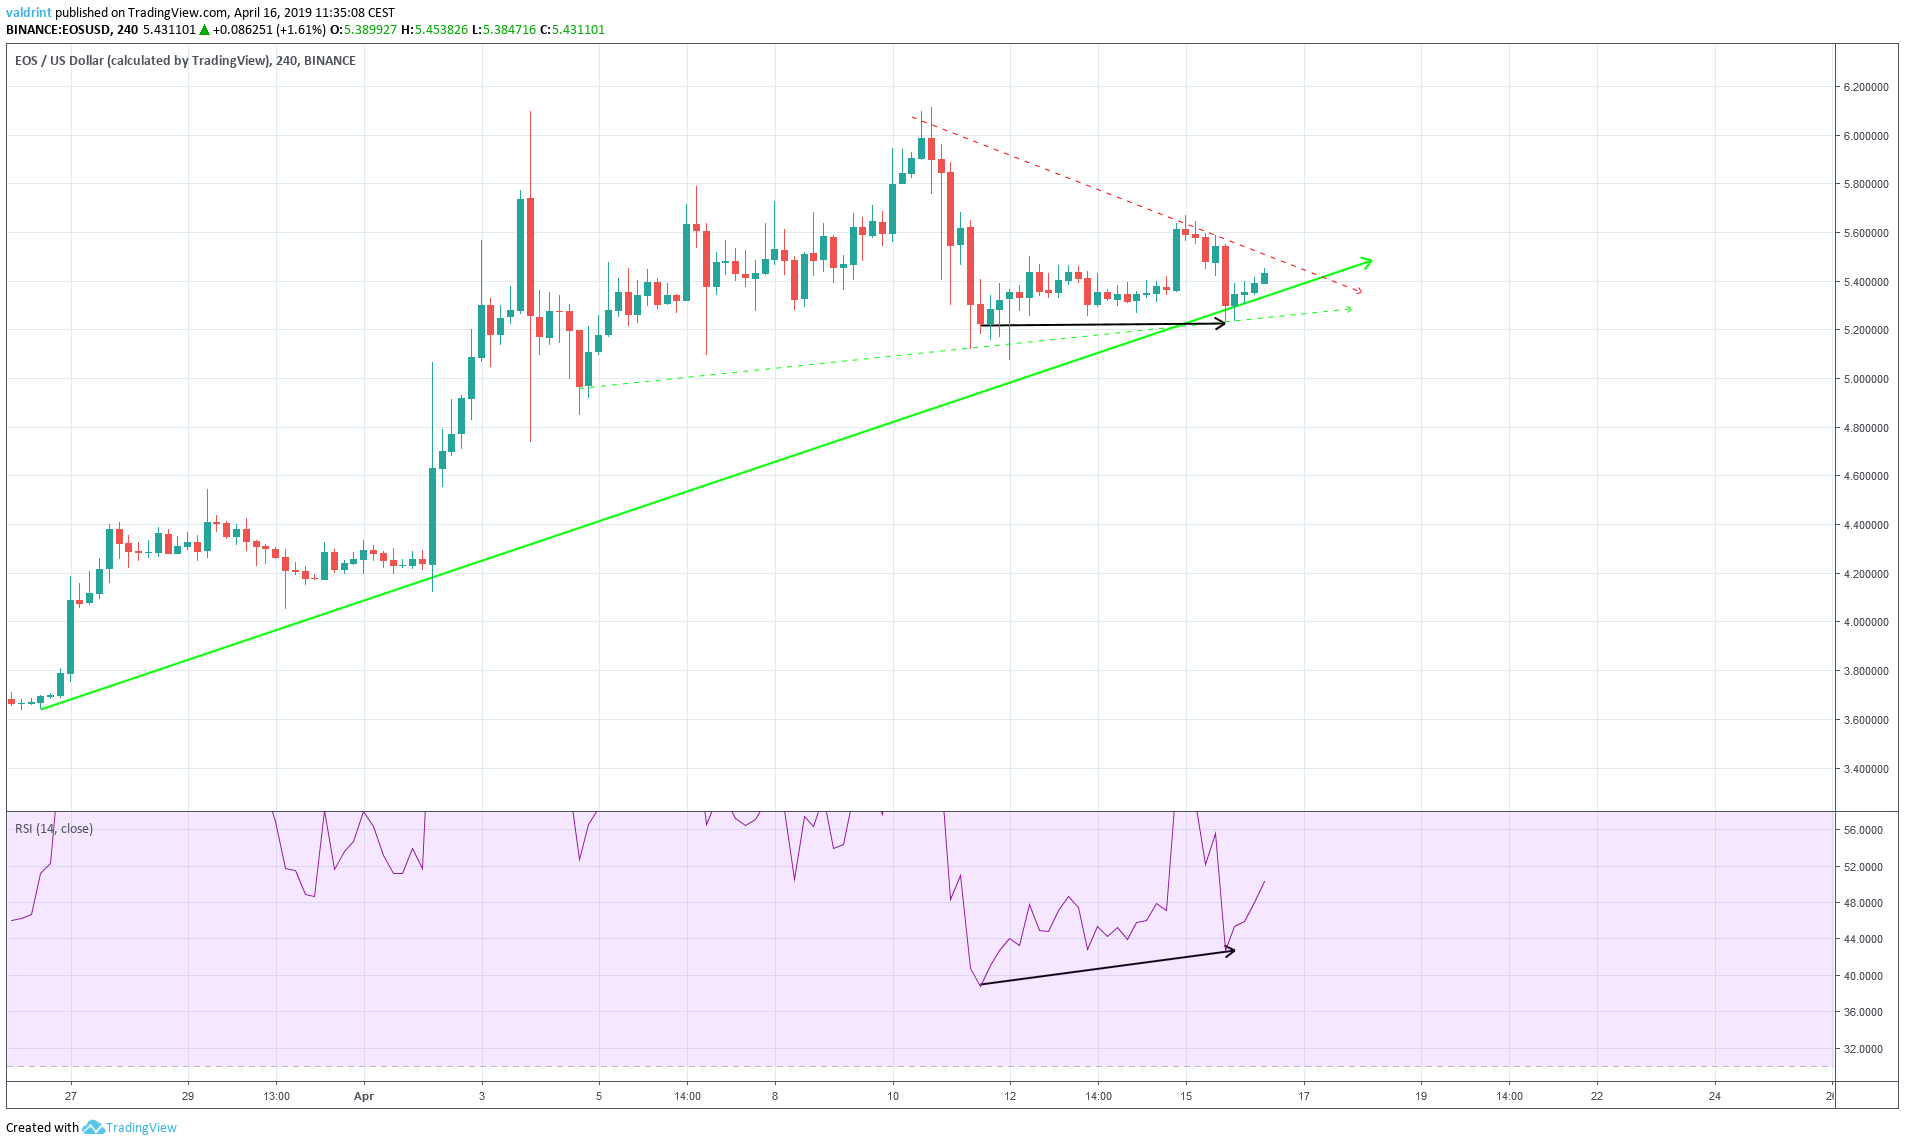
We can see that the price has been following an ascending support line since Mar 27, which coincides with the support line of the symmetrical triangle we have outlined above.
On Apr 11, the price reached a low of $5.11. It reached a similar low on Apr 15.
Similarly, the RSI made the first low on Apr 11. However, it has continued to generate higher values since.
This is known as bullish divergence and often precedes price increases.
The divergence is not very significant in value. However, it is occurring at two support lines, both short and long-term.
Therefore, we believe that the price will not break down from the current trading pattern. On the contrary, it appears more likely that EOS/USD will increase at the rate predicted by the line and breakout by the point of convergence between resistance and support.
Future Movement
In this section, we incorporate resistance areas into the analysis to determine possible future price levels.
The closest resistance area is found near $6. If the price does not break down from the support line, it may eventually reach this area.
Summary of Analysis
Based on our analysis, it is likely that the price of EOS will increase at the rate predicted by the support line we have outlined above. We cannot confidently predict whether it will have enough strength to reach the resistance area.
How high will the price of EOS go? Let us know your thoughts in the comments below!
For 2019 and 2020 EOS price predictions, click on the green button below:
Disclaimer: This article is not trading advice and should not be construed as such. Always consult a trained financial professional before investing in cryptocurrencies, as the market is particularly volatile.
