
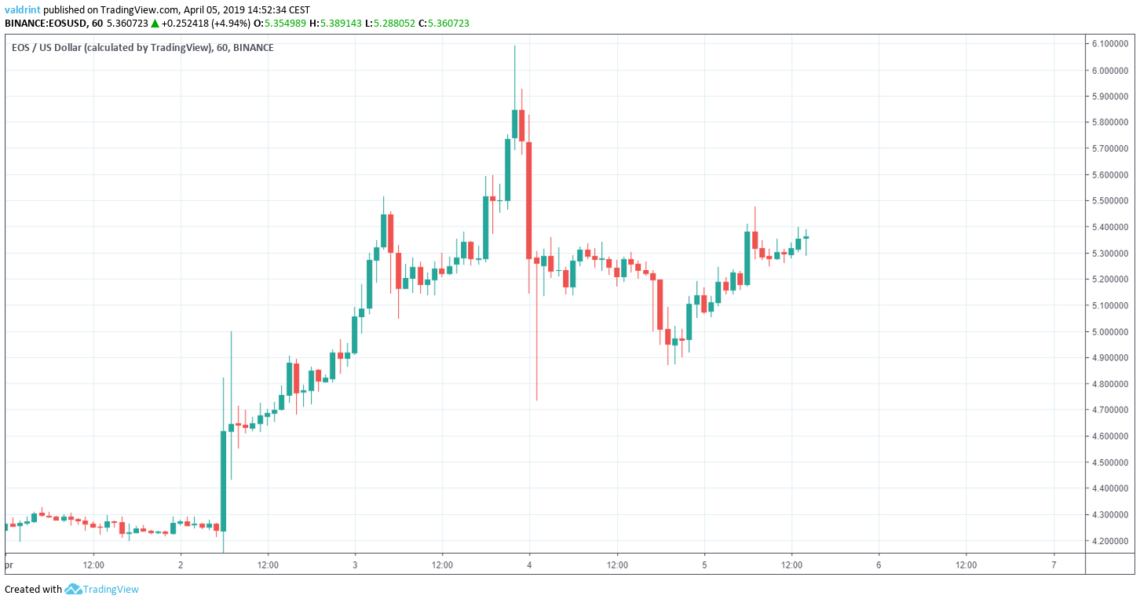
On Apr 2, the price of EOS initiated a rapid upward movement. A high of $6 was reached on Apr 3.
After the high, prices began to gradually decrease. that brought prices below $5.
Prices subsequently rose to nearly $5.50 the following day when a reversal ensued. They have since stabalized between $5.30 and $5.40 at the time of writing.
Will the current reversal lead to a new uptrend? Will EOS reach $6 again?
Let’s find out.
EOS (EOS): Trends And Highlights For April 5, 2019
- The price of EOS reached a high of $6.09 on Apr 3.
- EOS is trading inside an ascending triangle.
- The SMAs have made a bullish cross.
- There is resistance near $6 and support near $4.7.
Tracing the Current Trading Pattern
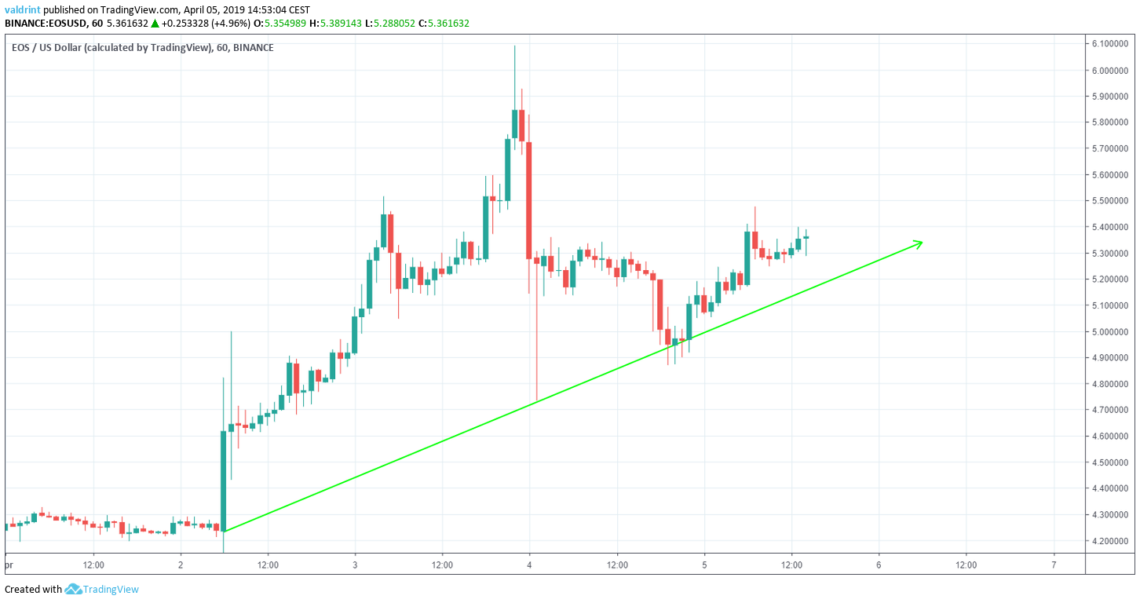
On Apr 2, the price made an hourly low of $4.14. A sharp upward move was followed by a gradual decrease. The price has made several higher lows.
Tracing these lows gives us an ascending support line:
On Apr 4, the price reached an hourly high of $5.35. A gradual drop ensued followed by an increase. The price reached the same level three times.
Tracing these highs gives us a horizontal resistance line.
The resistance and support lines combine to create an ascending triangle:
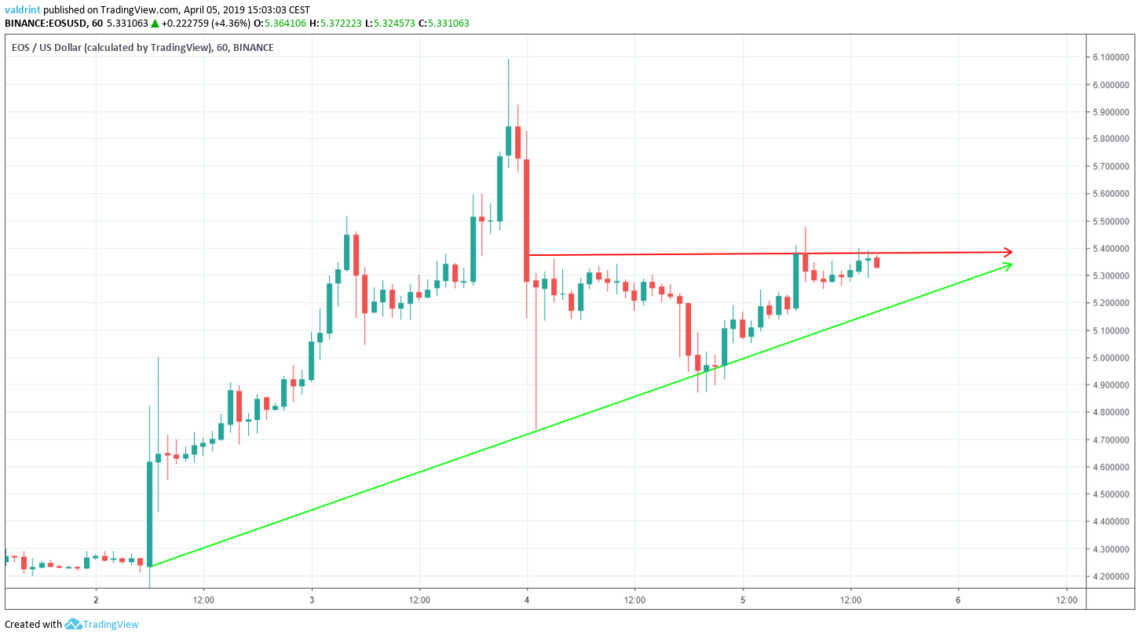
This is a bullish pattern. It suggests forthcoming price increases.
To determine whether price increases are likely, however, requires us to incorporate technical indicators into the analysis.
Moving Averages

On Apr 4, the 21-period MA crossed below the 50-period MA. This is known as a bearish cross. At the time, it indicated that the current trend may be over and a new downtrend may begin.
However, the price immediately rebounded as did the moving averages.
The 21-period MA crossed above the 50-period MA on Apr 5. This invalidated the previous signal and indicates that a new uptrend may begin soon as suggested by the ascending triangle.
Future Movement
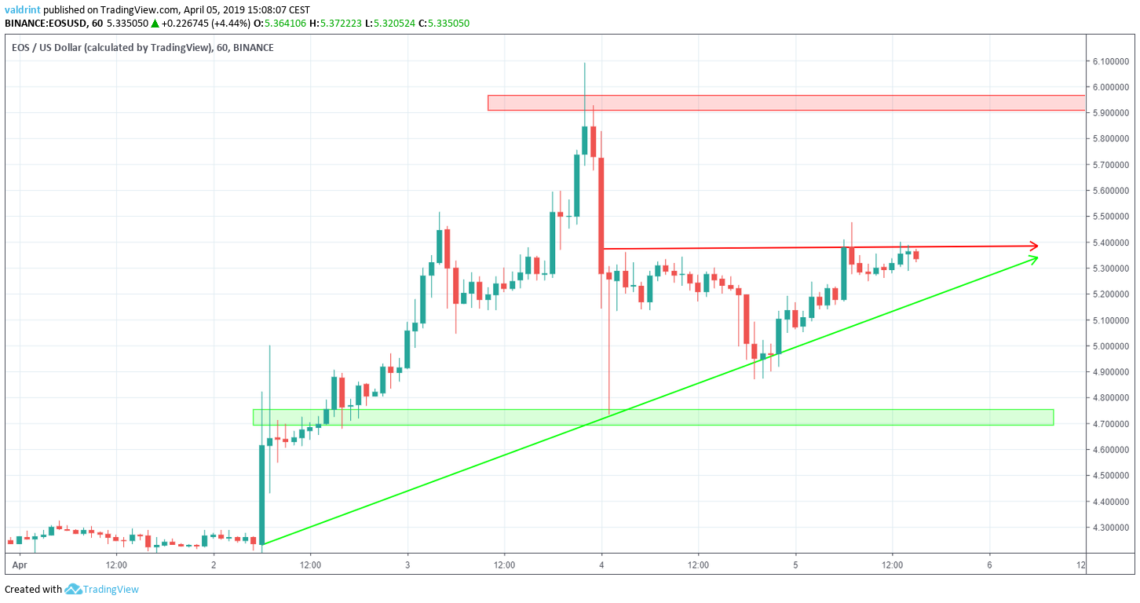
The closest support area is found near $4.7. We believe it is unlikely that the price will reach this area.
Summary of Analysis
Based on our analysis, it is likely that the price of EOS breaks will keep trading inside the ascending triangle until it eventually breaks out.
Do you think the price of EOS will break out of the ascending triangle? Let us know your thoughts in the comments below!
Disclaimer: This article is not trading advice and should not be construed as such. Always consult a trained financial professional before investing in cryptocurrencies, as the market is particularly volatile.
