


EOS (EOS) has returned to the support area of a horizontal range. There are no definite bullish reversal signs in place.
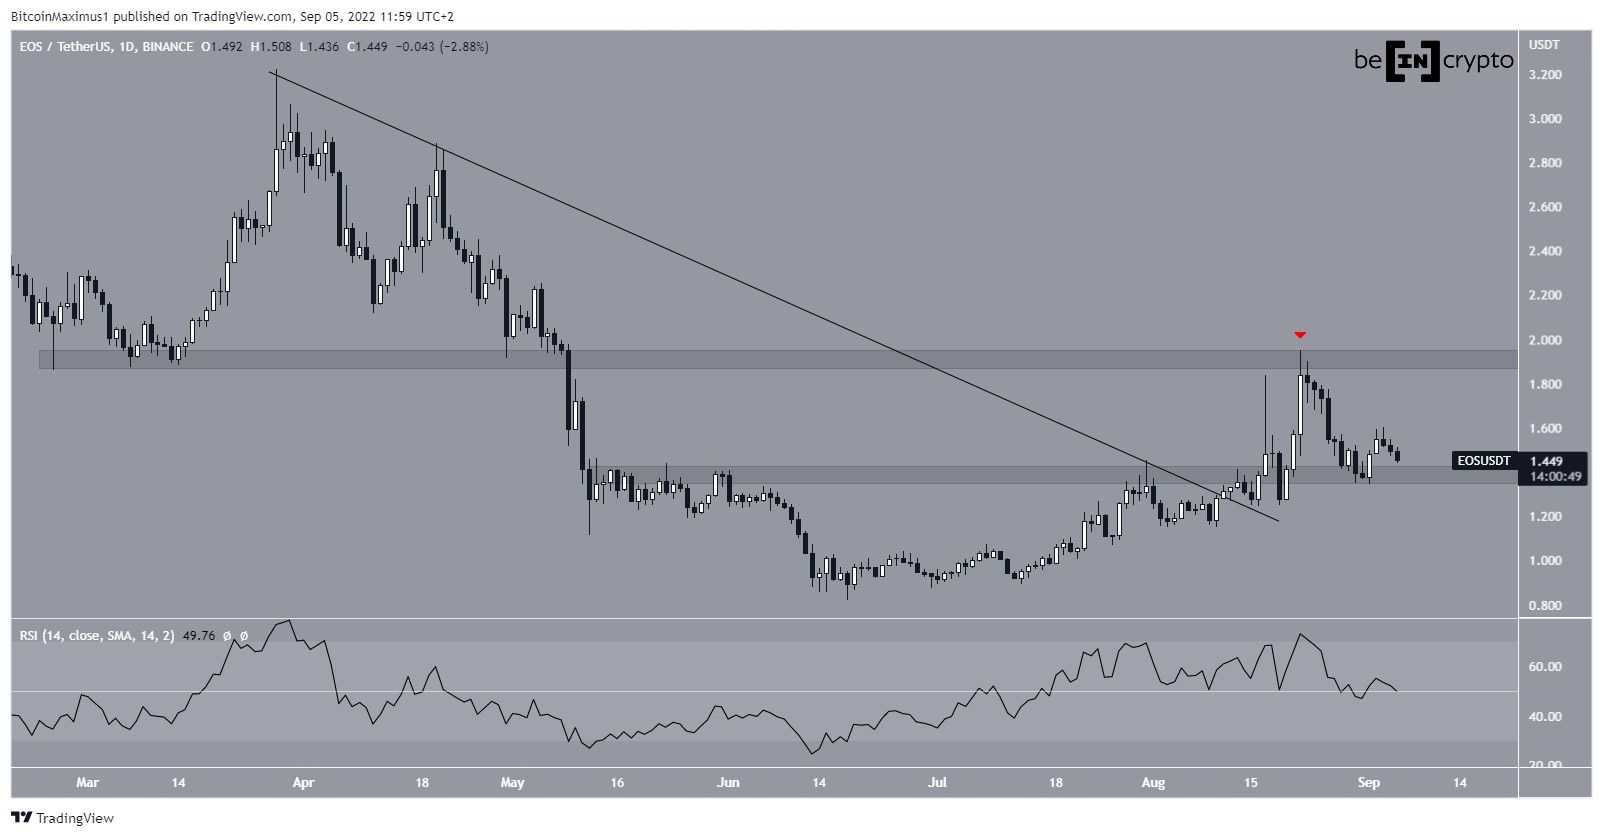
EOS has been moving upwards since June 18. After initially being rejected by a descending resistance line and the $1.40 horizontal resistance area, the price managed to break out on Aug 11. It proceeded to reach a high of $1.95 on Aug 22.
However, the price was rejected afterward, validating the $1.95 horizontal area as resistance. The price then decreased to the $1.40 horizontal support area. So, EOS is currently trading in a horizontal range between $1.40 and $1.95, respectively.
The daily RSI is neutral, since it is trading right at the 50 line. This is in alignment with the fact that the price is trading inside a horizontal range.
So, the daily time frame provides a fairly neutral outlook.
Current movement
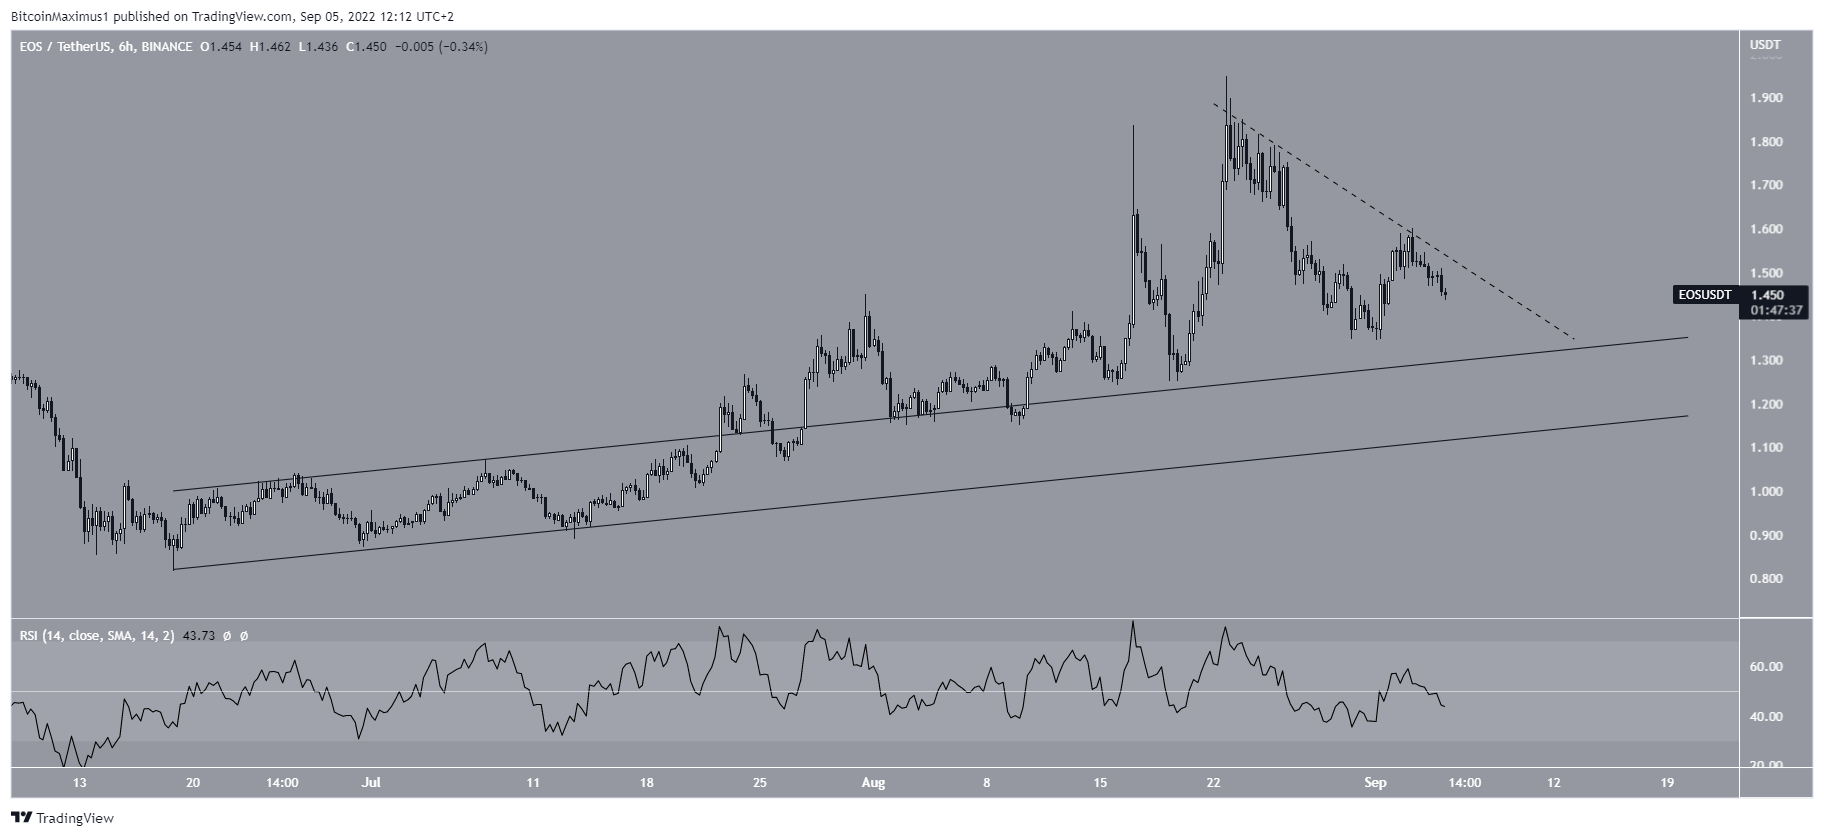
The six-hour chart does not provide a clear indication of where the price is going. On the bearish side, EOS has been following a shorter-term descending resistance line (dashed) since Aug 22.
The line most recently caused a rejection on Sept 3. Additionally, the RSI seems to have decreased below 50. So, the trend cannot be considered bullish until the price breaks out from the line and the RSI moves above 50.
On the bullish side, there is ample support at $1.30, created by the previous resistance line of an ascending parallel channel. This also coincides with the previously outlined horizontal support area.
So, it is possible that the price will bounce at this level and then break out. Failure to do so would confirm that the trend is bearish.
EOS/BTC
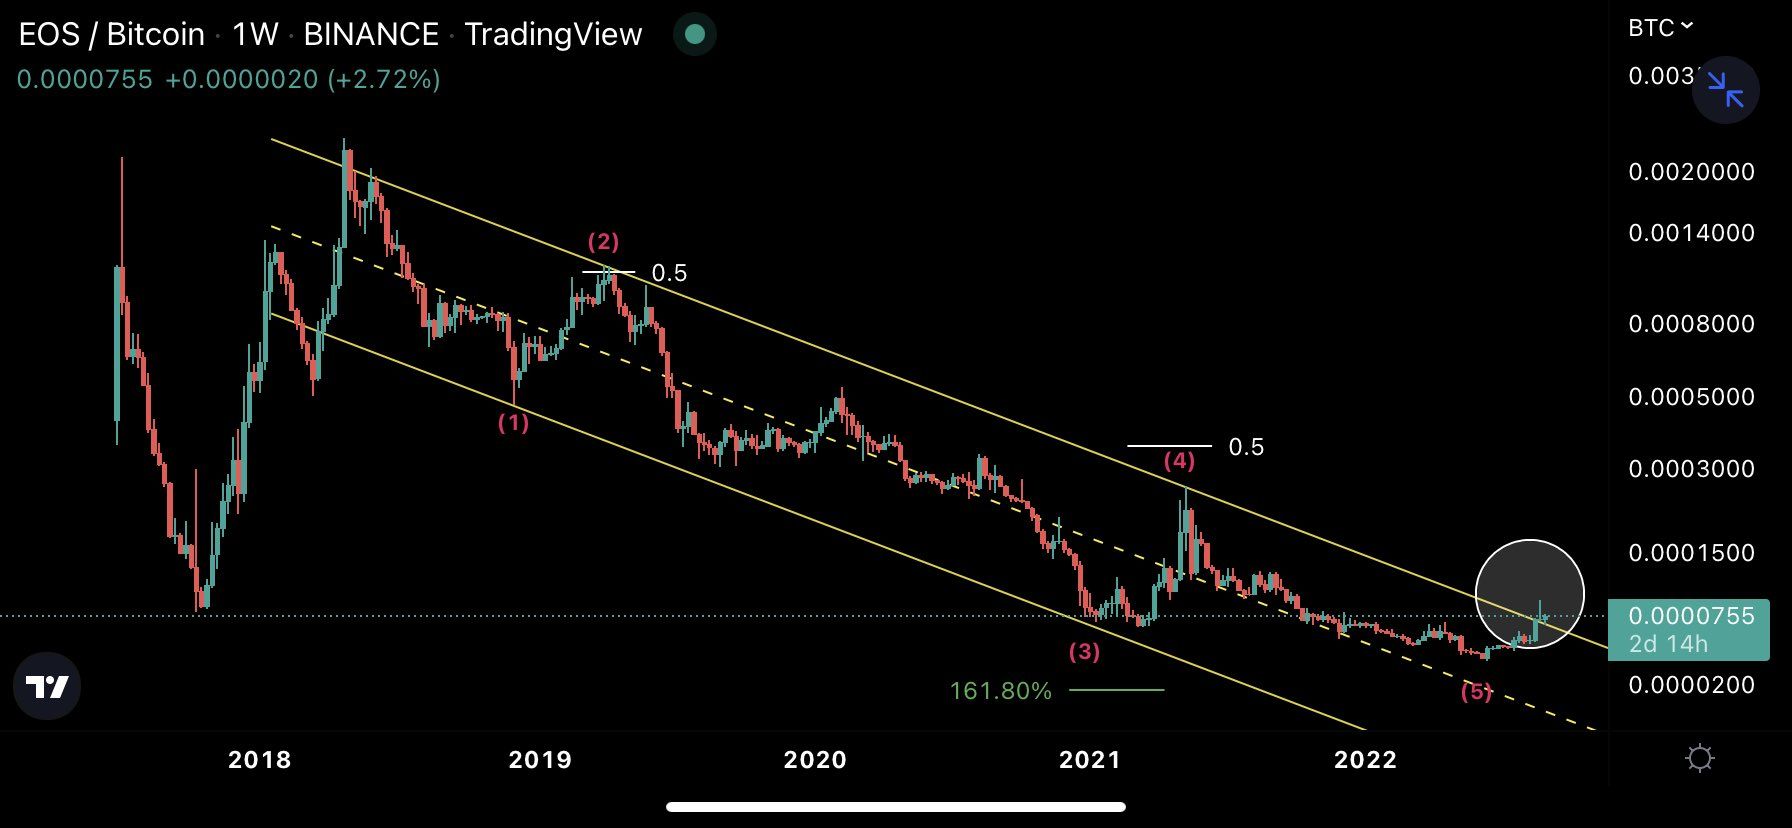
Cryptocurrency trader @MesaWine1 tweeted a chart of EOS/BTC, stating that the price has completed a five-wave downward movement. If so, a new bullish trend has likely begun.
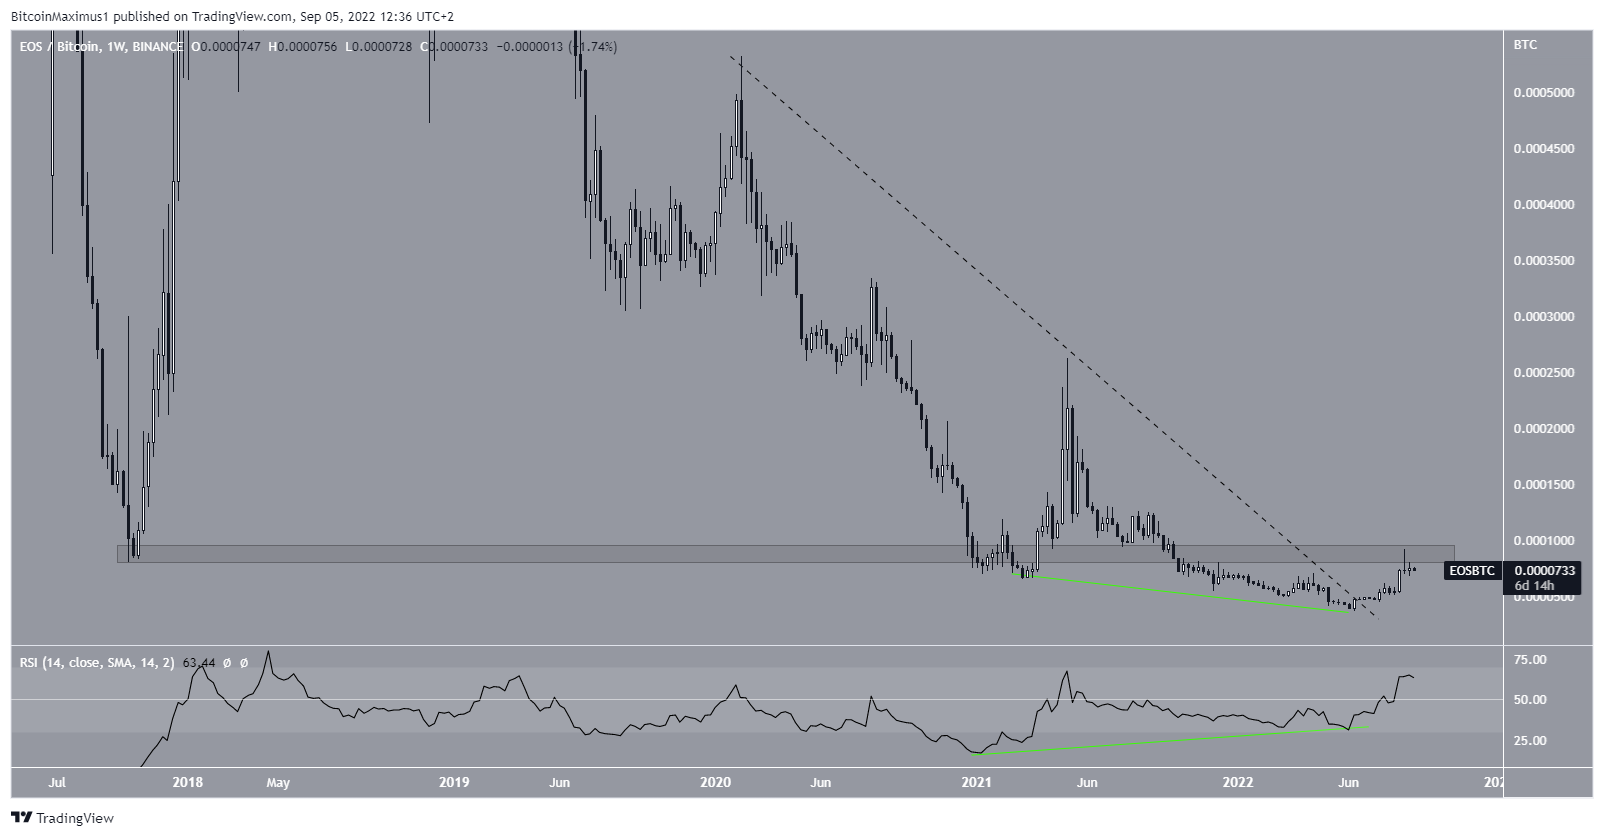
The EOS/BTC chart is more bullish than its USD counterpart. The main reason for this is the bullish divergence in the weekly RSI (green line) and the breakout from a long-term descending resistance line (dashed).
However, the price is still facing strong resistance from the previous all-time low level at 900 satoshis. If it manages to reclaim the 900 satoshi resistance area, it would confirm that a bullish reversal has begun and greatly accelerate the rate of increase.
For Be[in]Crypto’s latest Bitcoin (BTC) analysis, click here


