
On January 14, the EOS price broke out from the bullish pattern it had been trading in since September 5, 2019. The breakout transpired with very significant volume and the price has yet to begin a retracement.
Cryptocurrency trader @imBagsy outlined the EOS price chart and stated that he will close the majority of his position if the price reaches the 4700 satoshi price level. Conversely, he would do the same if the price decreased below 4000 satoshis.
Will the EOS price continue to increase or is there a reversal in store? Let’s take a closer look at the price movement.$EOS Daily:
— Bagsy (@imBagsy) January 14, 2020
Going to keep this simple. I'm buying pullbacks and aiming to close a significant portion at the 4.7K level if we get it.
If we begin closing back within the range (below orange), I'll cut. pic.twitter.com/YVqtJYX4oS
Current EOS Breakout
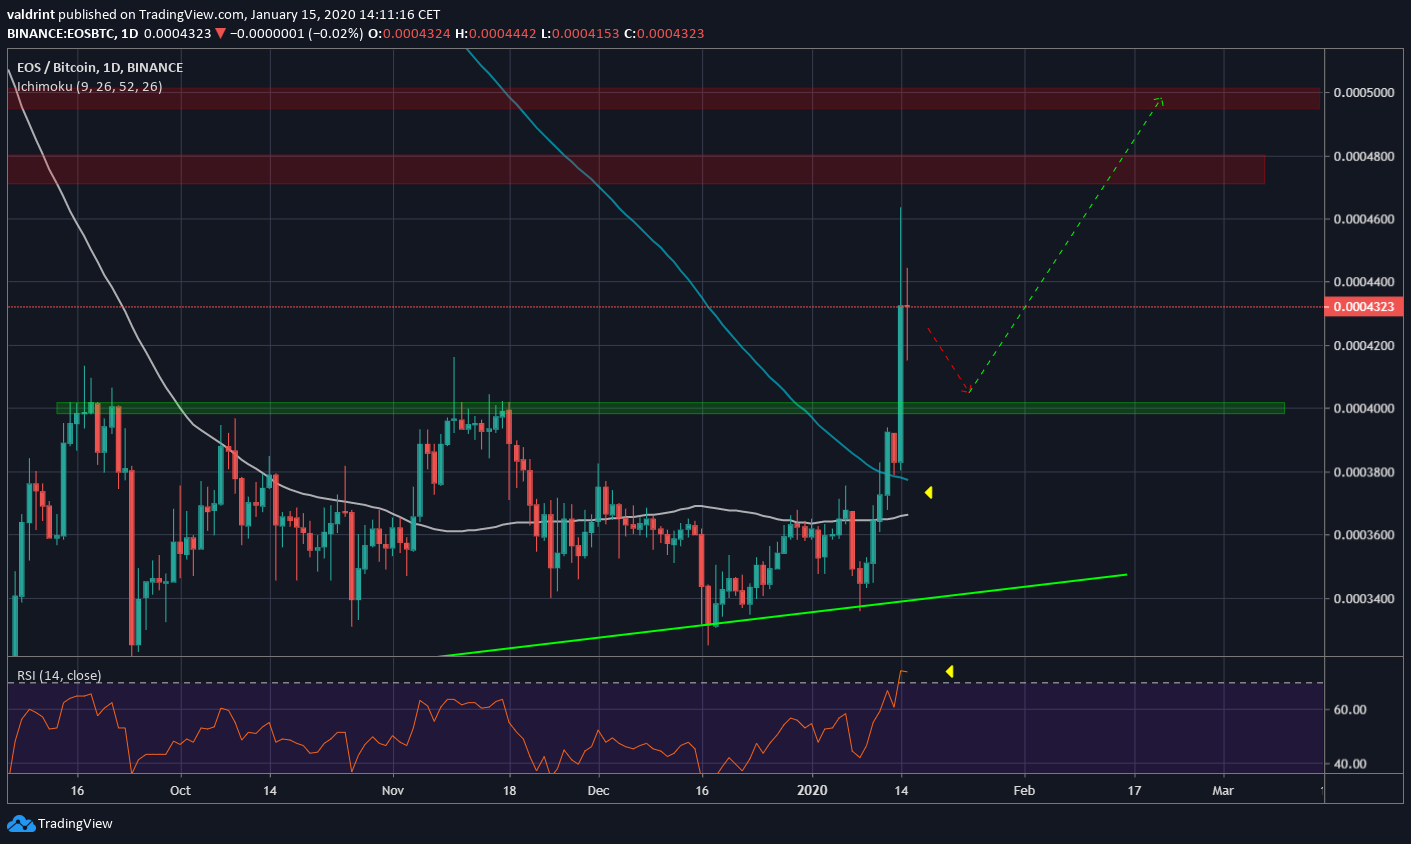
Beginning with the low of 3040 satoshis reached on September 5, 2019, the EOS price created a massive ascending triangle with resistance at 4000 satoshis. On January 14, the price broke out with very significant volume and reached a high of 4605 satoshis. If the price travels the entire height of the pattern, it will reach the resistance area of 5000 satoshis — which is only slightly higher than the 4700 satoshi resistance area that is mentioned in the tweet.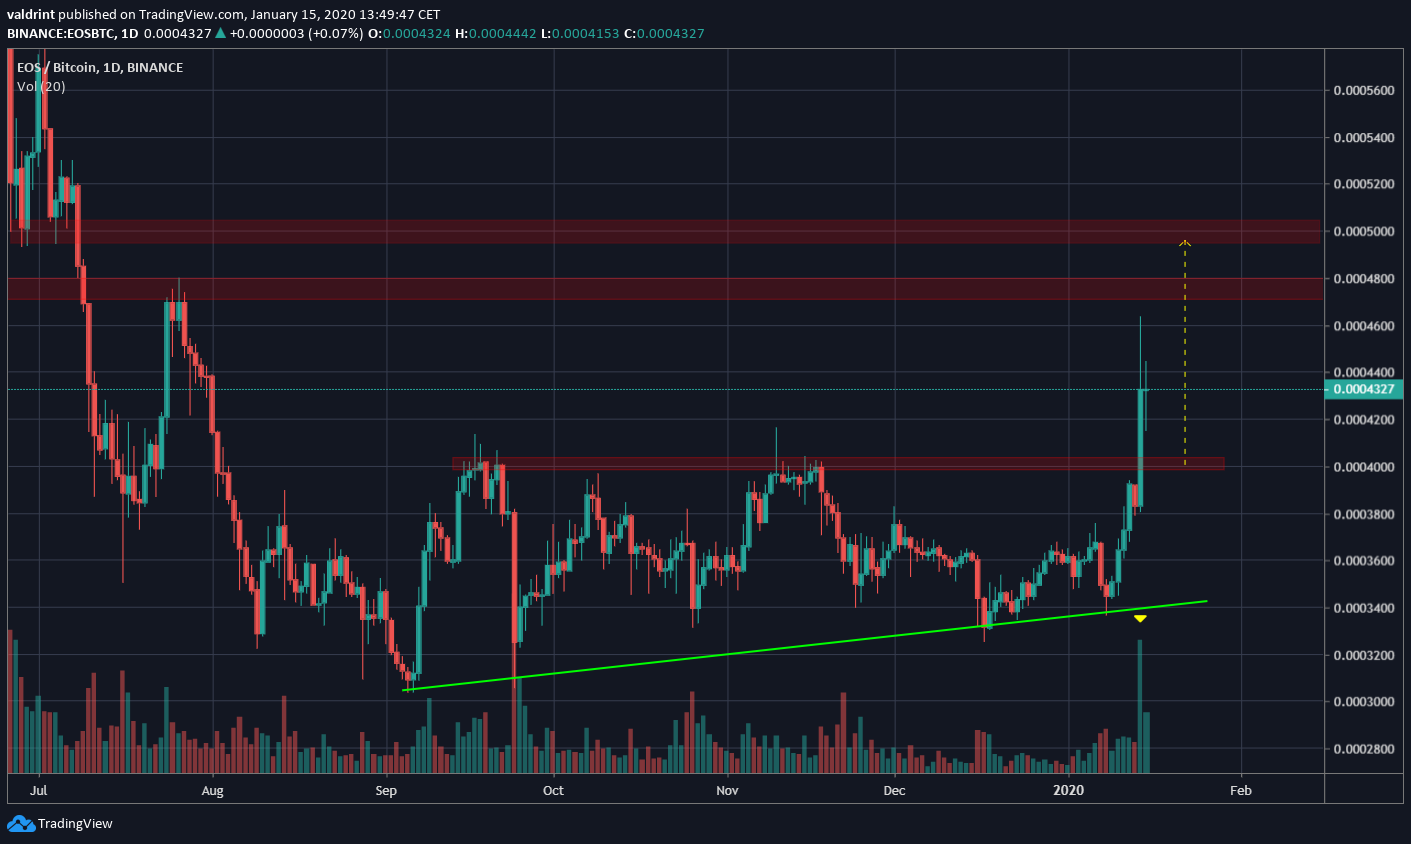 The continuation of this upward movement is supported by technical indicators. The 100- and 200-day moving averages (MAs) are very close to making a bullish cross. Combined with the strong breakout, this would confirm the validity of the upward trend.
In addition, while the RSI has just reached overbought territory, there is no bearish divergence yet. Thus, in the most bearish scenario, we think the EOS price will retest the 4000 satoshi support area and then increase towards at least one of the resistance areas outlined above.
A retest of the 4000 satoshi area would present an ample opportunity to re-enter the trade in anticipation of the next upward move.
The continuation of this upward movement is supported by technical indicators. The 100- and 200-day moving averages (MAs) are very close to making a bullish cross. Combined with the strong breakout, this would confirm the validity of the upward trend.
In addition, while the RSI has just reached overbought territory, there is no bearish divergence yet. Thus, in the most bearish scenario, we think the EOS price will retest the 4000 satoshi support area and then increase towards at least one of the resistance areas outlined above.
A retest of the 4000 satoshi area would present an ample opportunity to re-enter the trade in anticipation of the next upward move.
Long-Term Movement
When looking at the weekly chart, the most important resistance area is revealed to be at 5500 satoshis. This area acted as support for the entirety of 2018 and the first half of 2019, before the price broke down in July 2019. Afterward, the rate of decrease greatly accelerated. The resistance of this area is strengthened by the 50-week moving average (MA). On a more bullish note, the 10- and 20-week MAs have made a bullish cross. This has not occurred since February 2019, preceding the final upward move until the current one. A breakout above the 5500 satoshi resistance area would likely cause the rate of increase to greatly accelerate and begin a new bullish market cycle. However, as long as the EOS price is trading below this area, the current upward move could be a retest which is followed by a price decrease.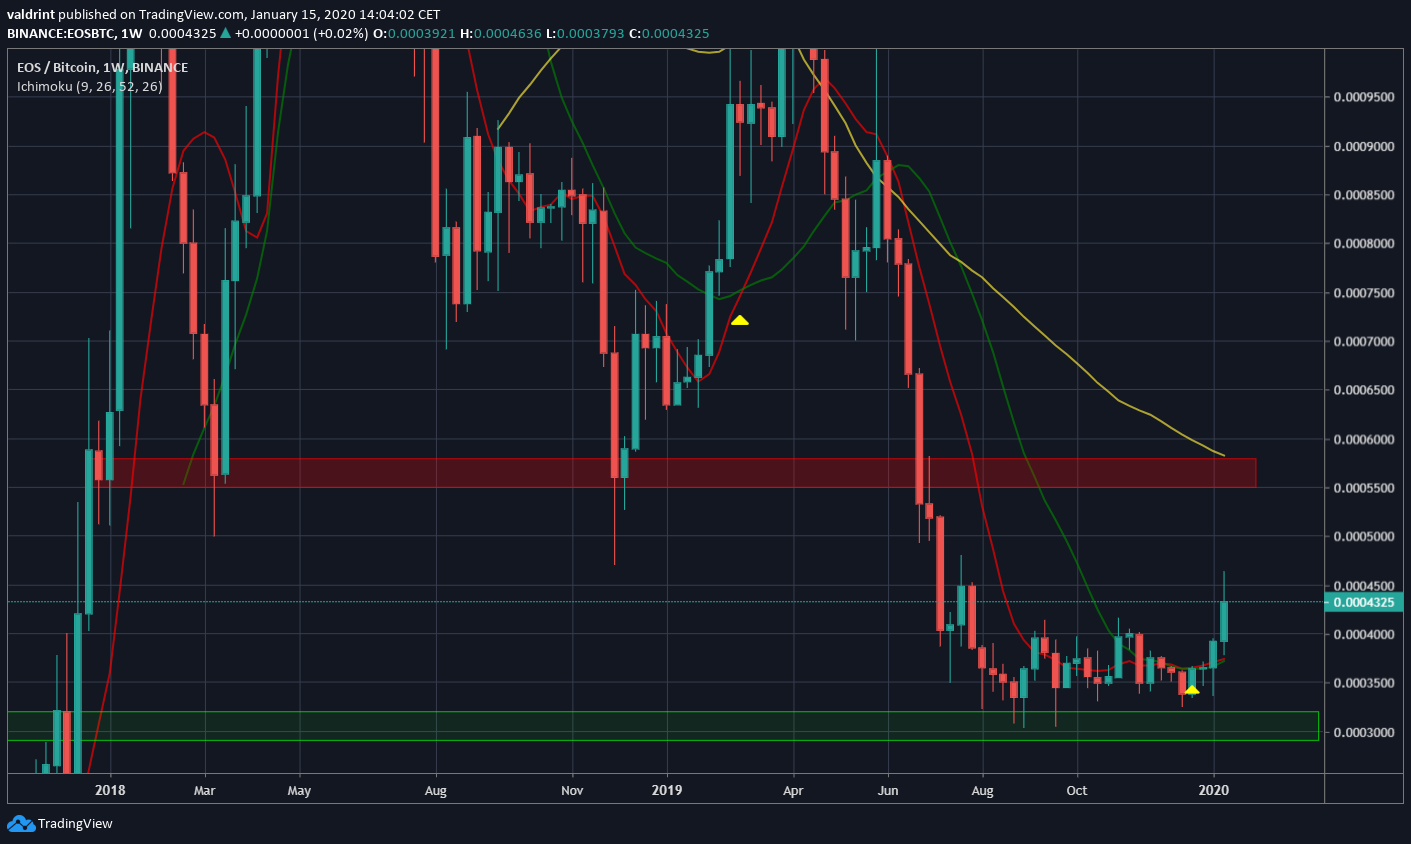
Disclaimer
In line with the Trust Project guidelines, this price analysis article is for informational purposes only and should not be considered financial or investment advice. BeInCrypto is committed to accurate, unbiased reporting, but market conditions are subject to change without notice. Always conduct your own research and consult with a professional before making any financial decisions. Please note that our Terms and Conditions, Privacy Policy, and Disclaimers have been updated.

Valdrin Tahiri
Valdrin discovered cryptocurrencies while he was getting his MSc in Financial Markets from the Barcelona School of Economics. Shortly after graduating, he began writing for several different cryptocurrency related websites as a freelancer before eventually taking on the role of BeInCrypto's Senior Analyst.
(I do not have a discord and will not contact you first there. Beware of scammers)
READ FULL BIO
Sponsored
Sponsored