
The EOS price has increased significantly in November and has almost broken out from a resistance area that has been in place since March.
While a short-term retracement could occur, EOS should eventually break out above this resistance area.
EOS Approaches Resistance
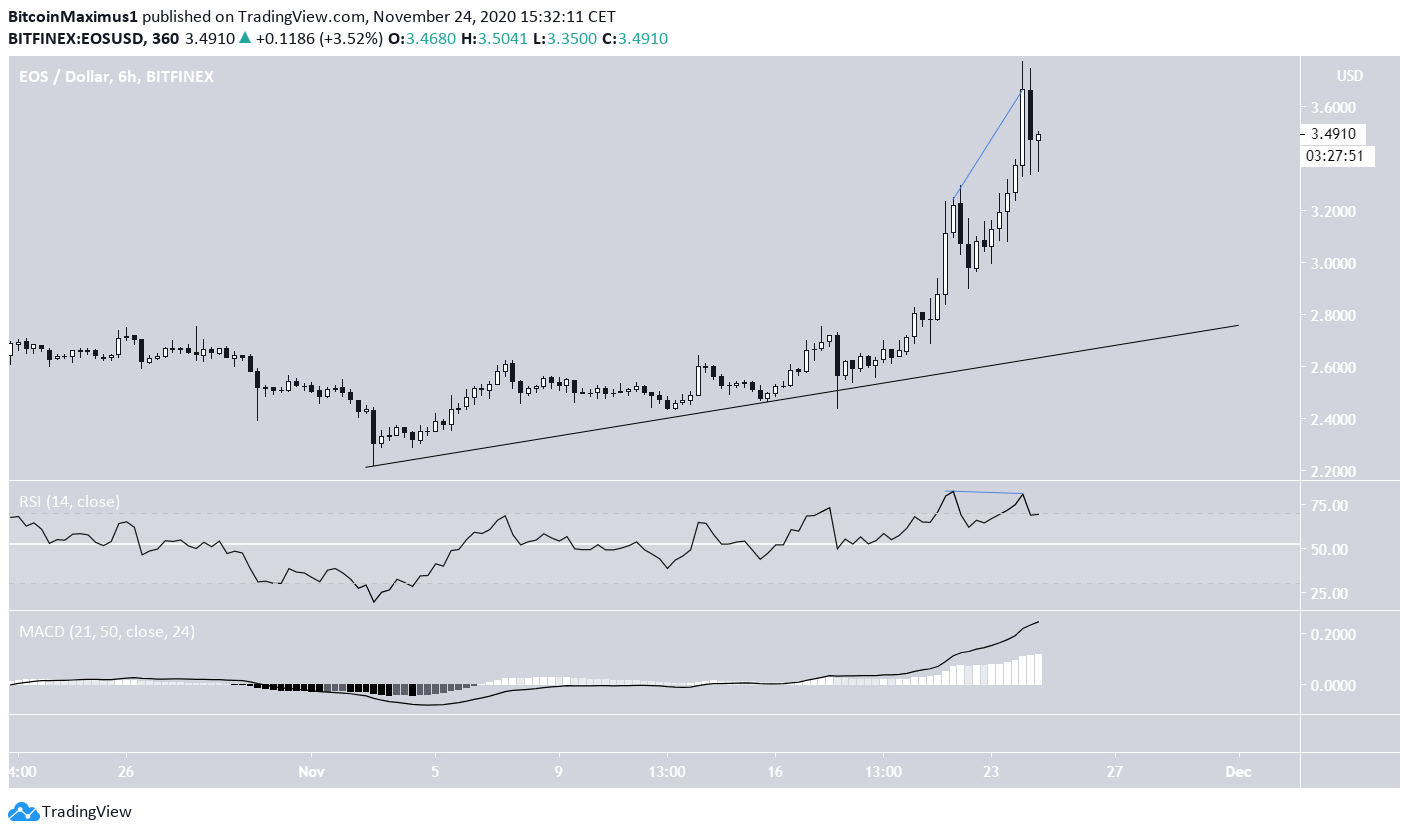
The EOS price has been increasing rapidly since reaching a low of $2.22 on Nov 3. The rally intensified on Nov 21, and the price has so far reached a high of $3.77. However, the price is in the process of creating a long upper wick and possibly a shooting star candlestick.
The main resistance area is at $3.90, a level above which EOS has not traded since March.
Technical indicators on the daily time-frame are still bullish, but show overbought conditions.

Future Movement
The shorter-term six-hour chart shows how the rally has turned parabolic. While the price might be following an ascending support line, it hasn’t been validated enough times. The support line currently sits all the way down at $2.80.
The RSI has formed bearish divergence inside its overbought region, indicating that a decline could occur.
The even shorter-term two-hour chart supports this possibility, showing more considerable bearish divergence in both the RSI and the MACD.
However, it also provides an ascending support line (dashed), which is currently near $3.20.
Therefore, the price could fall towards this level before moving upwards towards the $3.90 resistance area.
The loss of the short-term support line could cause the price to drop all the way to $2.80.

Wave Count
Cryptocurrency trader @CryptoTony_ outlined an EOS chart, stating that the price is completing a complex, W-X-Y corrective formation and will rally all the way to $5.50
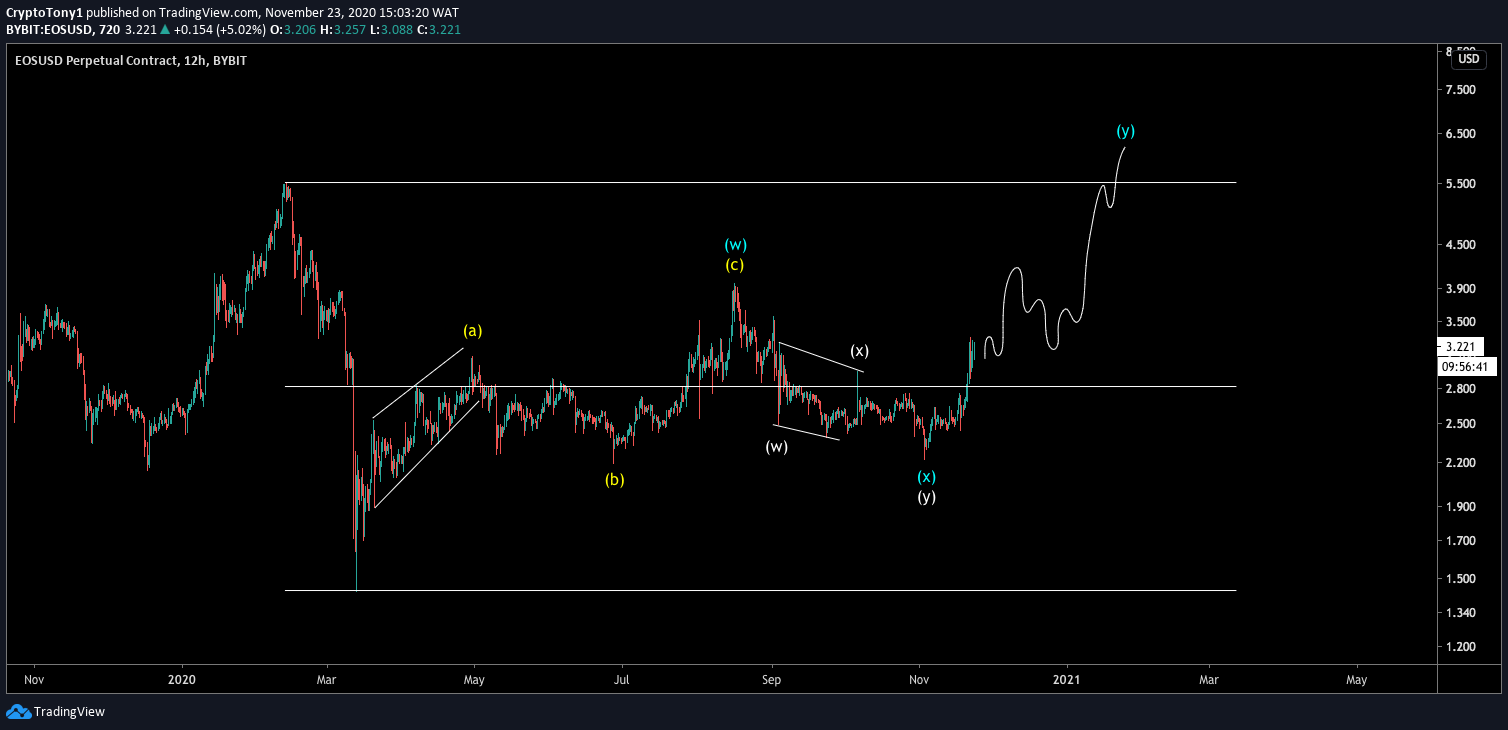
Counting from March, the most likely outlook is a W-X-Y corrective structure (shown in blue below), which is created by two A-B-C corrective structures (orange) connected by an X wave.
If the W and Y waves were to have the same length, the price would reach a high of $5.24.

A closer look at the A wave shows that the price is nearing the top of the move, also fitting with the readings from technical indicators.
After the fifth wave (black) is completed, the price should retrace significantly before making another attempt at breaking out.
While the retracement level depends on the high, which may have not been reached yet, the $2.87 – $3.07 area serves as a decent preliminary support level.

Conclusion
To conclude, the EOS price should soon reach a top near $3.90 before retracing. Afterwards, the ensuing upward move could potentially take the price towards $5.
For BeInCrypto’s previous Bitcoin analysis, click here!
Disclaimer: Cryptocurrency trading carries a high level of risk and may not be suitable for all investors. The views expressed in this article do not reflect those of BeInCrypto
Disclaimer
In line with the Trust Project guidelines, this price analysis article is for informational purposes only and should not be considered financial or investment advice. BeInCrypto is committed to accurate, unbiased reporting, but market conditions are subject to change without notice. Always conduct your own research and consult with a professional before making any financial decisions. Please note that our Terms and Conditions, Privacy Policy, and Disclaimers have been updated.
