ICON (ICX) is trading near the end of a bullish reversal pattern, from which a breakout is expected.
EOS (EOS) has created a long-term double-bottom, which could reverse its own current bearish trend.
EOS (EOS)
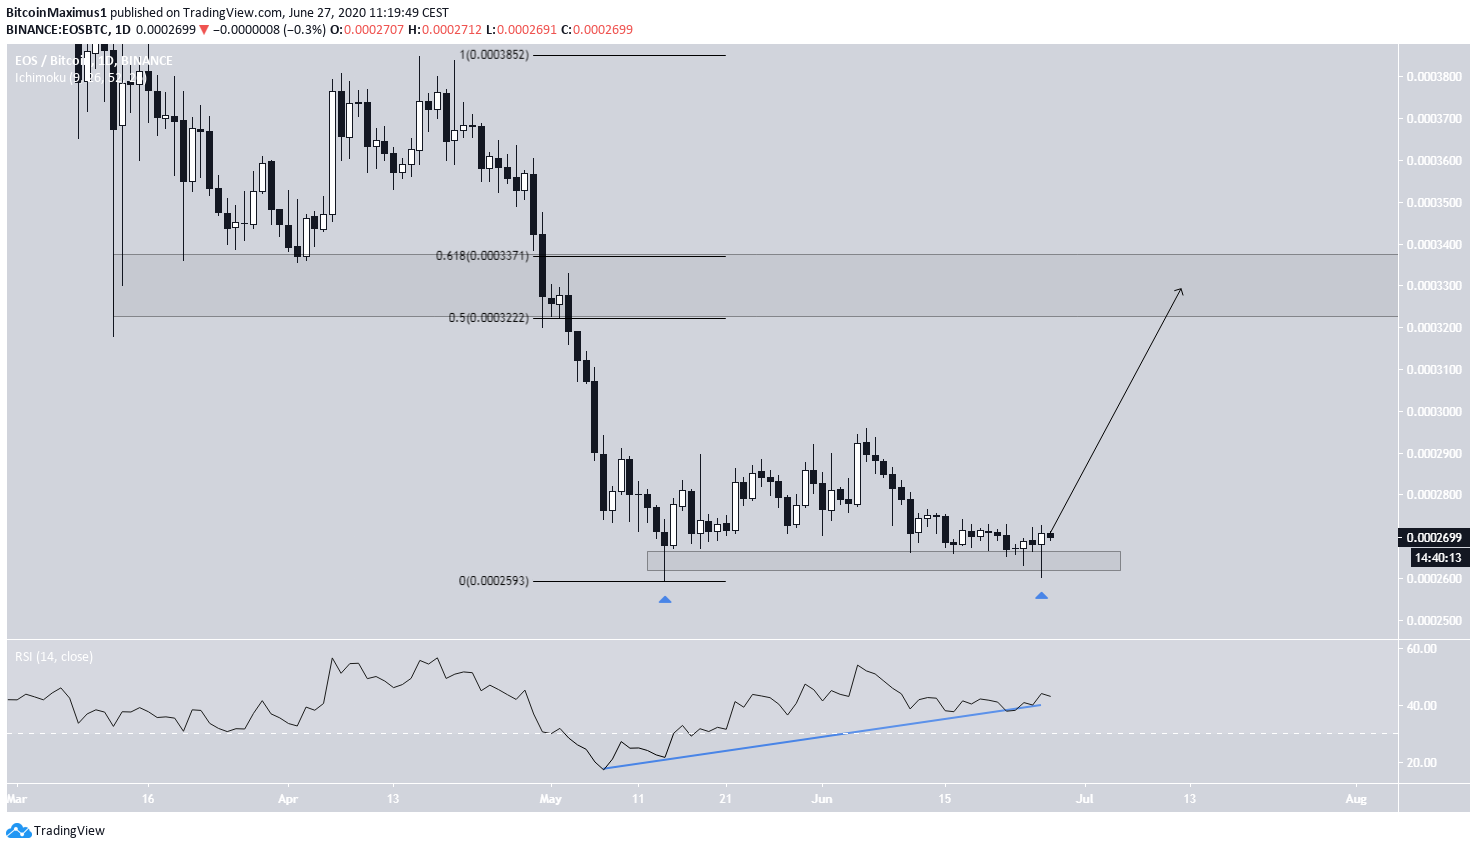
On May 14, the EOS price reached a low of 25,930 satoshis, creating a hammer candlestick. After a gradual increase spanning two weeks, the price began to move back down.
On June 26, the price created another hammer near 25,000 satoshis, this time with a bullish close. This effectively created a double-bottom, which is considered a bullish reversal pattern and was combined with significant bullish divergence in the daily RSI.
This is a sign that the price is likely to move upwards, and could reach the 32,200-33,700 satoshi resistance area, also the 0.5-0.618 Fib levels of the entire previous downward move.
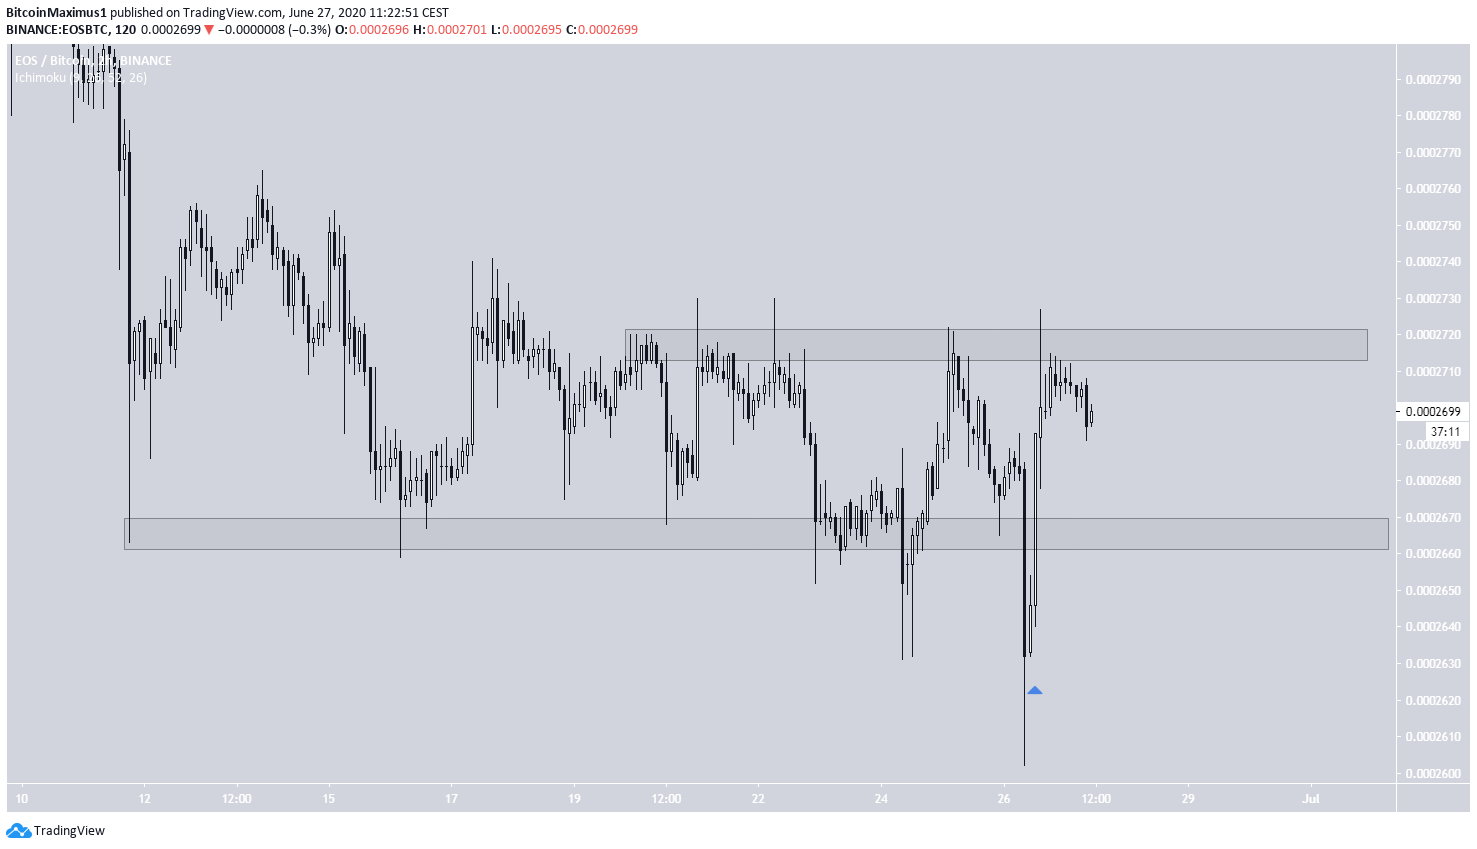
In the short-term, EOS initially decreased below the 26,650 satoshi minor support area, but created a morning star pattern and reclaimed this level. It is currently facing resistance from 27,200 satoshis.
If the price is successful in reclaiming this area as support, which seems likely, it would be expected to increase towards the resistance area outlined in the previous chart.
ICON (ICX)
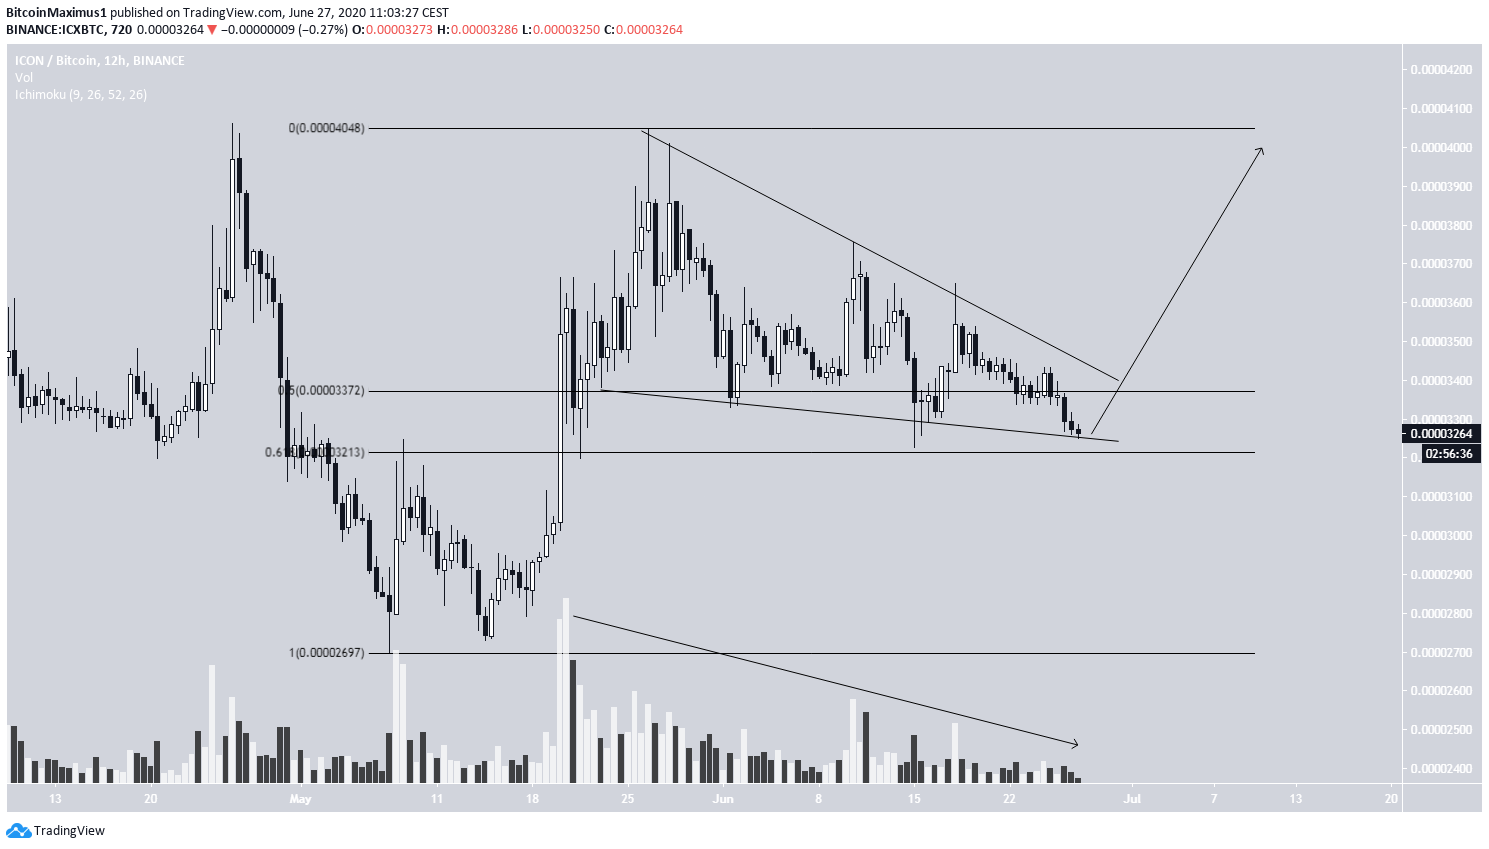
The ICX price has been decreasing since reaching a high of ₿0.00004046 on May 26. The decrease has taken the shape of a descending wedge, which is considered a bullish reversal pattern. The decrease in volume since the high suggests that a decisive move will soon occur.
At the time of writing, the price was trading between the 0.5-0.618 Fib levels of the entire upward move, a very likely place for a reversal.
As long as the price does not break down below ₿0.00003213, both the descending resistance line of the wedge and the 0.618 Fib level, it is expected to break out and make another attempt at the May 26 high.
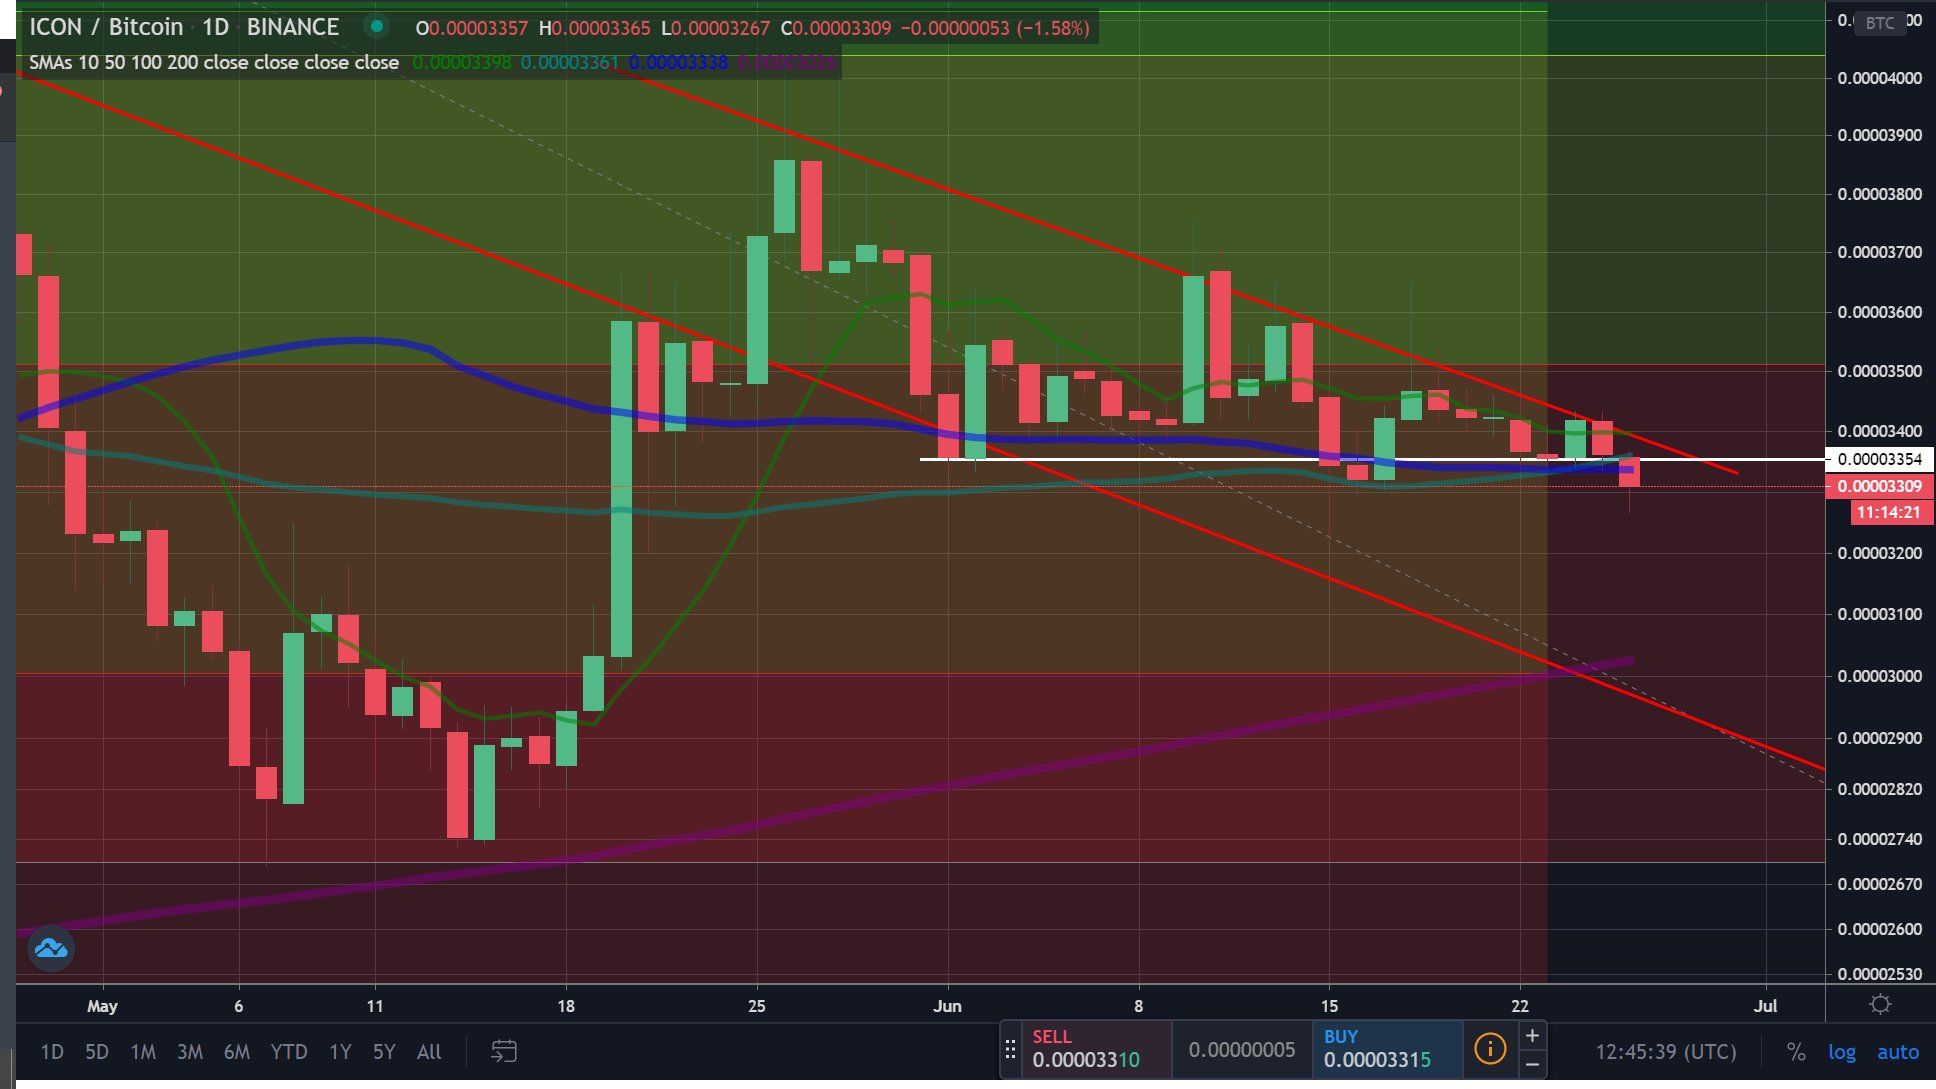
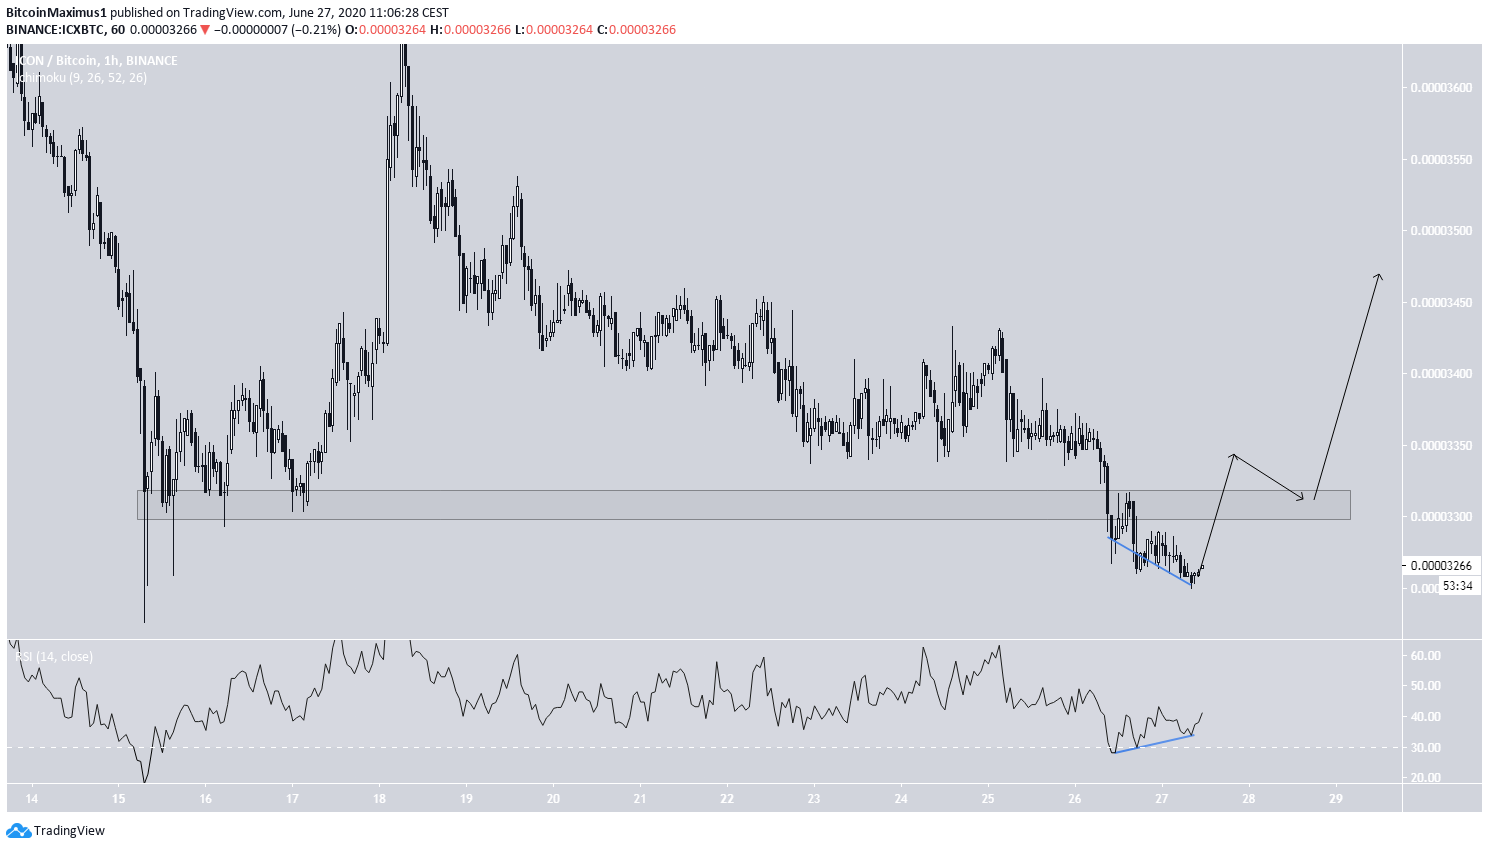
In the shorter-term, ICX has just fallen below the ₿0.000033 support level, which was the catalyst for an upward move on June 15.
However, the hourly RSI shows considerable bullish divergence. In order for this short-term decrease to be considered a deviation below the support, ICX has to reclaim this area and continue moving upwards.
A rejection from ₿0.000033 and the subsequent validation of this area as resistance would indicate that ICX is more likely to break down from the wedge instead.
Cryptocurrency trader @PlutusCrypto stated that he believes ICX is not yet done decreasing and will fall to ₿0.00003.