


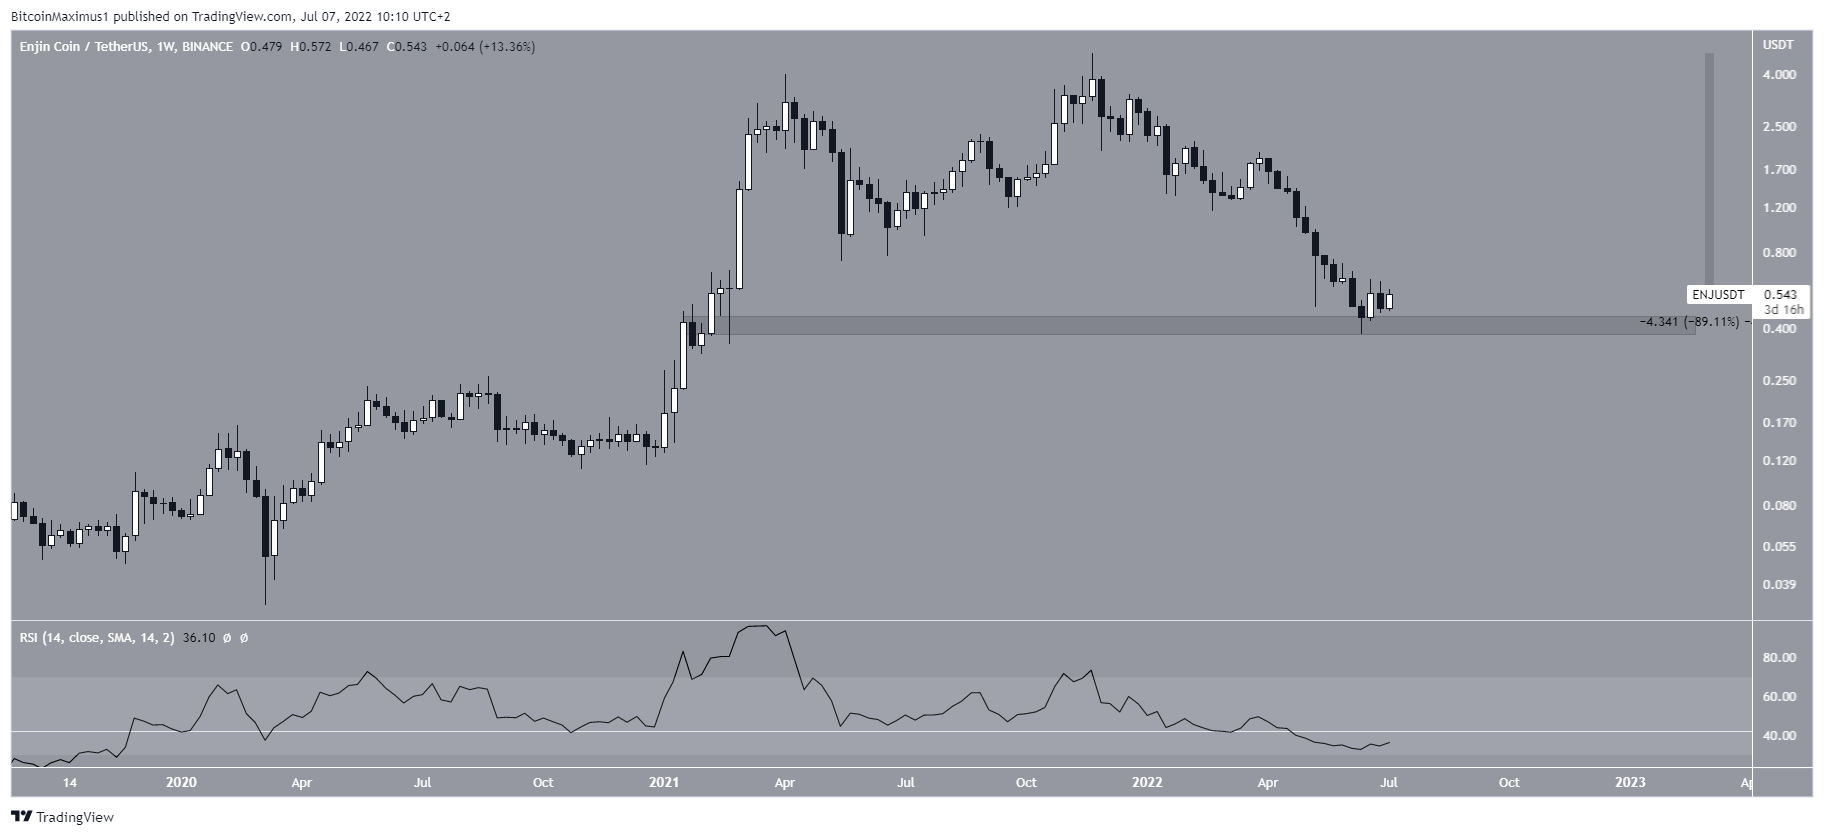
Since May 16, Enjin Coin (ENJ) has been in the process of creating a bullish pattern that has been combined with bullish divergence in the RSI.
ENJ has been falling since reaching an all-time high price of $4.84 in Nov. So far, it has decreased by 89%.
The price has bounced at the $0.40 horizontal support area. Prior to this, the level had not been reached since the beginning of 2021.
An interesting development is that the RSI has fallen below 50. This had not occurred since March 2020, when the entire upward movement began.
Double bottom pattern
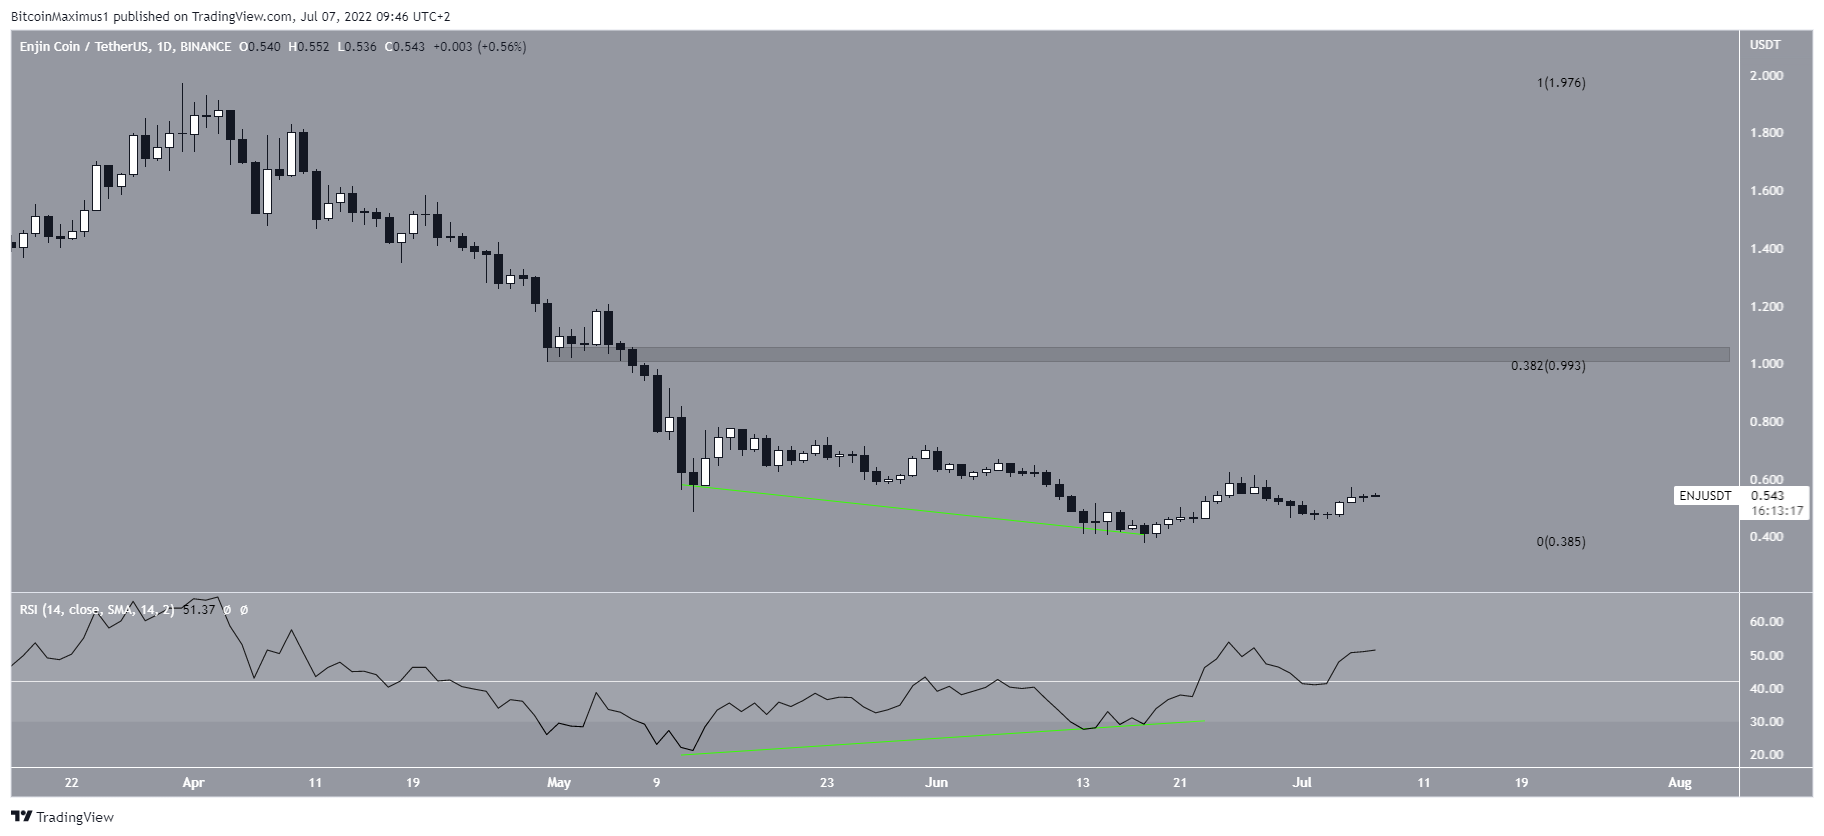
In a shorter time frame, ENJ has been falling since reaching a high of $1.97 on March 31. The downward movement led to a low of $0.37 on June 18.
In the period between May 12 and June 18, the price created a double bottom, which is considered a bullish pattern.
The double bottom was also combined with bullish divergence in the daily RSI (green line). Additionally, the RSI completed a swing bottom by moving above the high between the divergences (white line). This is a sign that the upward movement is expected to continue.
If the pattern leads to a breakout, the closest resistance area would be between $1 and $1.05, created by the 0.382 Fib retracement resistance level and a horizontal resistance area.
Sixth attempt at breaking out
Cryptocurrency trader @Eliz883 tweeted a chart of ENJ, stating that recovery could continue if the price manages to hold above $0.50.
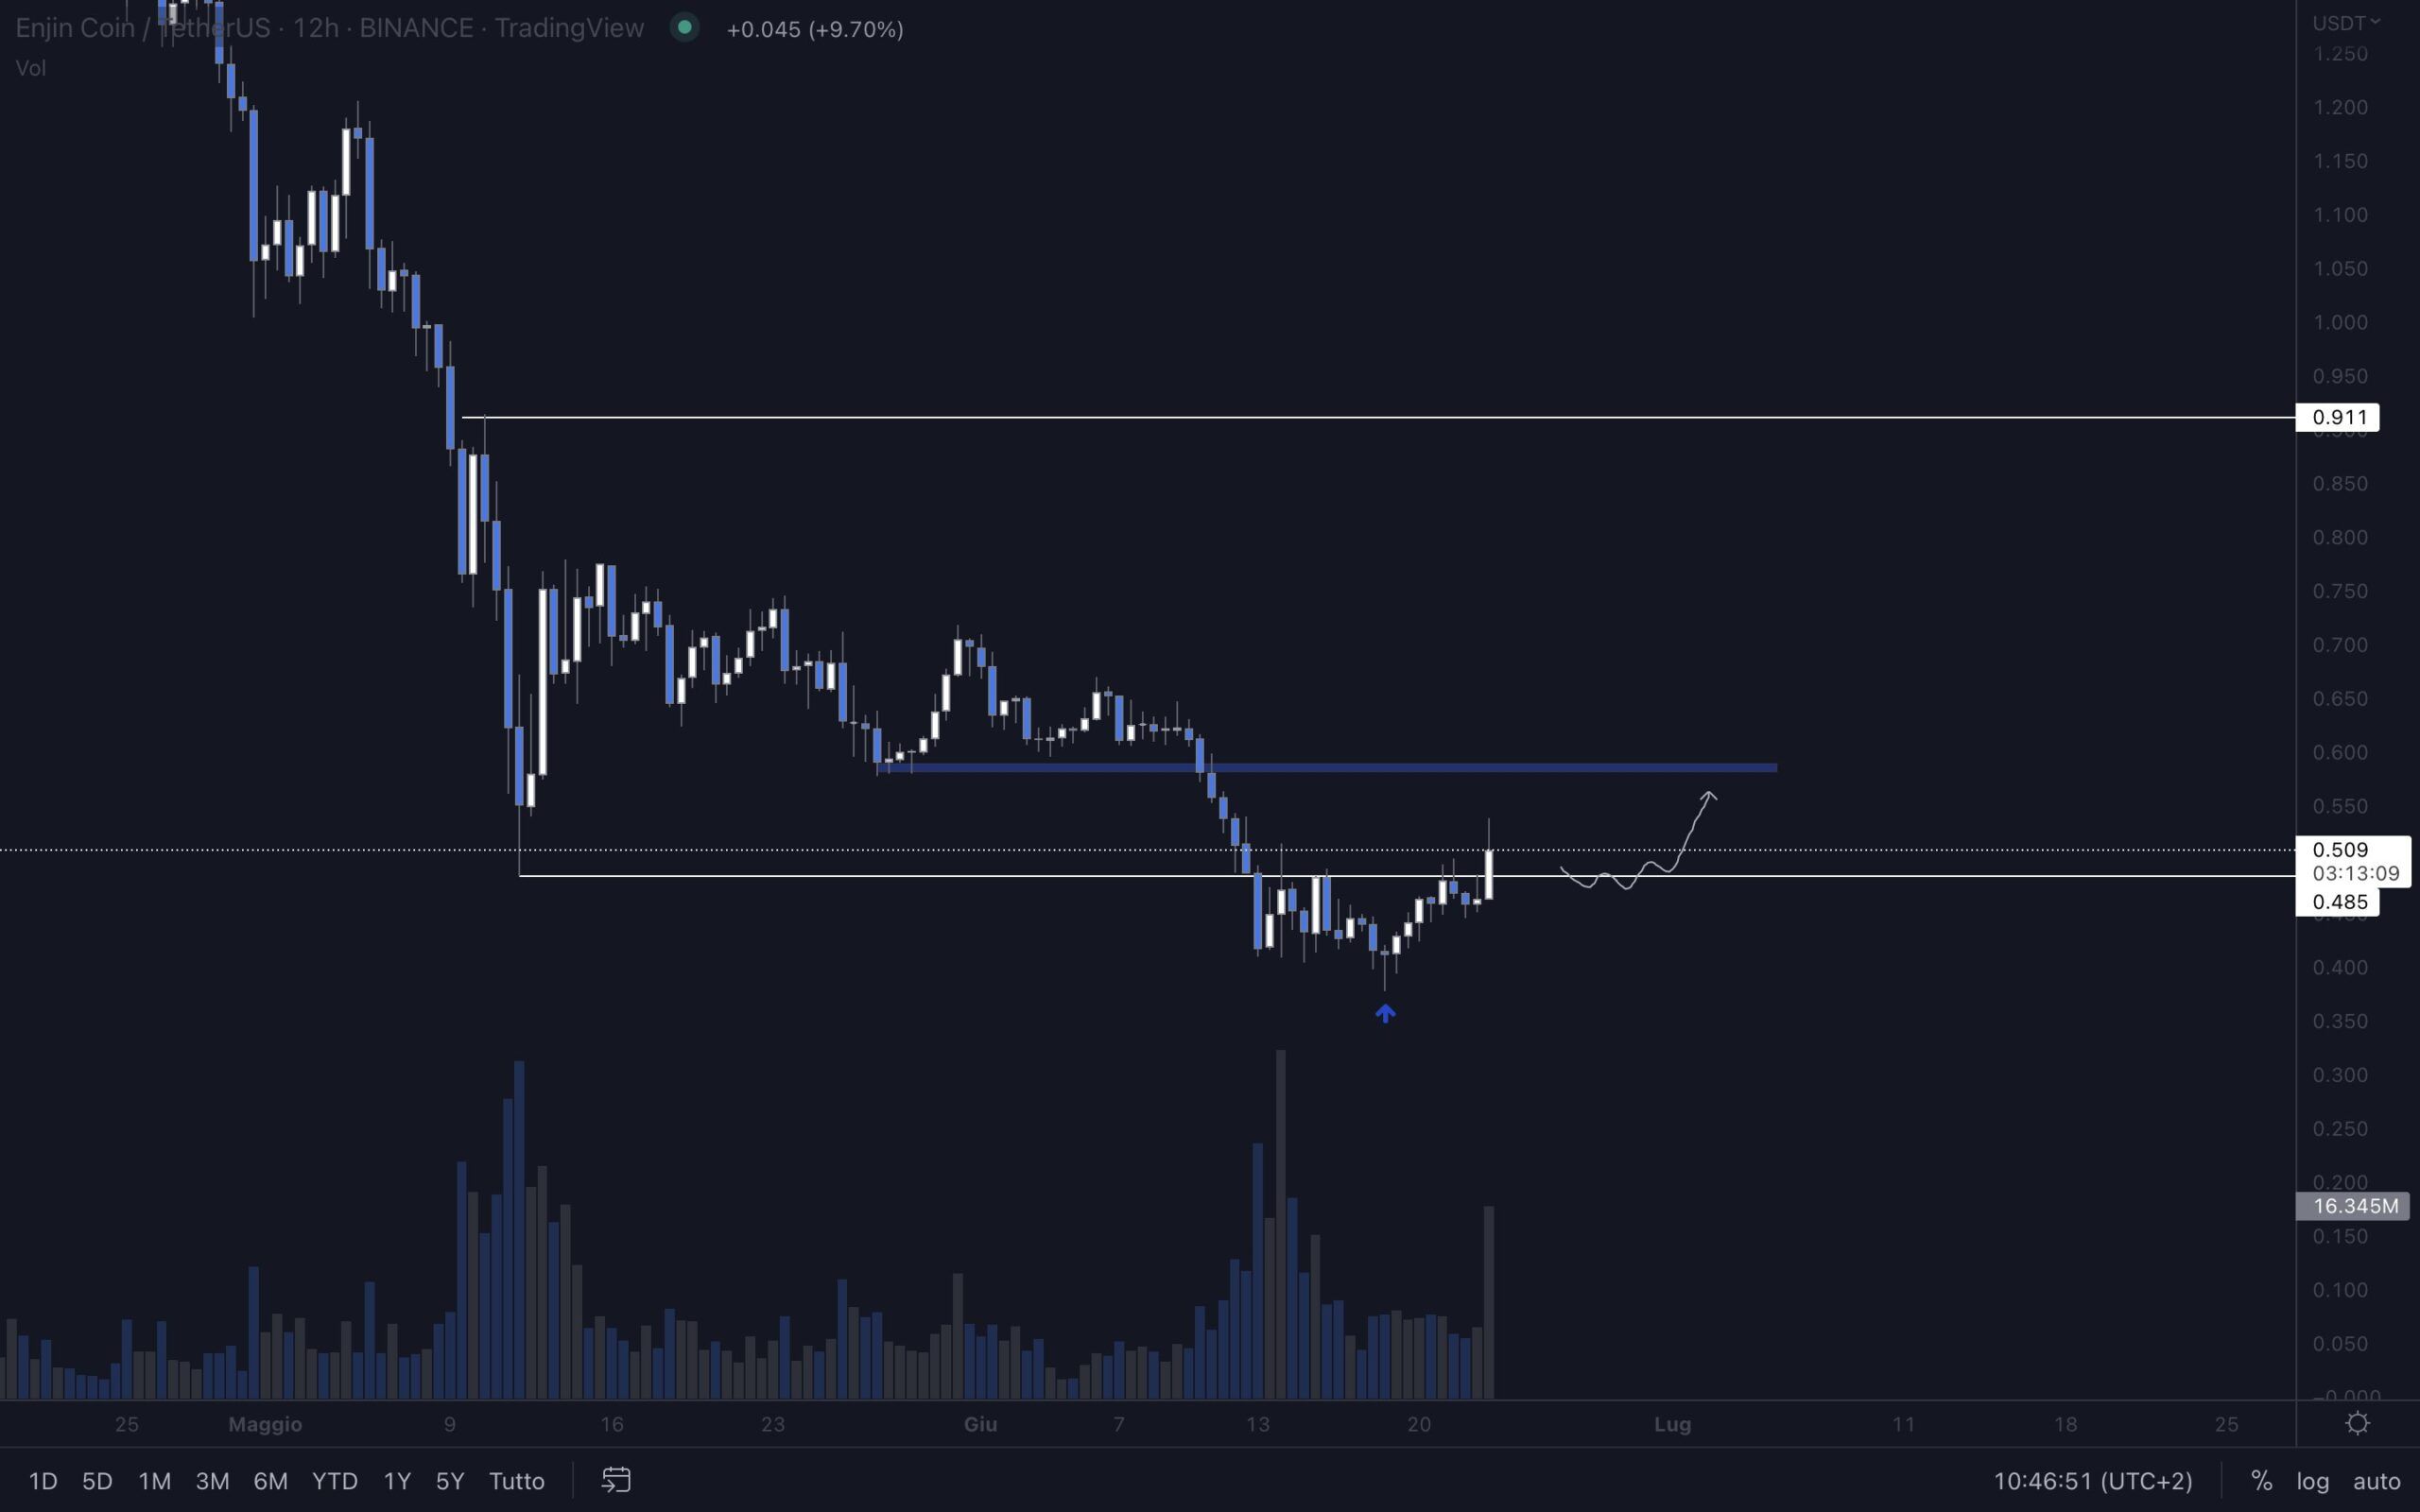
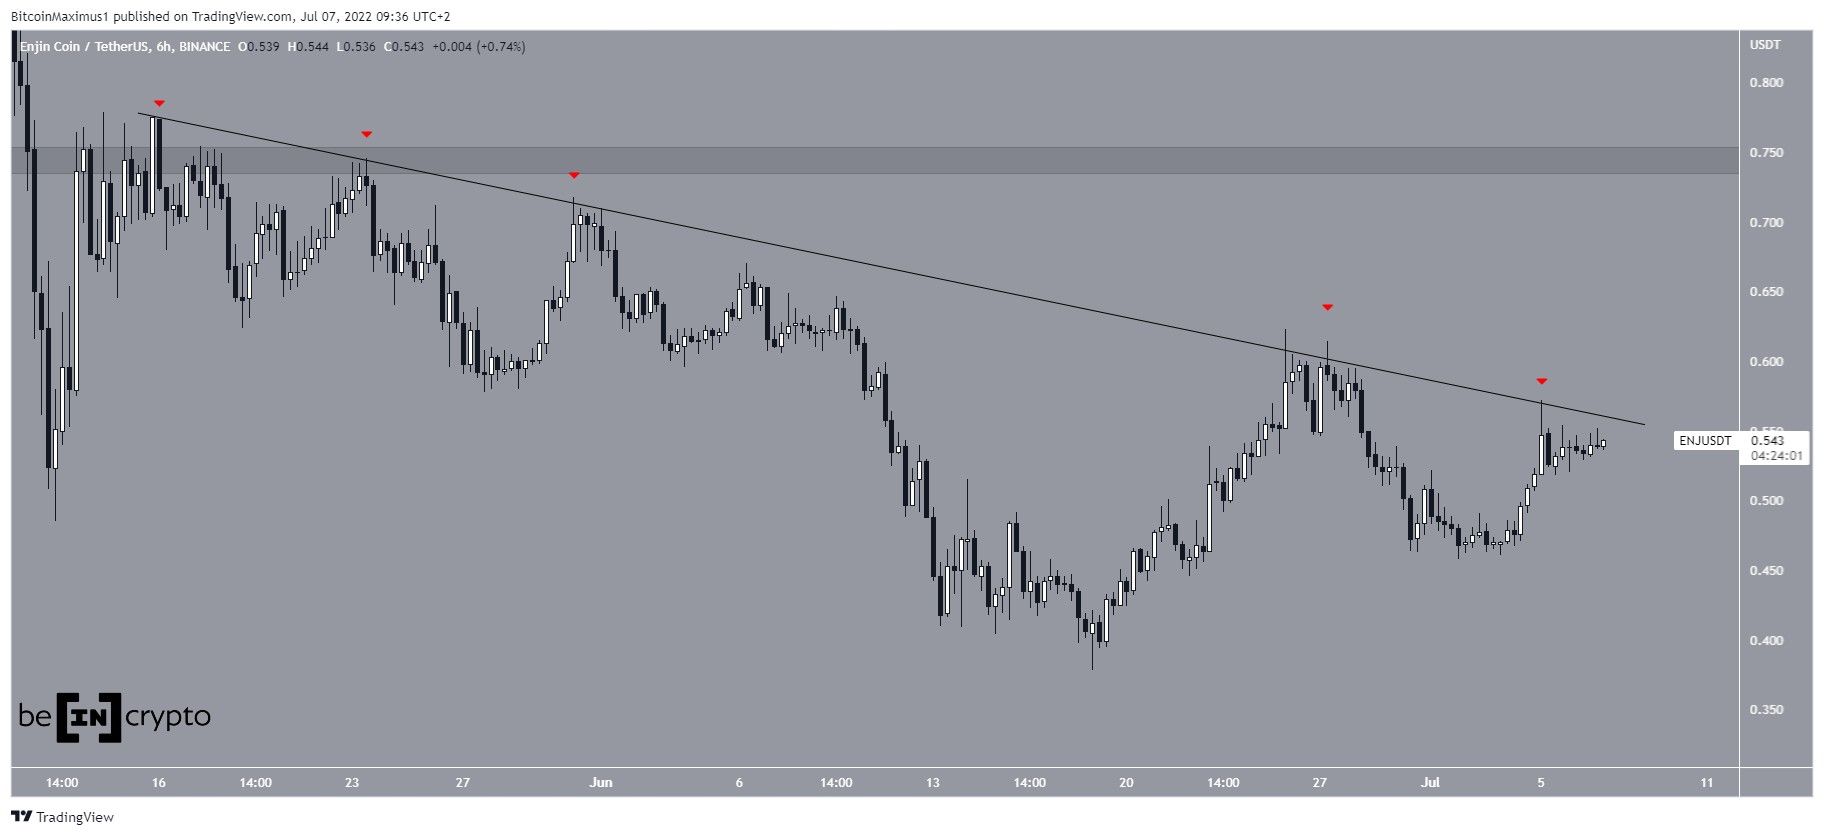
Since the tweet, the price has managed to hold on above $0.50. Additionally, it is very close to a descending resistance line that has been in place since May 16.
So far, ENJ has made five attempts at breaking out (red icons) and is in the process of making the sixth one. Since resistances get weaker each time they are touched, an eventual breakout would be expected.
If one occurs, the closest resistance area would be at $0.75.
For Be[in]Crypto’s latest bitcoin (BTC) analysis, click here


