


After a strong upward move, ENJ has been retracing over the past ten days. The price is trading inside a significant support area, and the action is considered bullish as long as it remains here.
Current Support
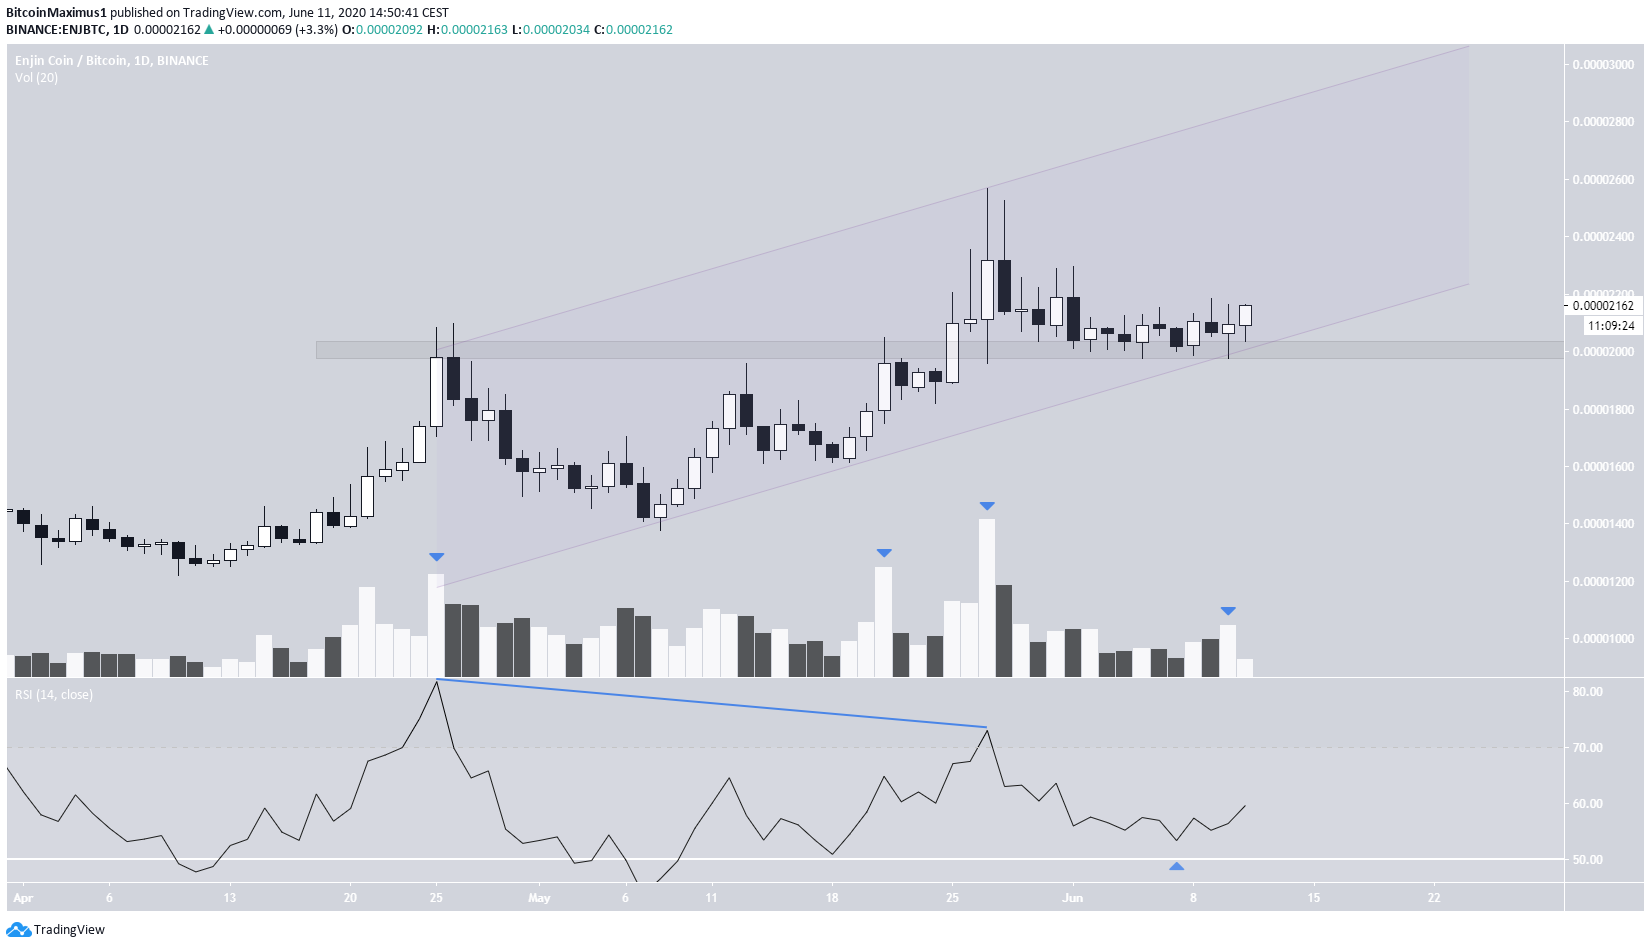
Enjin Coin (ENJ) has been increasing since August 2019, but the rate of increase began to accelerate on March 12, 2020. The most important area for ENJ is found at 2000 satoshis.
This area initially acted as the high on March 25, causing a long retracement before the price finally broke out on May 26. It reached a high of 2567 satoshis the next day. Since then, the rate has been declining and has validated the 2000 satoshi support area.
While technical indicators do not confirm the move just yet, they are leaning slightly bullish. There is bearish divergence on the RSI, and a decline has already taken place as a result. The price has since validated the previously mentioned support area.
In addition, the RSI bounced above the 50 MA line. Finally, volume has also moved higher on the bullish candlesticks. As long as the price stays above the support area, price action is bullish. While not yet confirmed, ENJ may be trading inside a parallel ascending channel, the resistance line of which currently stands at 4900 satoshis.
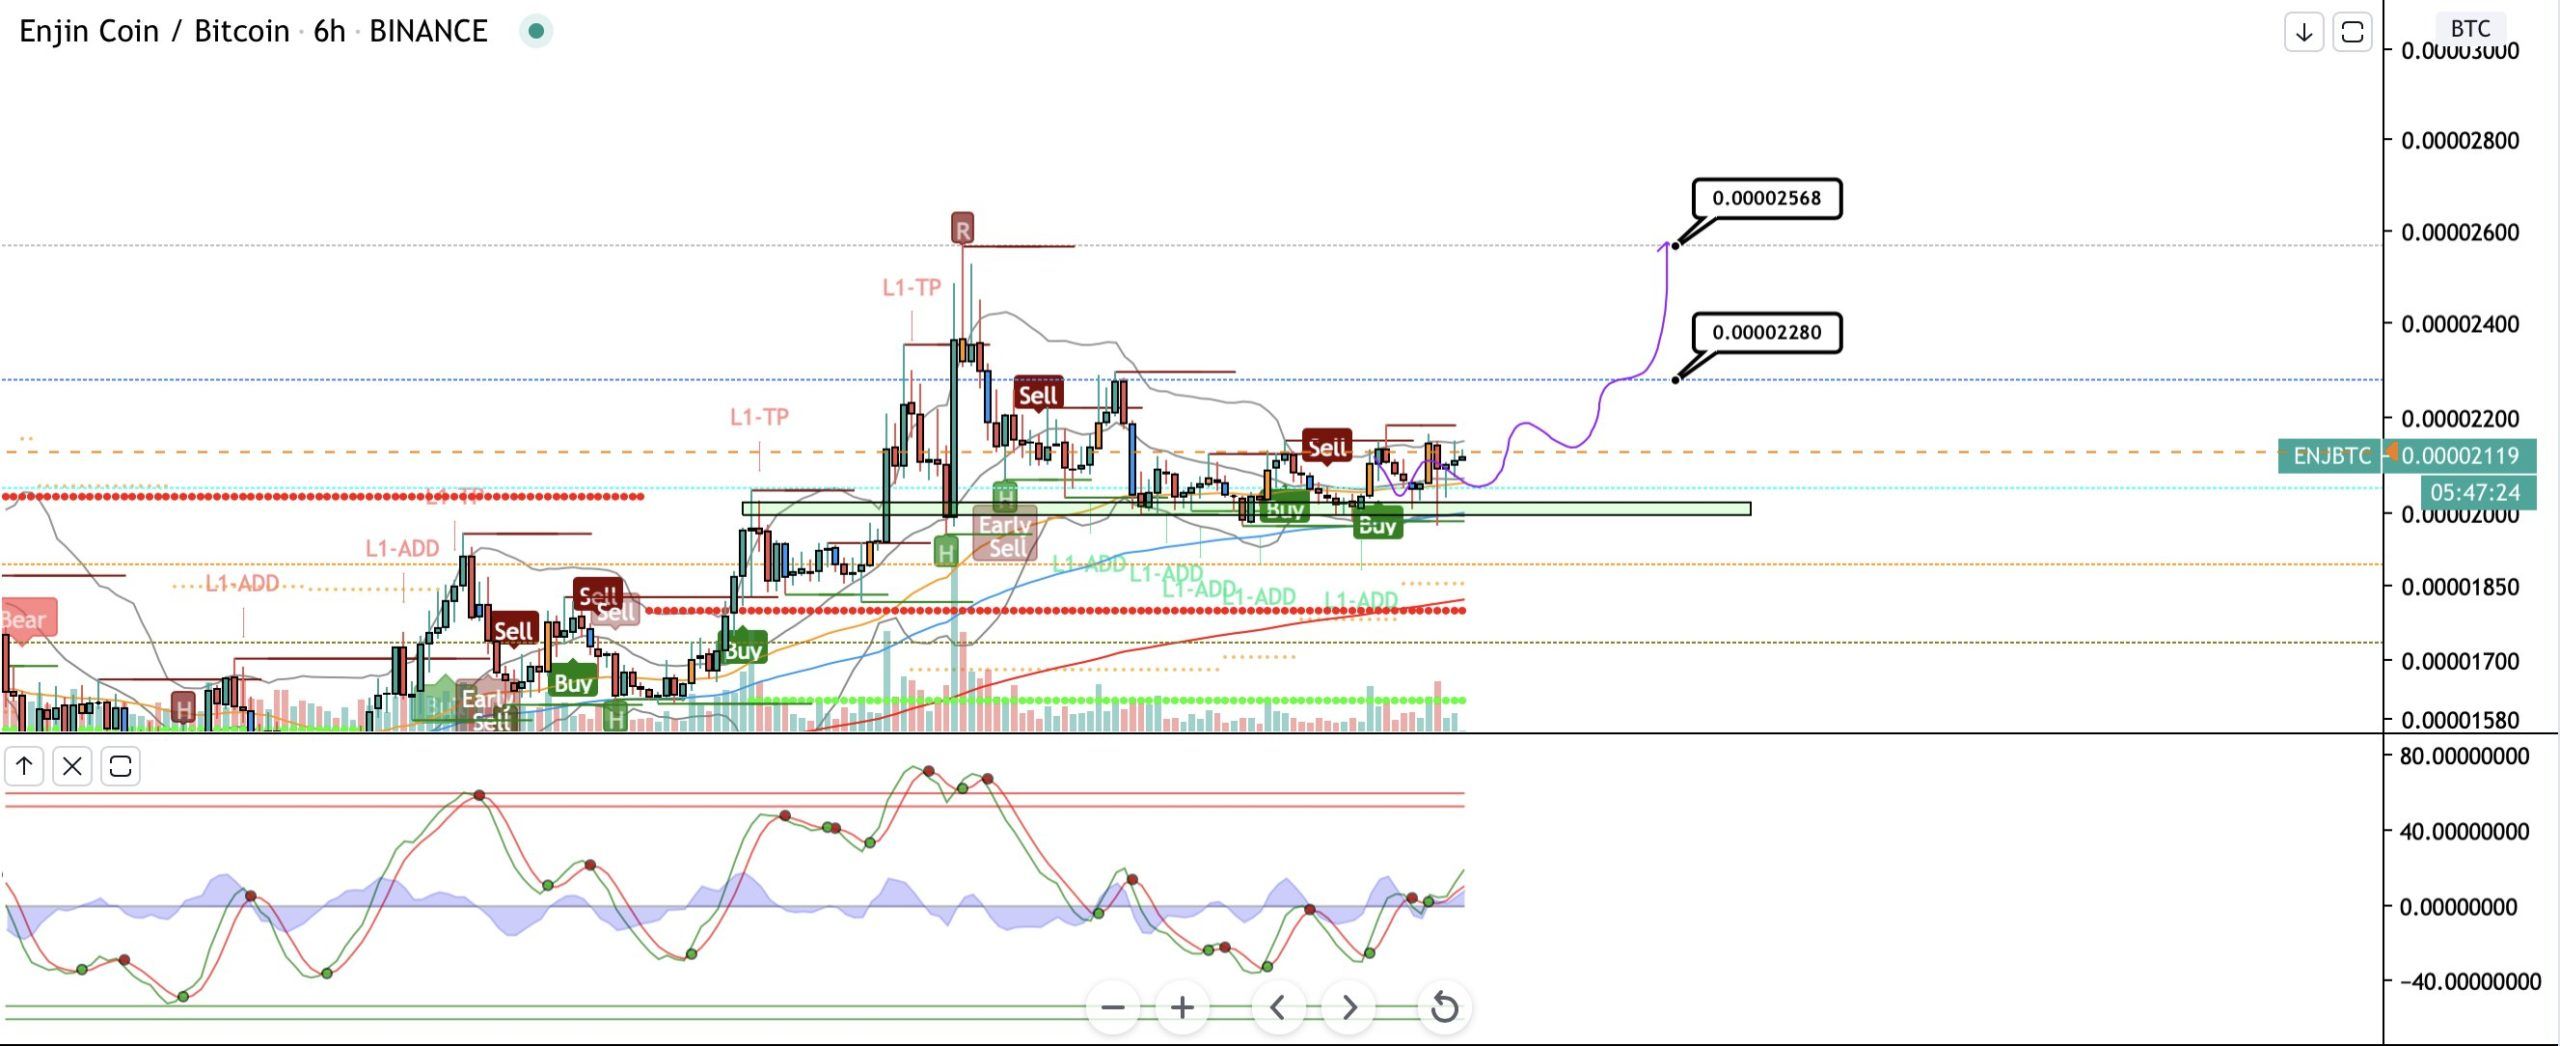
Cryptocurrency analyst @CryptoNewton has a bullish view, and he believes that the price will go all the way to 2568 satoshis:
Short-Term Movement
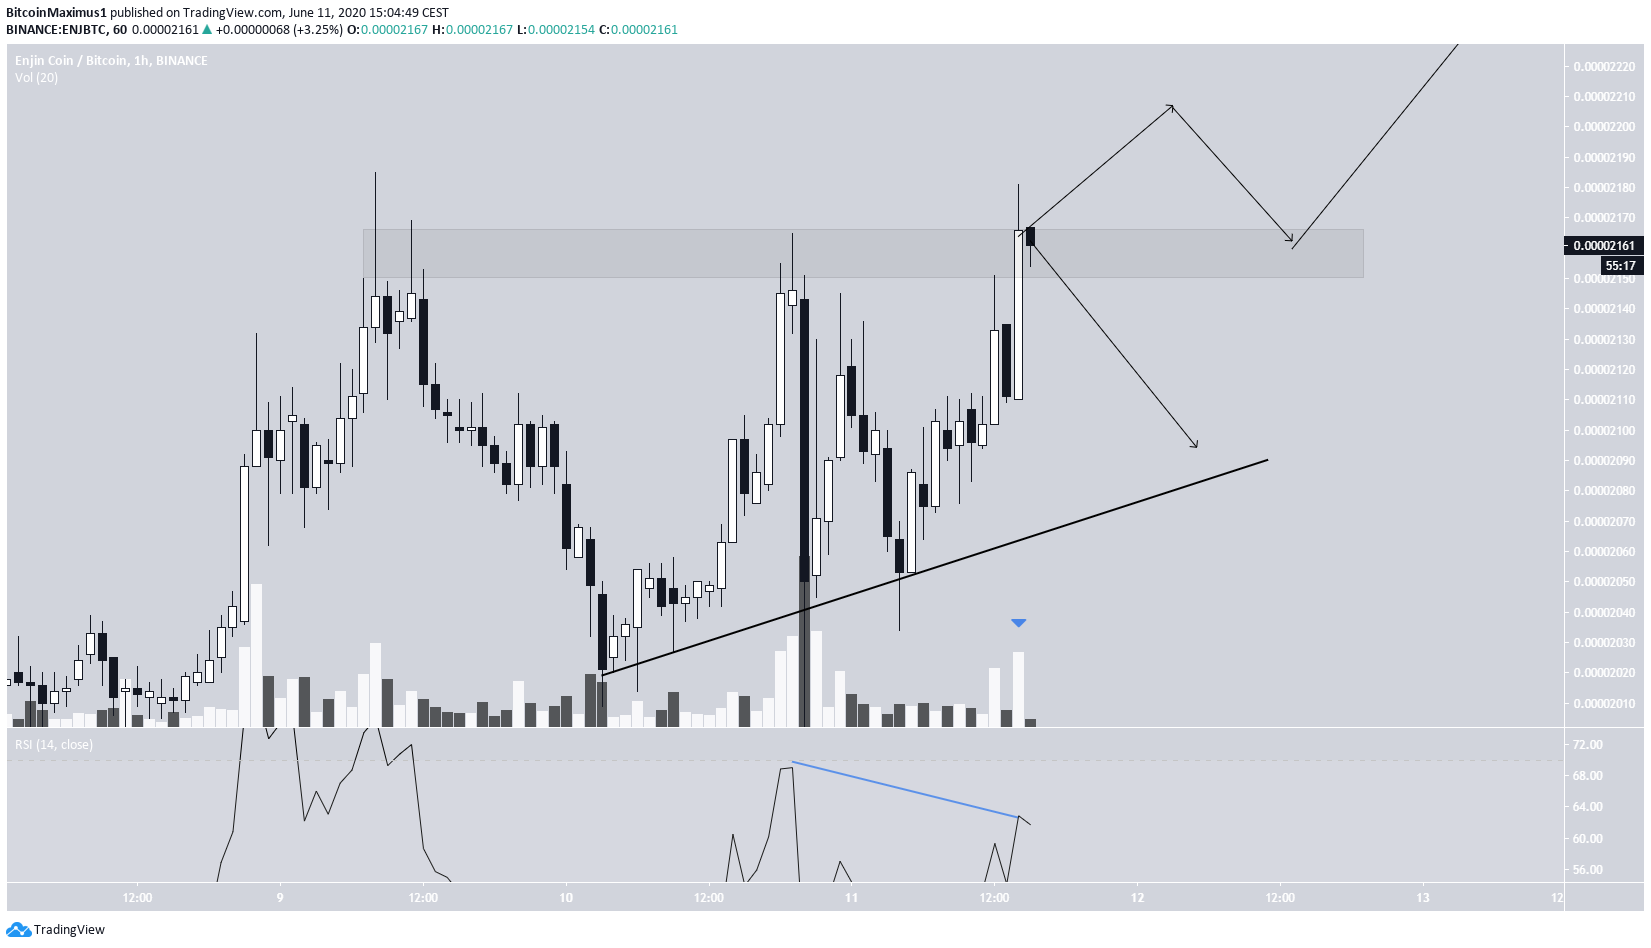
In the short-term, ENJ is facing resistance at 2150 satoshis. Inside this area, it has created a triple top, a bearish reversal pattern. This is also combined with bearish divergence on the RSI. Therefore, the price is likely to decrease towards the rising support line, currently at 2050 satoshis.
On the other hand, a breakout and subsequent validation of the current resistance area as support would likely take the price higher, but that seems unlikely at this time.
Long-Term Movement
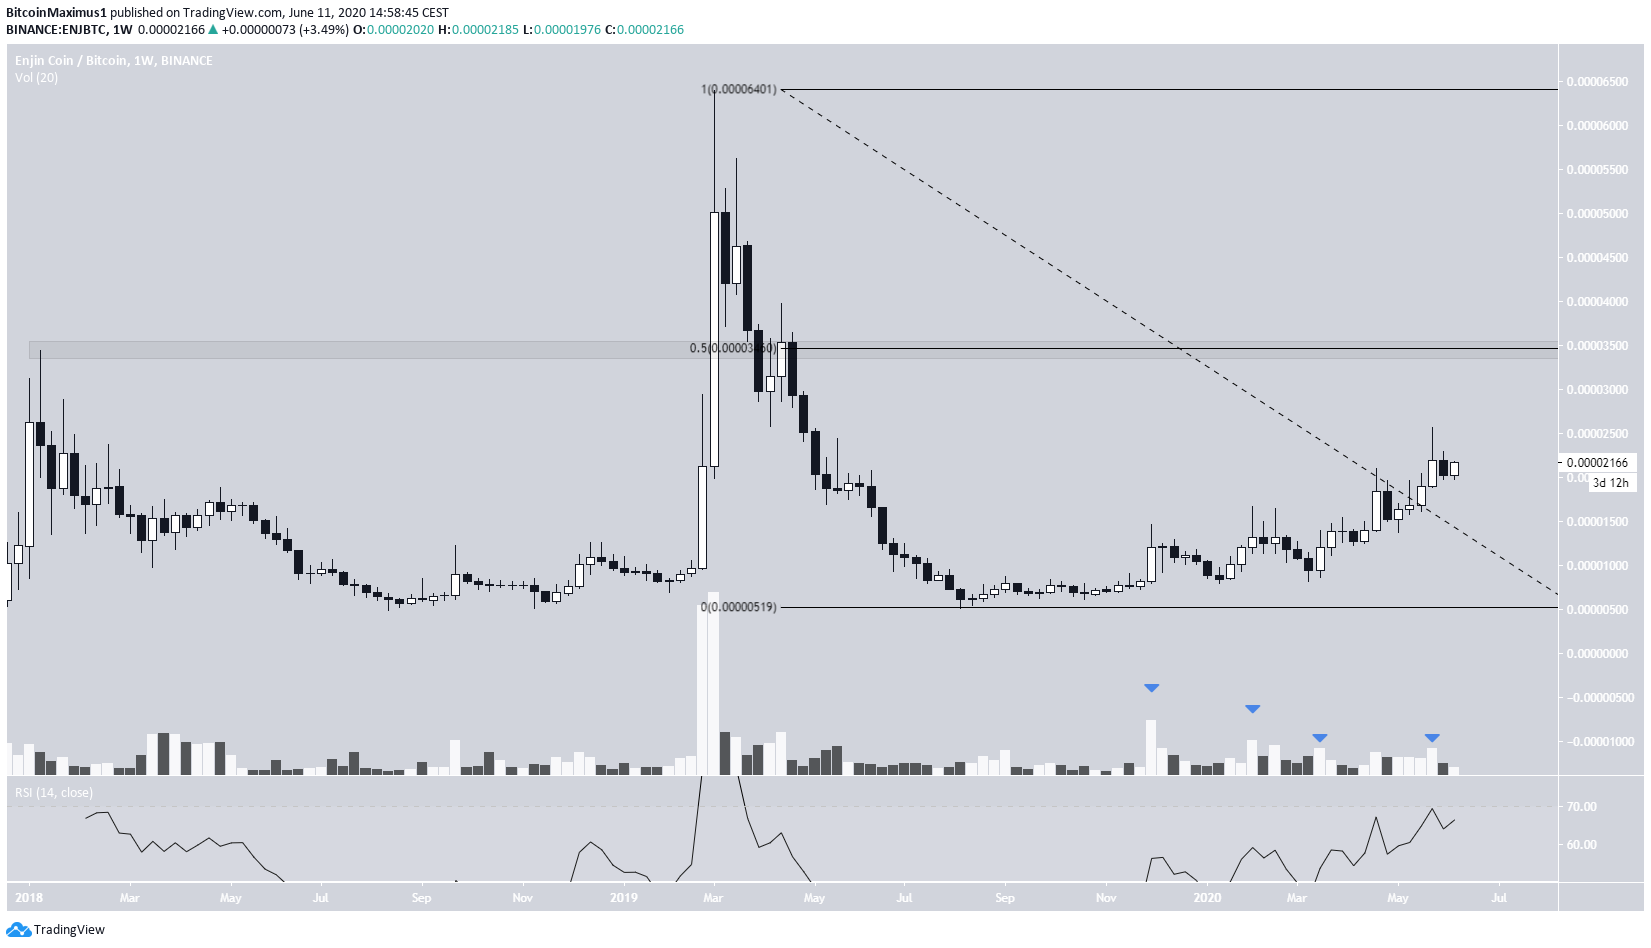
The long-term chart is bullish. And volume is clearly higher as prices rally. The RSI is rising on strength, without forming any traces of bearish divergence.
If the aforementioned 2000 satoshi support area holds, ENJ could increase all the way to 3500 satoshis, the 0.5 Fib level of the previous decline.
To conclude, as long as ENJ is trading above 2000 satoshis, it should gradually move towards the 3500 satoshi area. A breakdown below this area would likely trigger an extended correction.


