

The Elrond (EGLD) price has been consistently reaching new all-time highs since breaking out from the $29.50 resistance area on Jan. 5.
The trend has not shown any noticeable signs of weakness and Elrond is expected to continue increasing towards $84-$85.
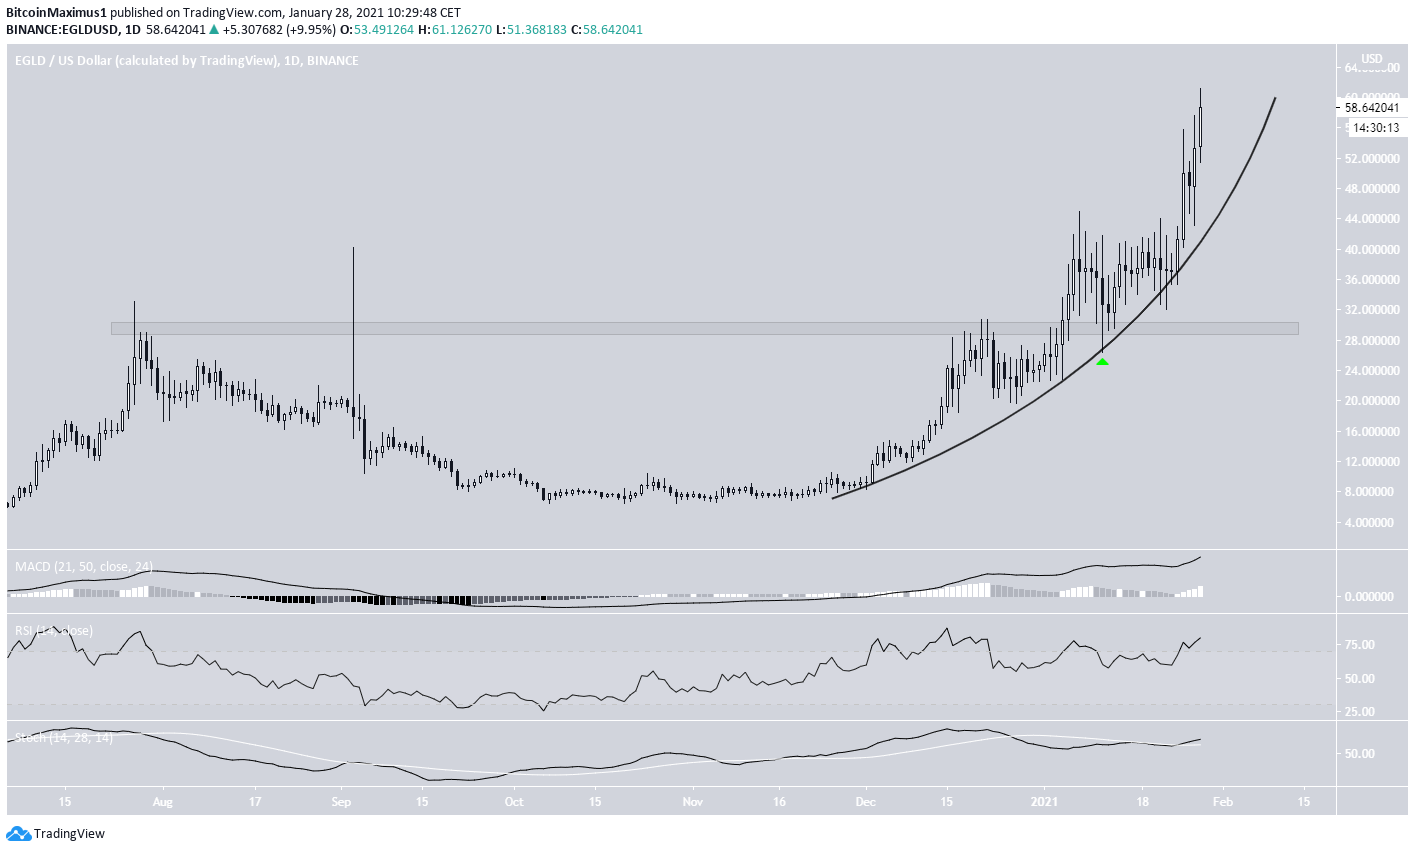
Elrond Breakout and Resistance Levels
On Jan. 5, EGLD broke out from the $29.50 resistance area, which had been in place since July 2020.
After retesting it as support on Jan. 11, EGLD resumed its upward movement, which has now become parabolic. So far, it has reached an all-time high price of $59.50.
Despite the parabolic rate of increase, technical indicators are not yet showing any signs of weakness. The Stochastic oscillator, MACD, and RSI are all increasing and none have generated a bearish divergence.
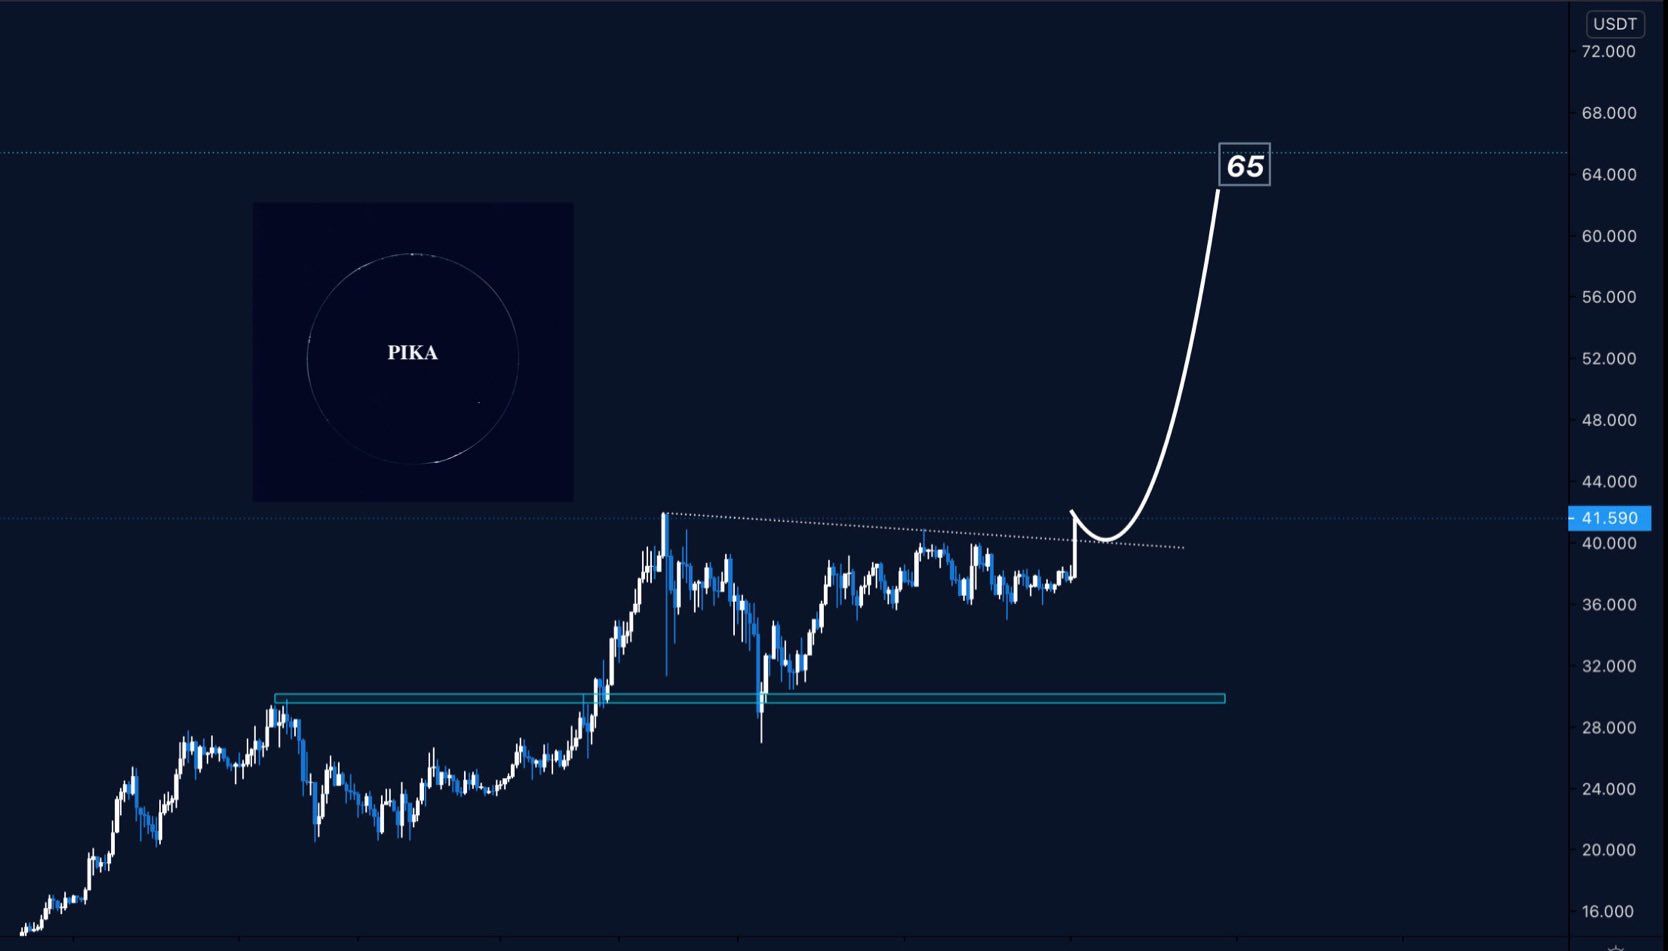
Cryptocurrency trader @Crypto_Off outlined an EGLD chart that shows a potential increase to $65. As shown above, EGLD has broken out since the tweet and is currently in the process of moving towards the target.
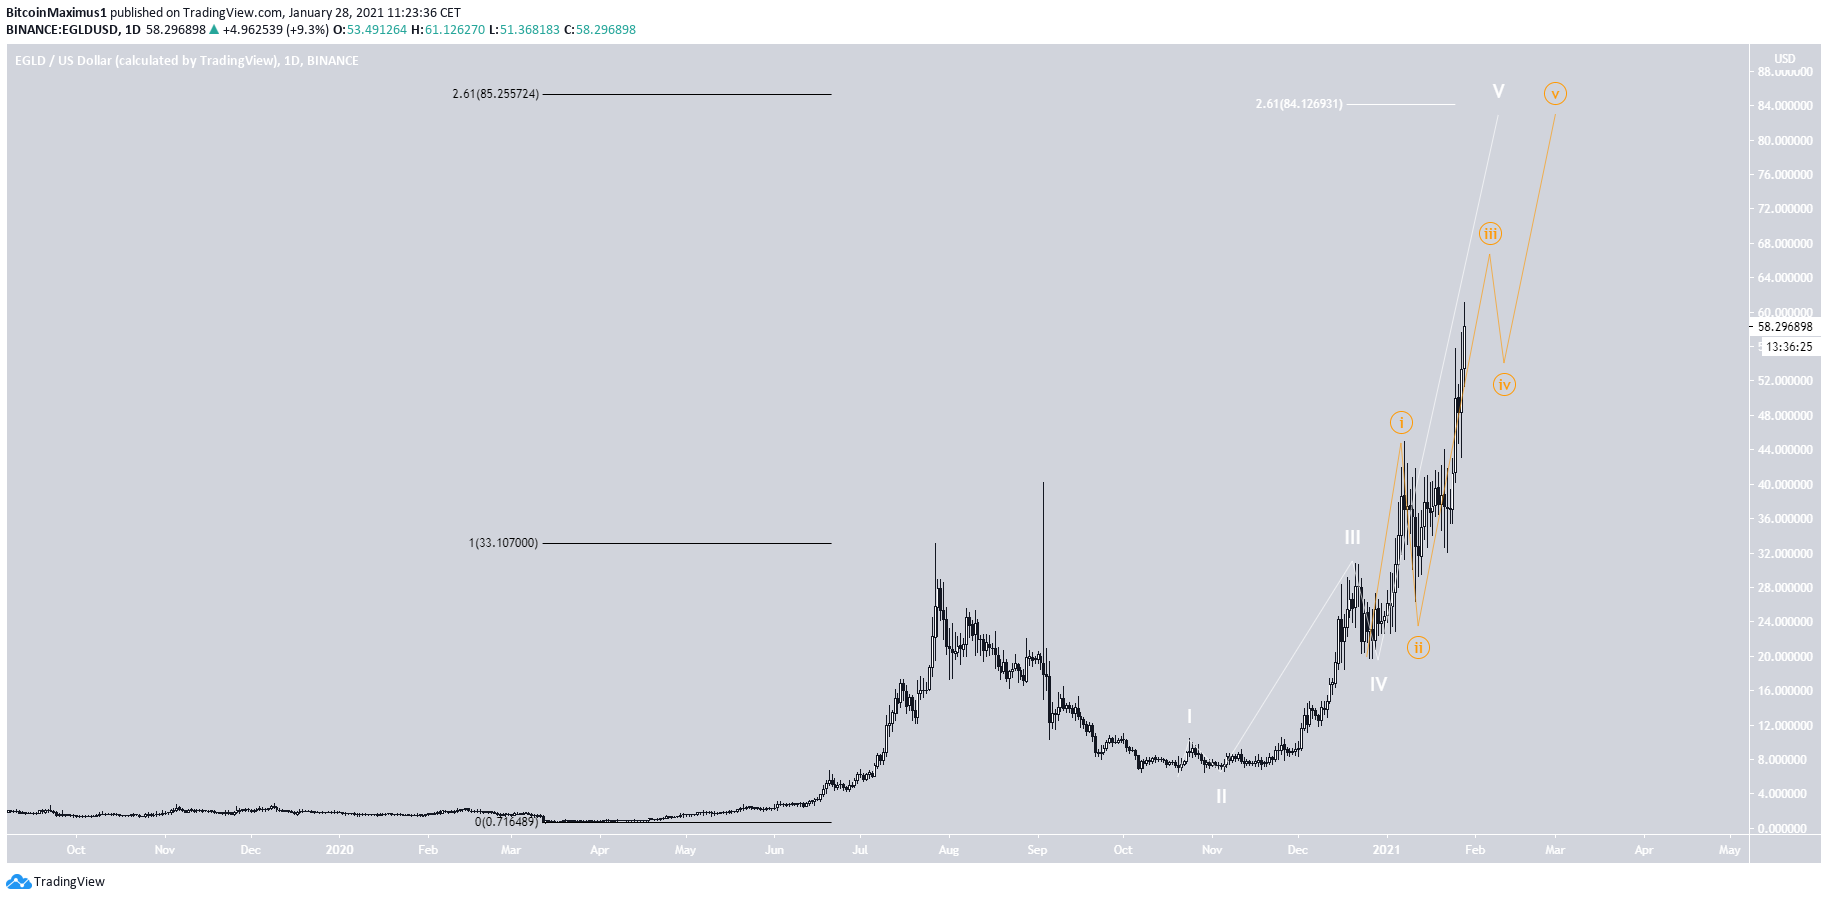
Possible Top
Since EGLD is trading at an all-time high, we need to use Fib extensions in order to predict the next possible top.
Doing so gives us a target between $84-$85, found by using the 2.61 Fib extension and the 2.61 Fib projection.
Furthermore, it seems that EGLD is in an extended fifth wave (shown in white below). Therefore, after the top is reached, a significant correction would be expected.
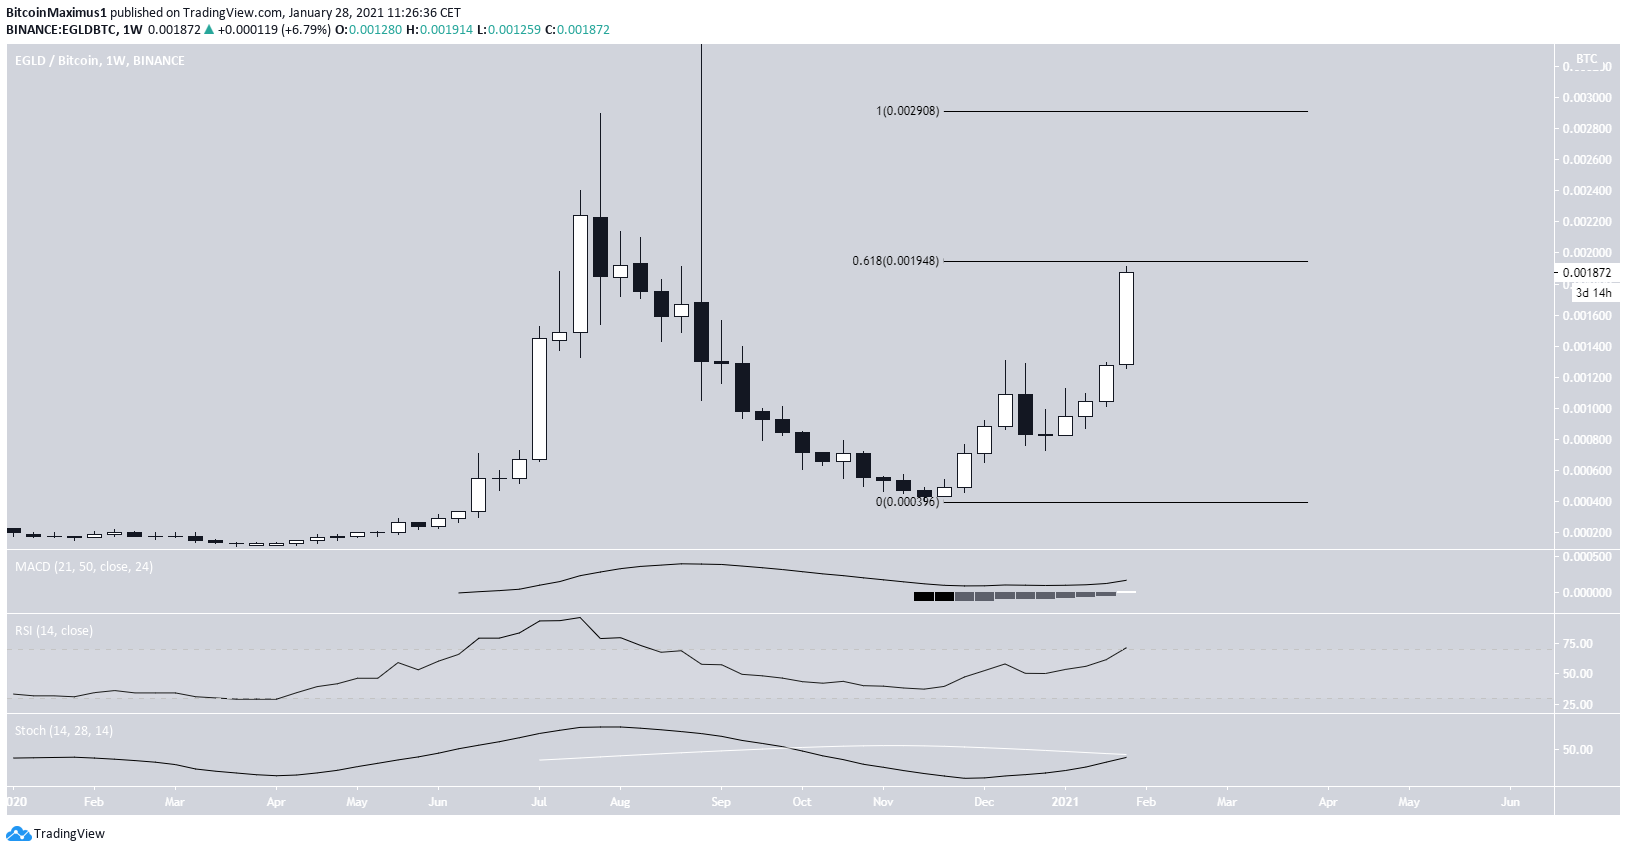
EGLD/BTC
The EGLD/BTC chart shows a massive upward move that has been transpiring throughout the week.
While technical indicators are looking strong, EGLD has to clear the 0.0618 Fib retracement level at ₿0.00194 in order for the trend to be considered bullish.
Nevertheless, while a short-term retracement could occur, it does seem like the long-term trend is bullish.
Conclusion
Both the EGLD/USD and EGLD/BTC pairs are in bullish long-term trends.
While EGLD/USD is expected to reach a high around $84-$85, EGLD/BTC is expected to reach a new all-time high after a potential short-term drop.
For BeInCrypto’s latest Bitcoin (BTC) analysis click here
Disclaimer
In line with the Trust Project guidelines, this price analysis article is for informational purposes only and should not be considered financial or investment advice. BeInCrypto is committed to accurate, unbiased reporting, but market conditions are subject to change without notice. Always conduct your own research and consult with a professional before making any financial decisions. Please note that our Terms and Conditions, Privacy Policy, and Disclaimers have been updated.
