


BeInCrypto takes a look at the movement for seven altcoins, including Elrond (EGLD), Holo (HOT), Axie Infinity (AXS) and OMG Network (OMG), which have reached or are very close to reaching new all-time highs.
BTC
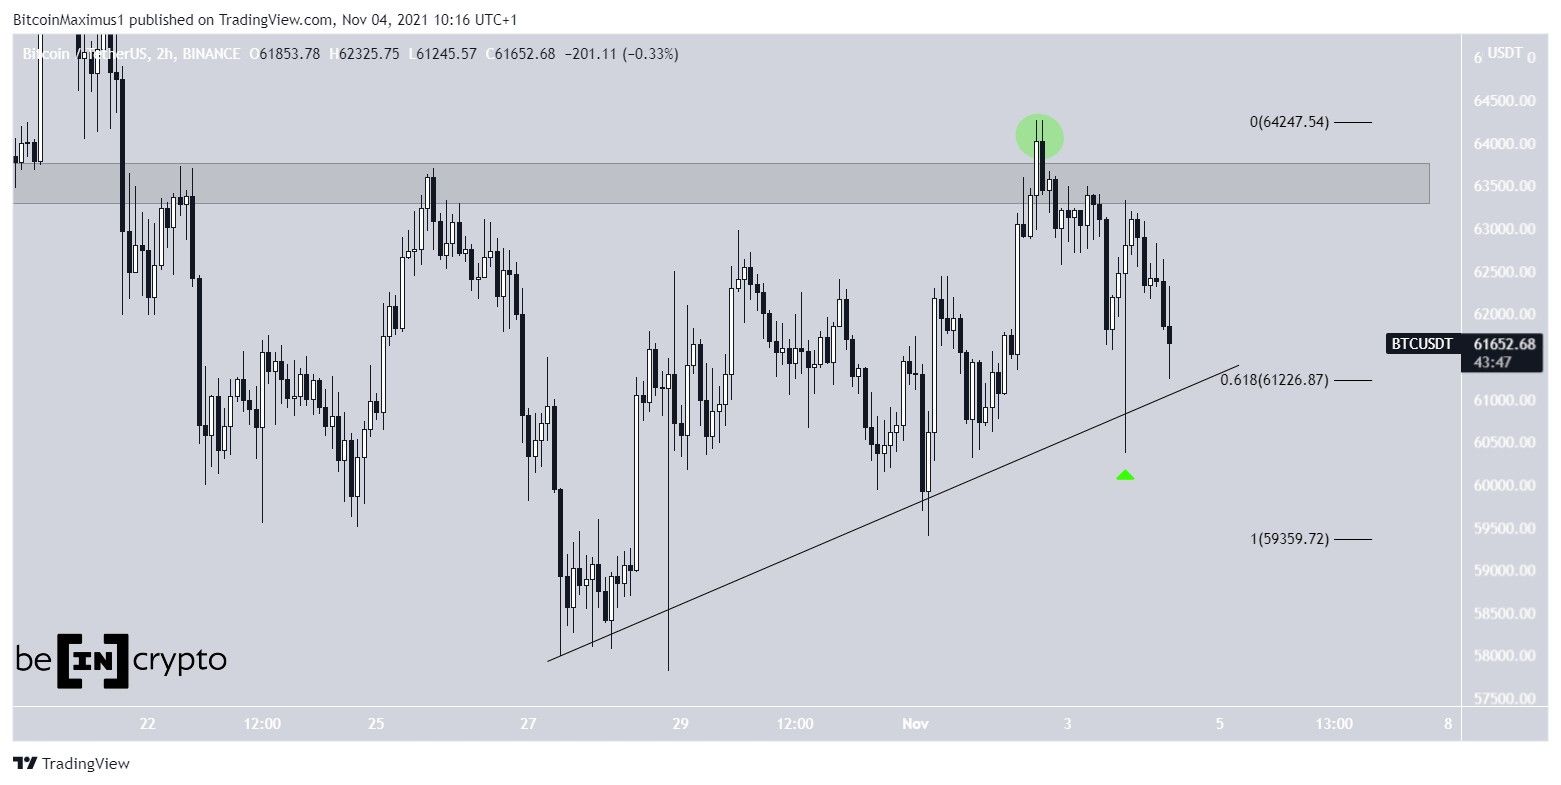
BTC has been increasing alongside an ascending support line since Oct 27. On Nov 3, BTC purportedly broke out above the $63,500 resistance area.
However, that proved to be only a deviation, since BTC fell below the area shortly afterwards.
However, it bounced at the ascending support line and the 0.618 Fib retracement level shortly afterwards, creating a long lower wick, which is a sign of buying pressure.
As long as the ascending support line is intact, so is the bullish structure.
ETH
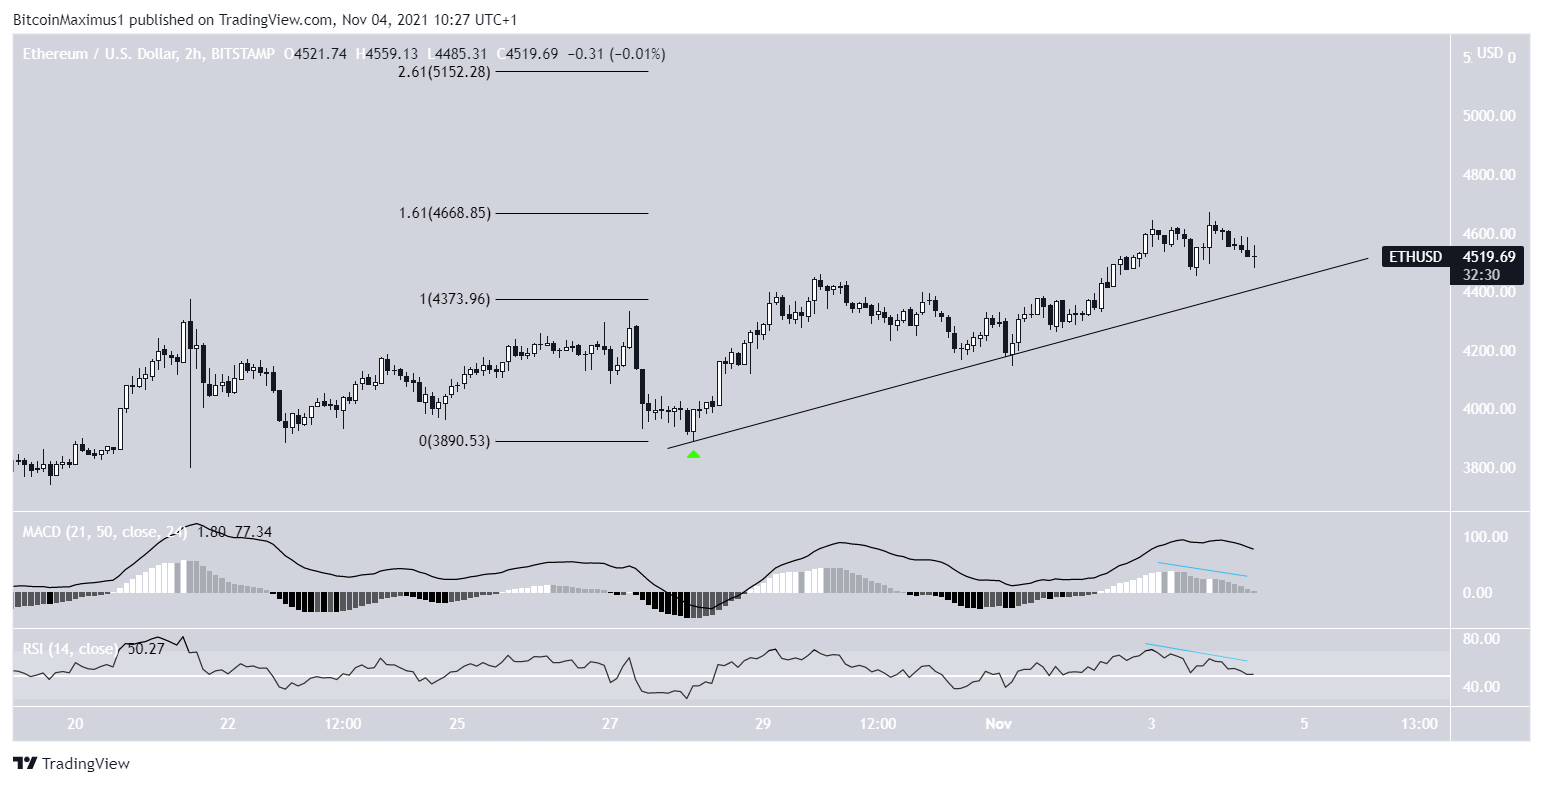
Similarly to BTC, ETH is also following an ascending support line, albeit much steeper in slope. On Nov 3, the token reached a high of $4,668. However, it fell shortly afterwards, once the RSI and MACD generated bearish divergences.
This means that the upward movement in price was not accompanied by a similar increase in momentum.
Whether the ascending support line holds will determine the direction of the trend.
If it does, the next resistance is at $5,152.
XRP
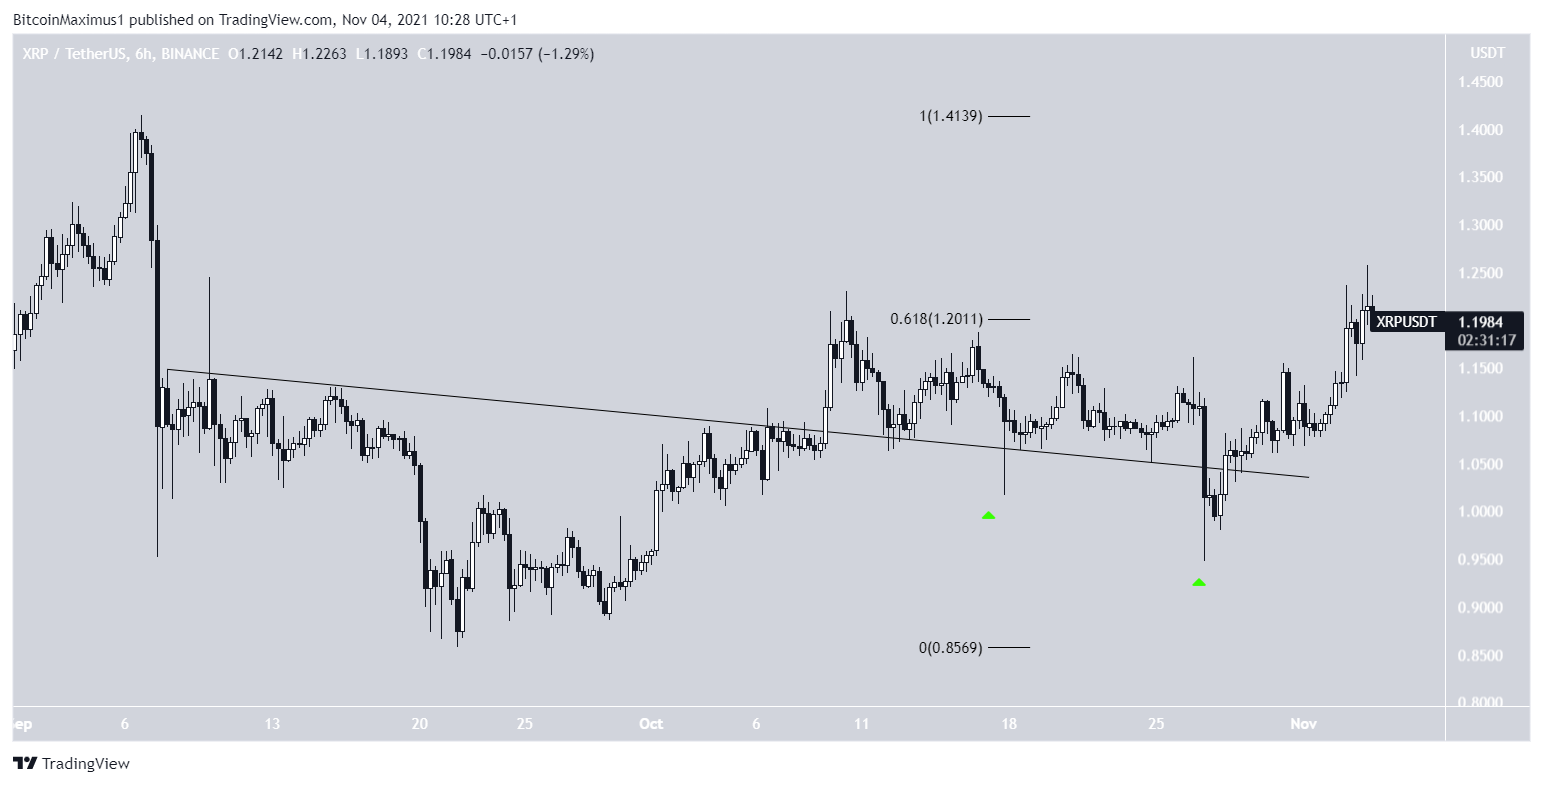
XRP (XRP) has been decreasing since it was rejected by the $1.20 resistance area on Oct 10.
However, it twice bounced at the previous descending resistance line (green icons), creating long lower wicks, which are considered signs of buying pressure.
Currently, it is in the process of making another breakout attempt. If successful, it would likely increase towards $1.40.
AXS
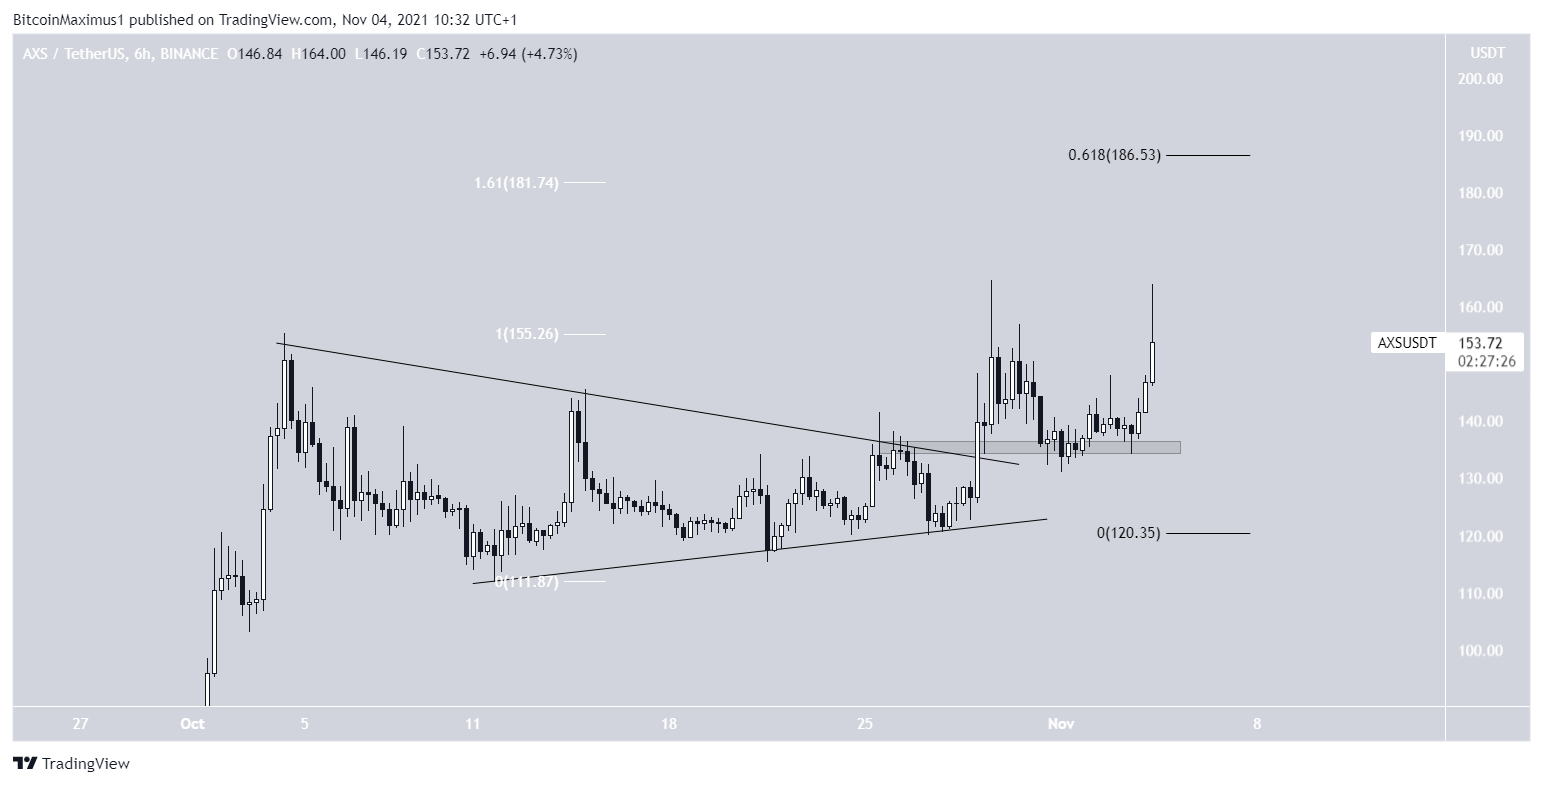
AXS has been increasing since Oct 29, when it broke out from a symmetrical triangle. It reached an all-time high of $164.58 the next day.
While it fell afterwards, it also bounced at the $135 horizontal support area and began another upward movement. On Nov 4, it reached a high of $164.
The next resistance is between $181-$186. It is found using an external Fib retracement on the most recent portion of the upward movement (white) and projecting the previous upward movement (black).
EGLD
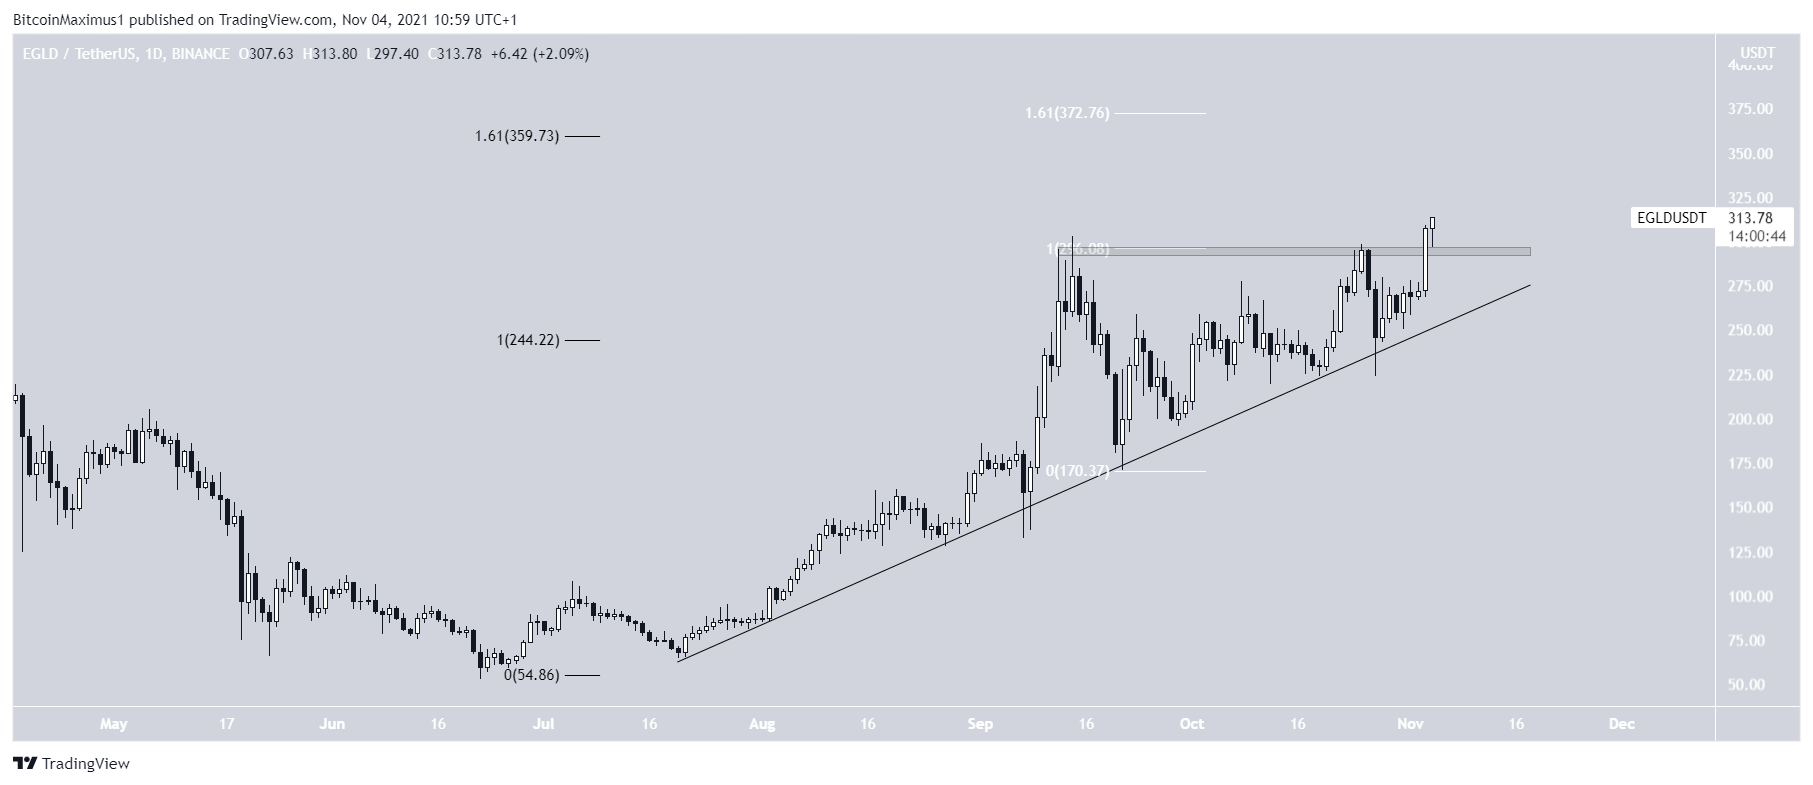
EGLD has been increasing alongside an ascending support line since July 20.
On Sept 14, it reached a then all-time high price of $303.03.
Afterwards, it returned to the support line once more. The ensuing bounce strengthened the validity of the line.
After a period of consolidation, EGLD managed to break out once more on Nov 3. The next day, it reached a new all-time high price of $317.8.
The next closest resistance area is between $359 and $372. It is found using an external retracement on both the long-term (black) and short-term (white) drops.
OMG
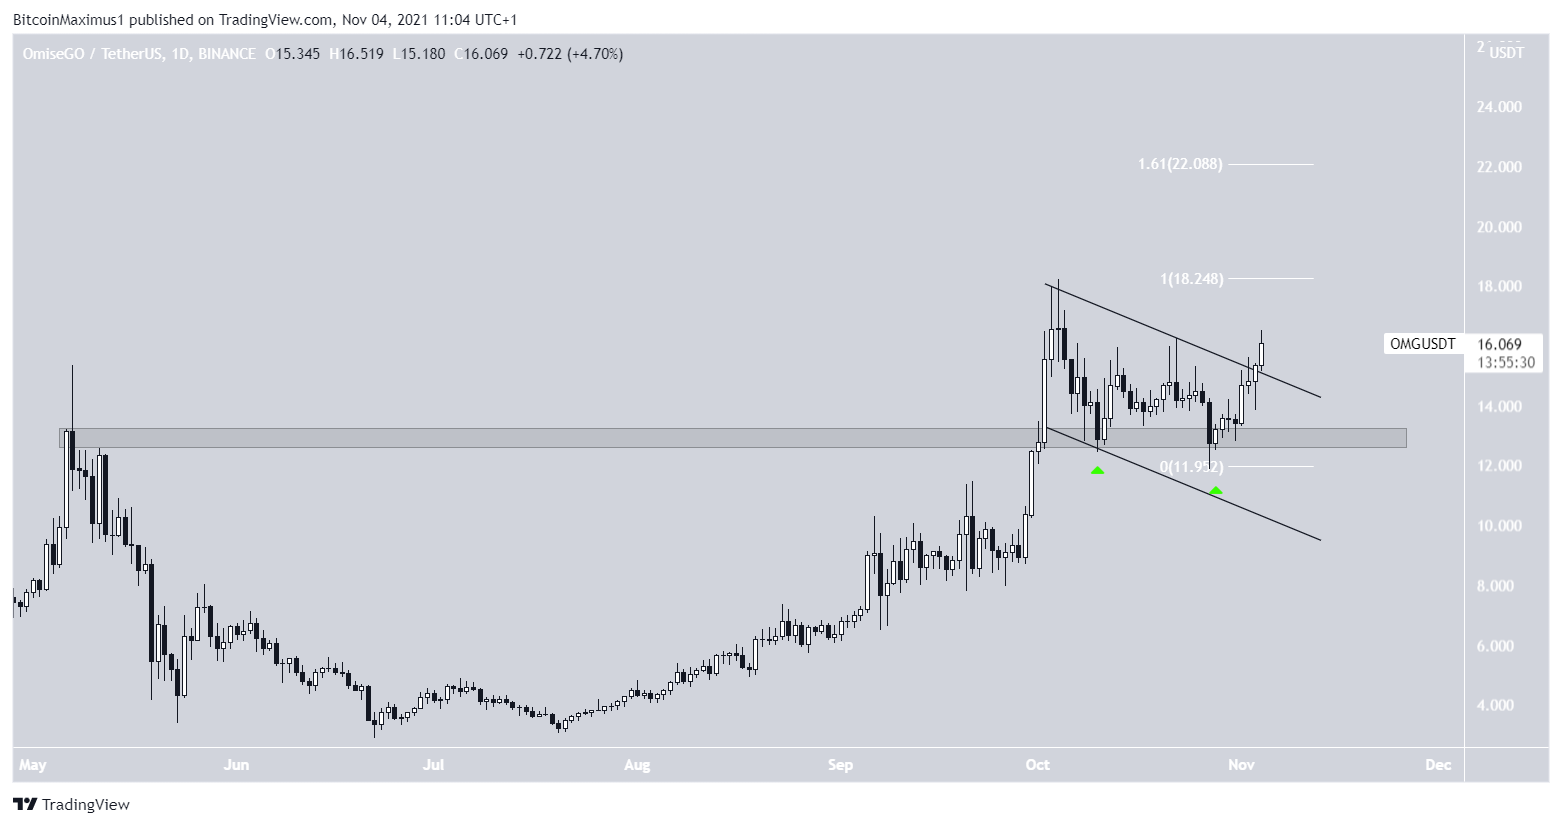
On Oct 10 and 27, OMG bounced at the previous all-time high region of $13 (green icons). This was a bullish development, since it validated the area as support.
Afterwards, it began an upward movement and broke out from a descending parallel channel on Nov 4. This indicated that the correction is complete.
OMG is now approaching its all-time high of $18.25. If successful in moving above it, the next resistance would be at $22.
The token could be in the initial stages of a long-term upward movement.
HOT
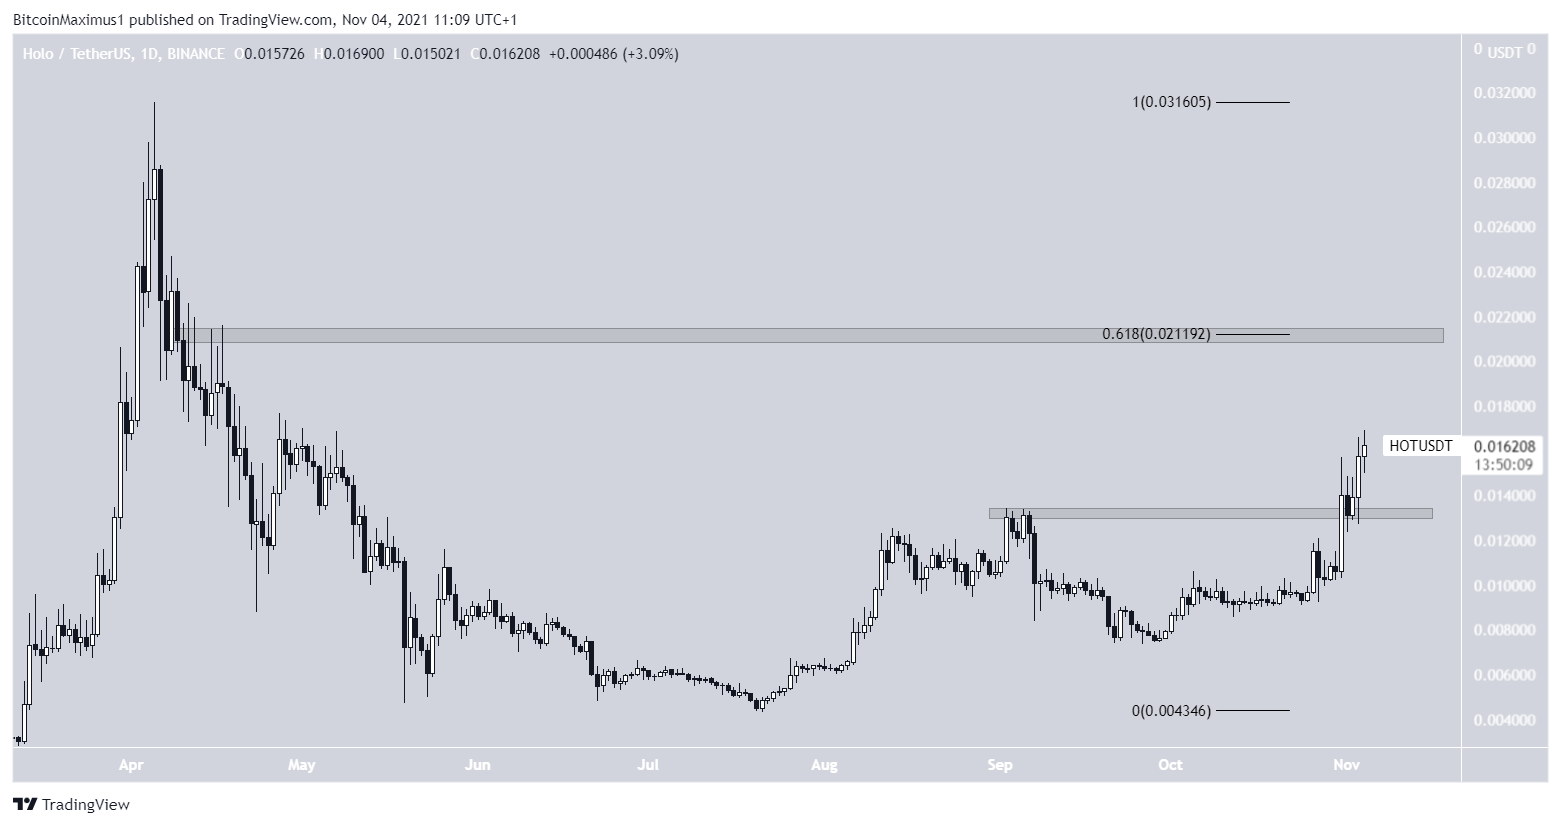
HOT has been moving upwards since Sept 28. On Oct 31, it broke out above the $0.134 horizontal resistance area, which had been in place since the beginning of Sept. This confirmed that the correction is complete.
Afterwards, it resumed its upward movement once it bounced at the same area three days later.
It is now approaching the $0.022 resistance area, which is the 0.618 Fib retracement resistance level. Reclaiming it would take the token to a new all-time high.
For BeInCrypto’s latest Bitcoin (BTC) analysis, click here.


