


Elrond (EGLD) has been increasing since Jan 22. It created a higher low on Feb 24 and accelerated its rate of increase afterward.
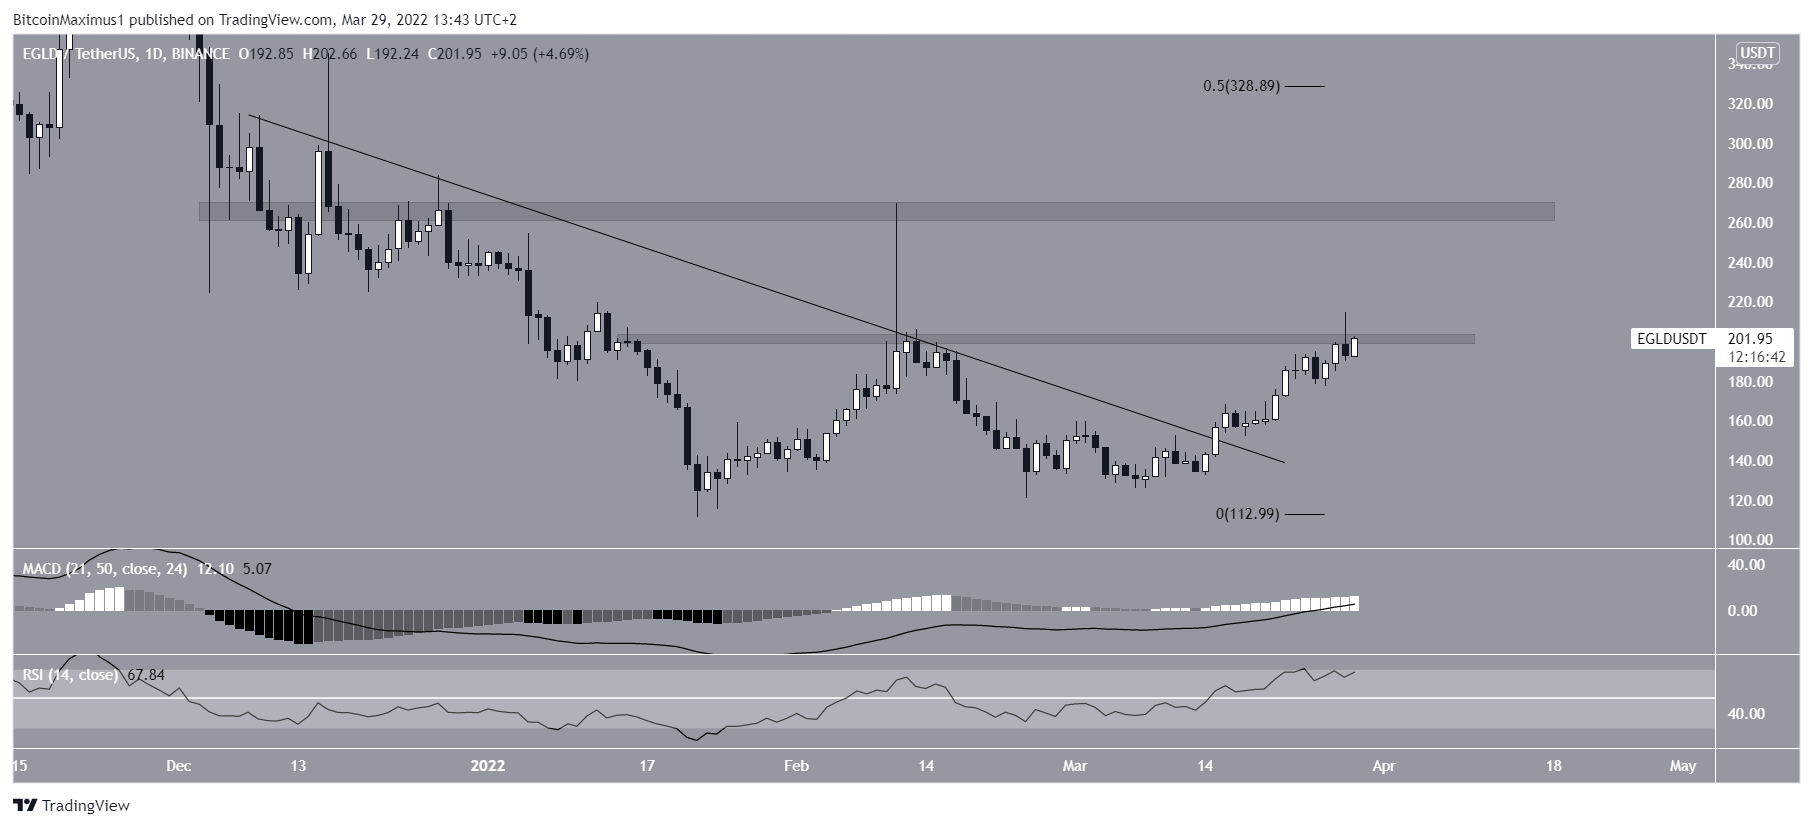
EGLD has been falling since reaching an all-time high price of $544.25 on Nov 23. The downward movement led to a low of $111.57 on Jan 22, 2022. The price has been moving upwards since.
On March 15, EGLD broke out (green circle) from a descending resistance line that has been in place since Dec 2021.
If the upward movement continues, the next closest resistances would be at $265 and $330. The first is a horizontal resistance area while the second is the 0.5 fib retracement resistance level.

Future movement
Cryptocurrency trader @CryptoNTez tweeted a chart of EGLD, stating that the price could increase all the way to $200.
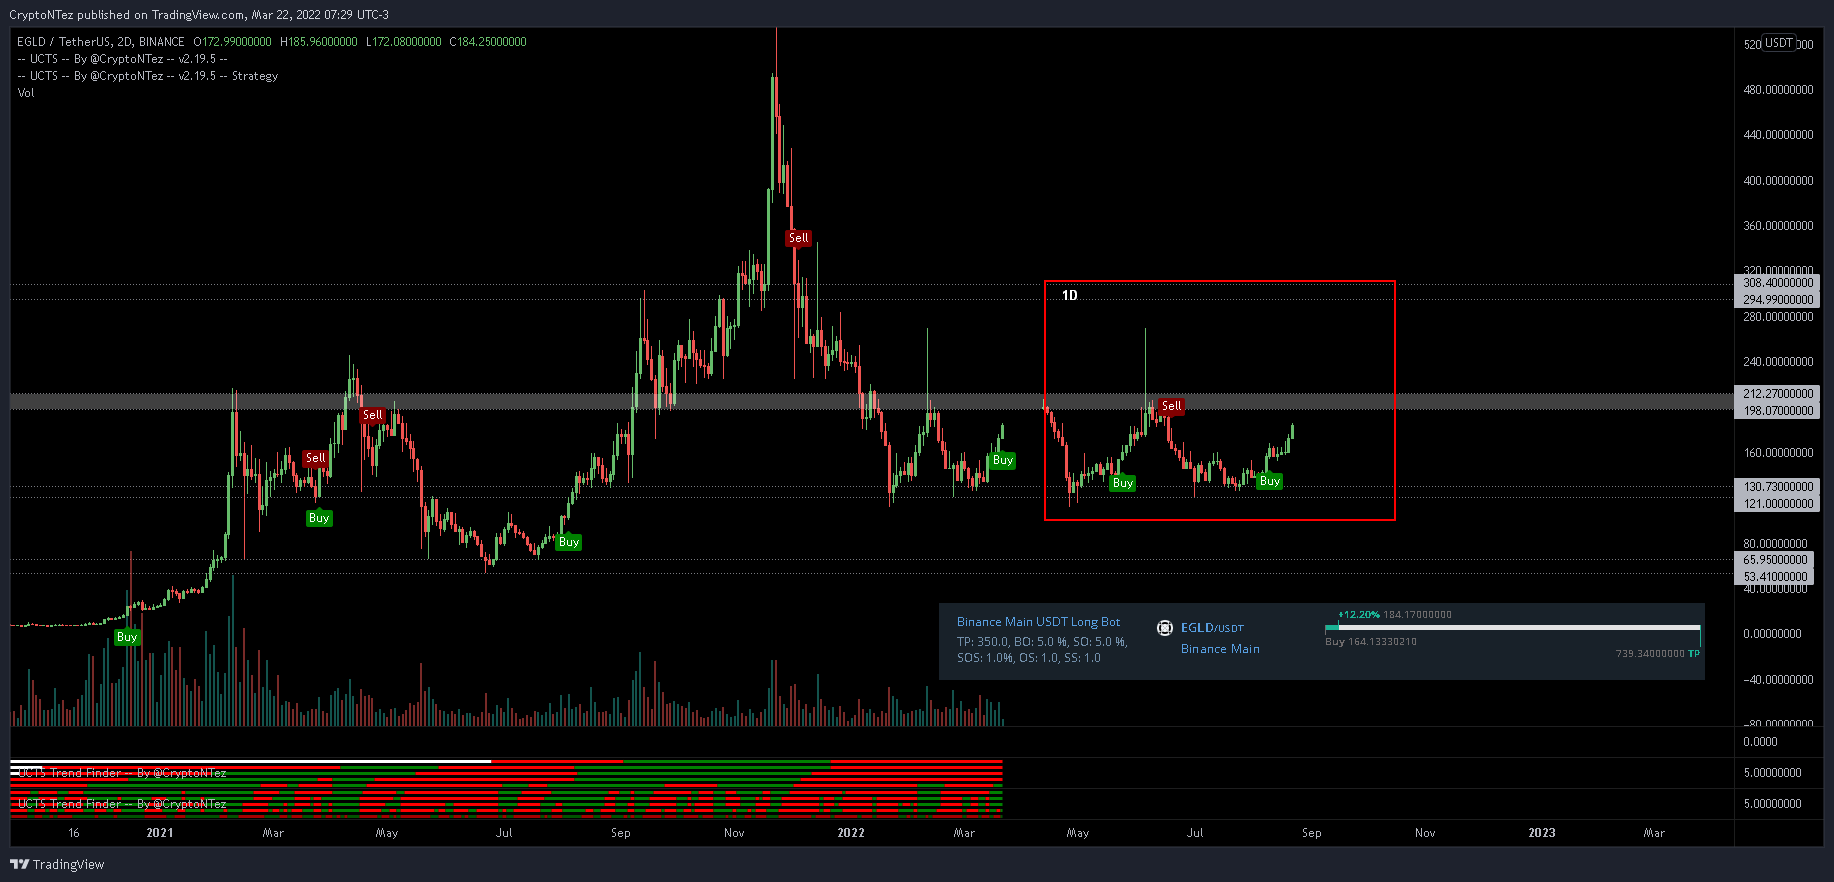
EGLD has continued its ascent and reached the target since the tweet.
The main reason for this is the increasing MACD and RSI. The former is now positive, while the latter has moved above 70. Both of these are considered signs of bullish trends.
It is trading at a minor resistance level at $205. However, technical indicators support the continuation of the upward movement and potential breakout.
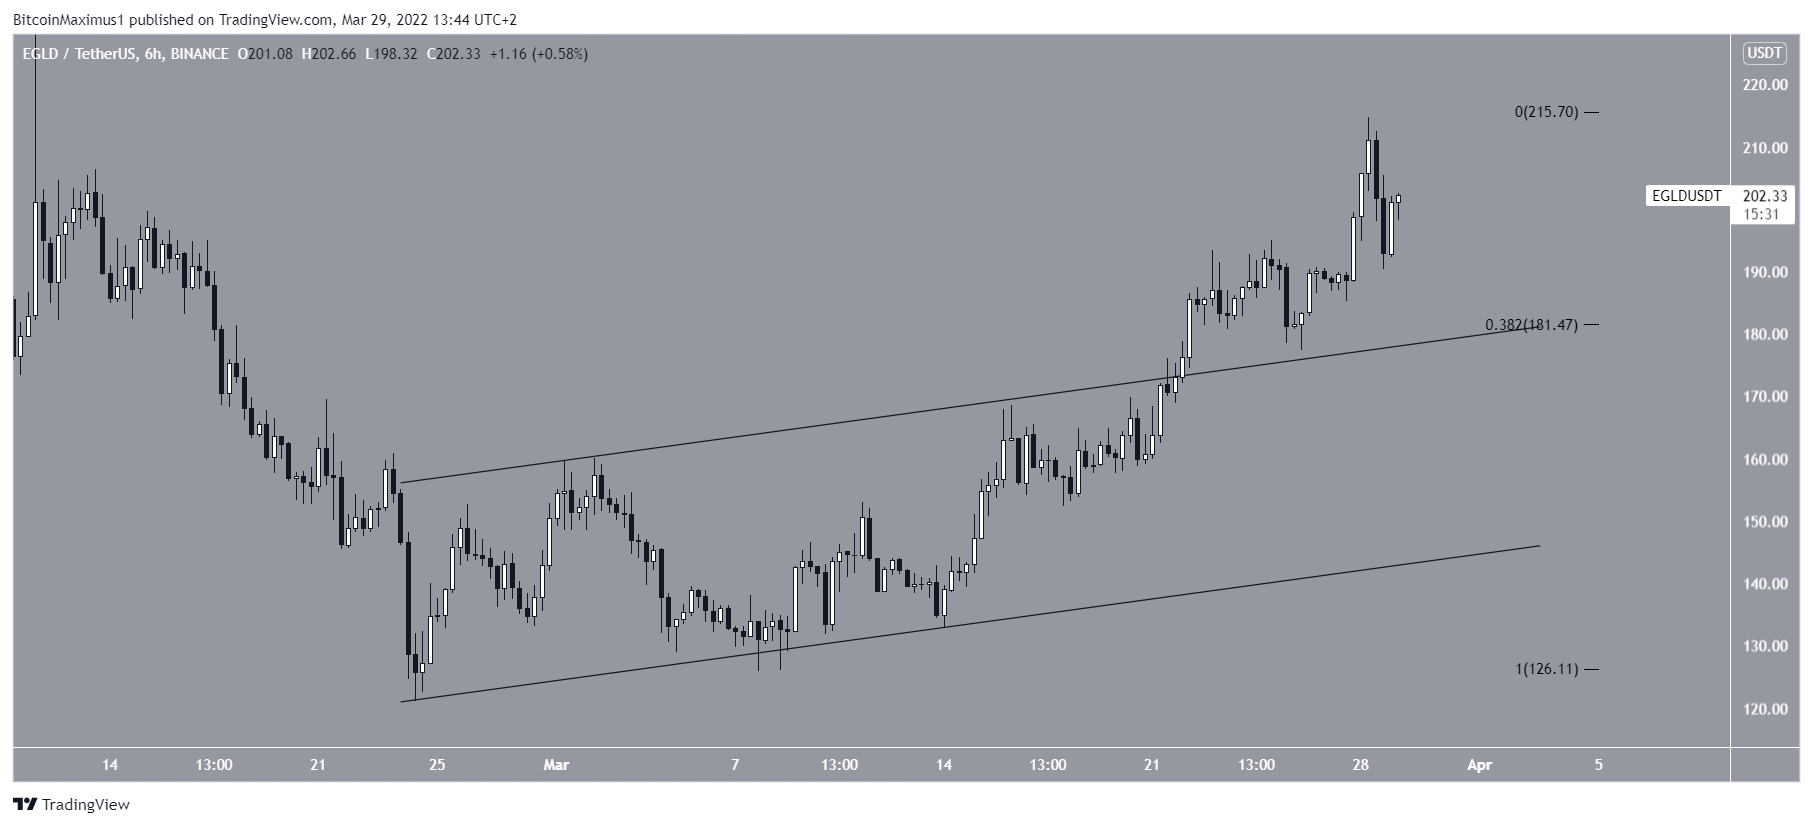
The six-hour chart also supports the continuation of the upward movement, since its shows that EGLD has broken out from an ascending parallel channel and validated it as support afterward.
Therefore, once it manages to clear the $205 level, the rate of increase would be expected to accelerate.
Wave count analysis
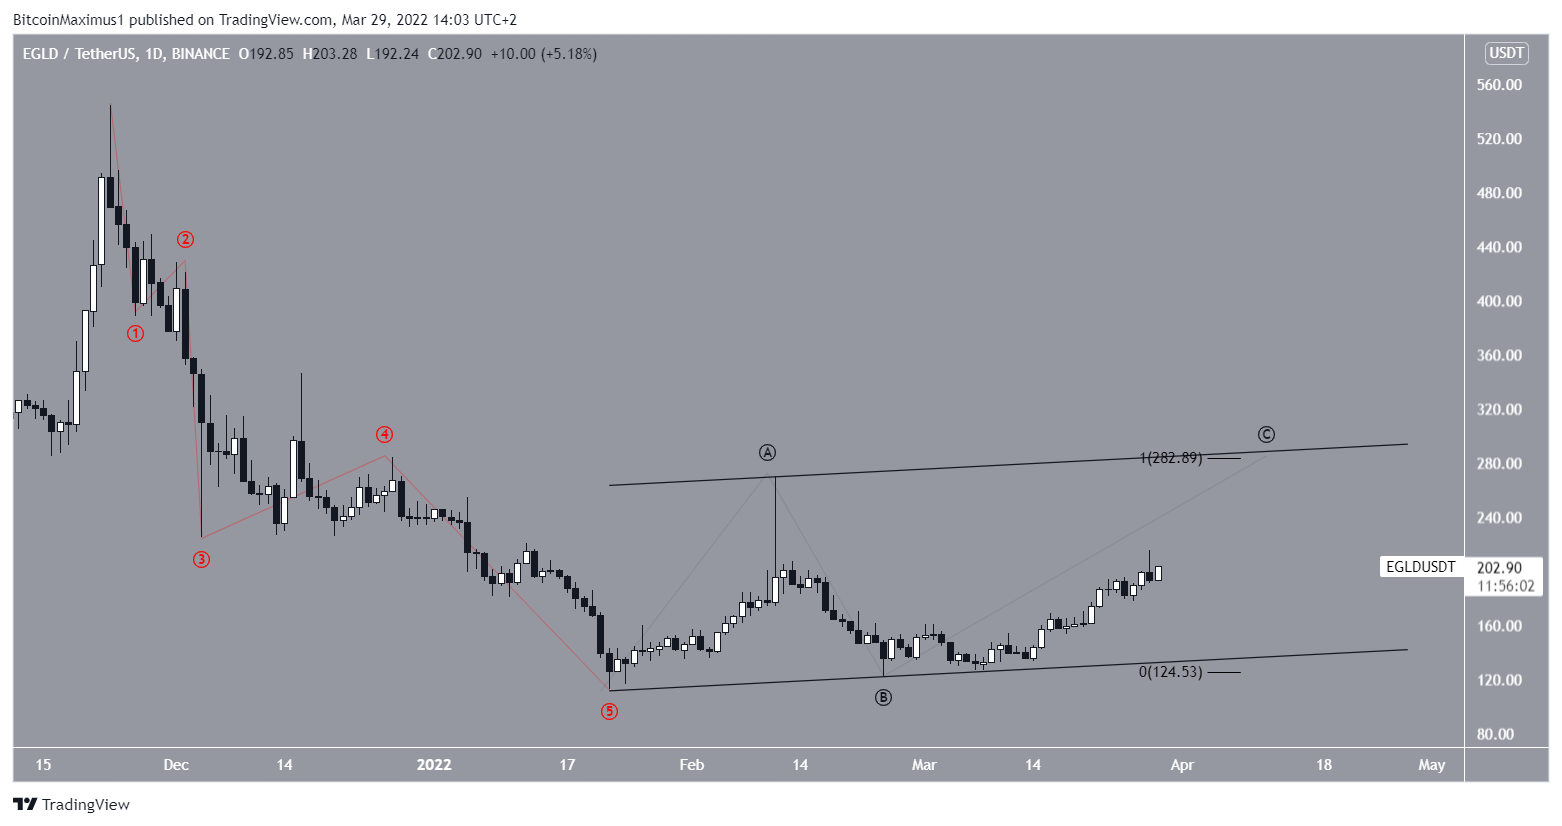
The decrease since the Nov 2021 all-time high looks like a five-wave downward movement (red). Therefore, what usually follows is an A-B-C retracement.
If so, EGLD is currently in wave C of this structure (black).
If correct, the first potential resistance level would be close to $280. This would fall close to the previously outlined resistance, give waves A:C a 1:1 ratio and reach the resistance line of the ascending channel.
For BeInCrypto’s latest Bitcoin (BTC) analysis, click here


