


Elrond (EGLD) completed its consolidation that has been ongoing for nearly two months with a sharp breakout on Nov. 3. It reached a new all-time high price two days later.
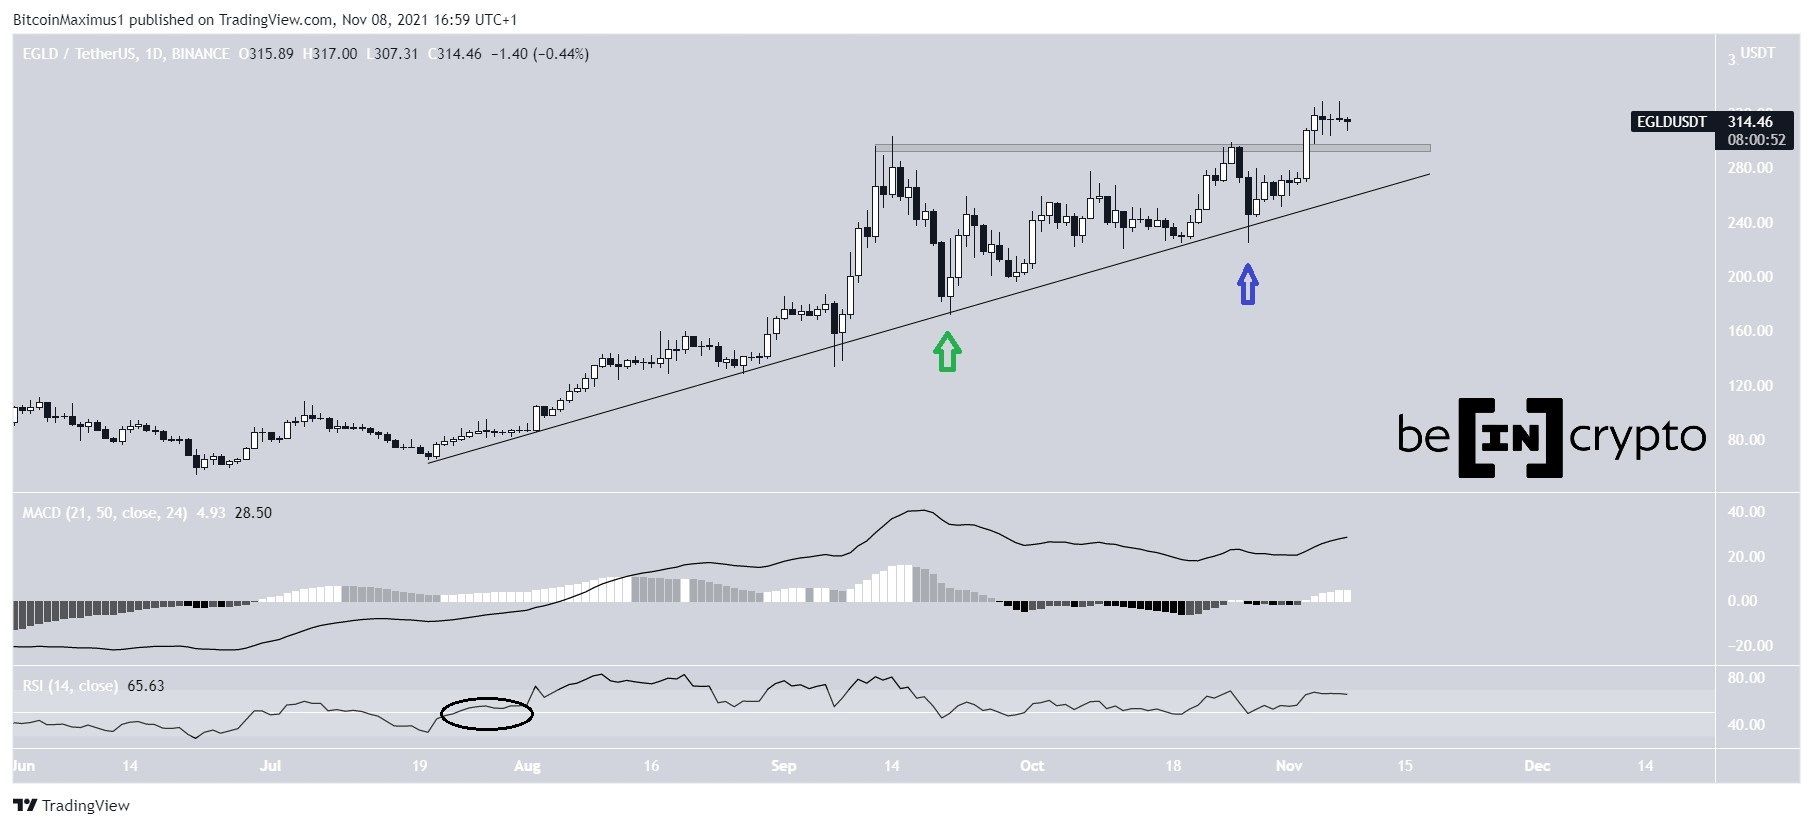
EGLD has been increasing alongside an ascending support line since July 20.
After reaching a new all-time high price of $303 on Sept 14, the token decreased considerably. However, it bounced at the support line once more (green arrow) and resumed its upward movement afterwards. The bounce served to validate the line once more and increase its significant in the process.
After a period of consolidation, which ended with another bounce (blue arrow), EGLD broke out and reached a new all-time high price of $329 on Nov 5.
Since EGLD broke out, the $295 area is now expected to act as support, since it previously acted as resistance.
Technical indicators in the daily time-frame support the continuation of the upward movement.
The MACD, which is created by a short- and a long-term moving average (MA), is moving upwards. This means that the short-term trend is increasing at a faster rate than the long-term one.
The RSI, which is a momentum indicator, is above 50. This is a sign of bullish momentum. The previous time this occurred (black circle), it preceded the entire upward movement to the then all-time high price.
Wave count
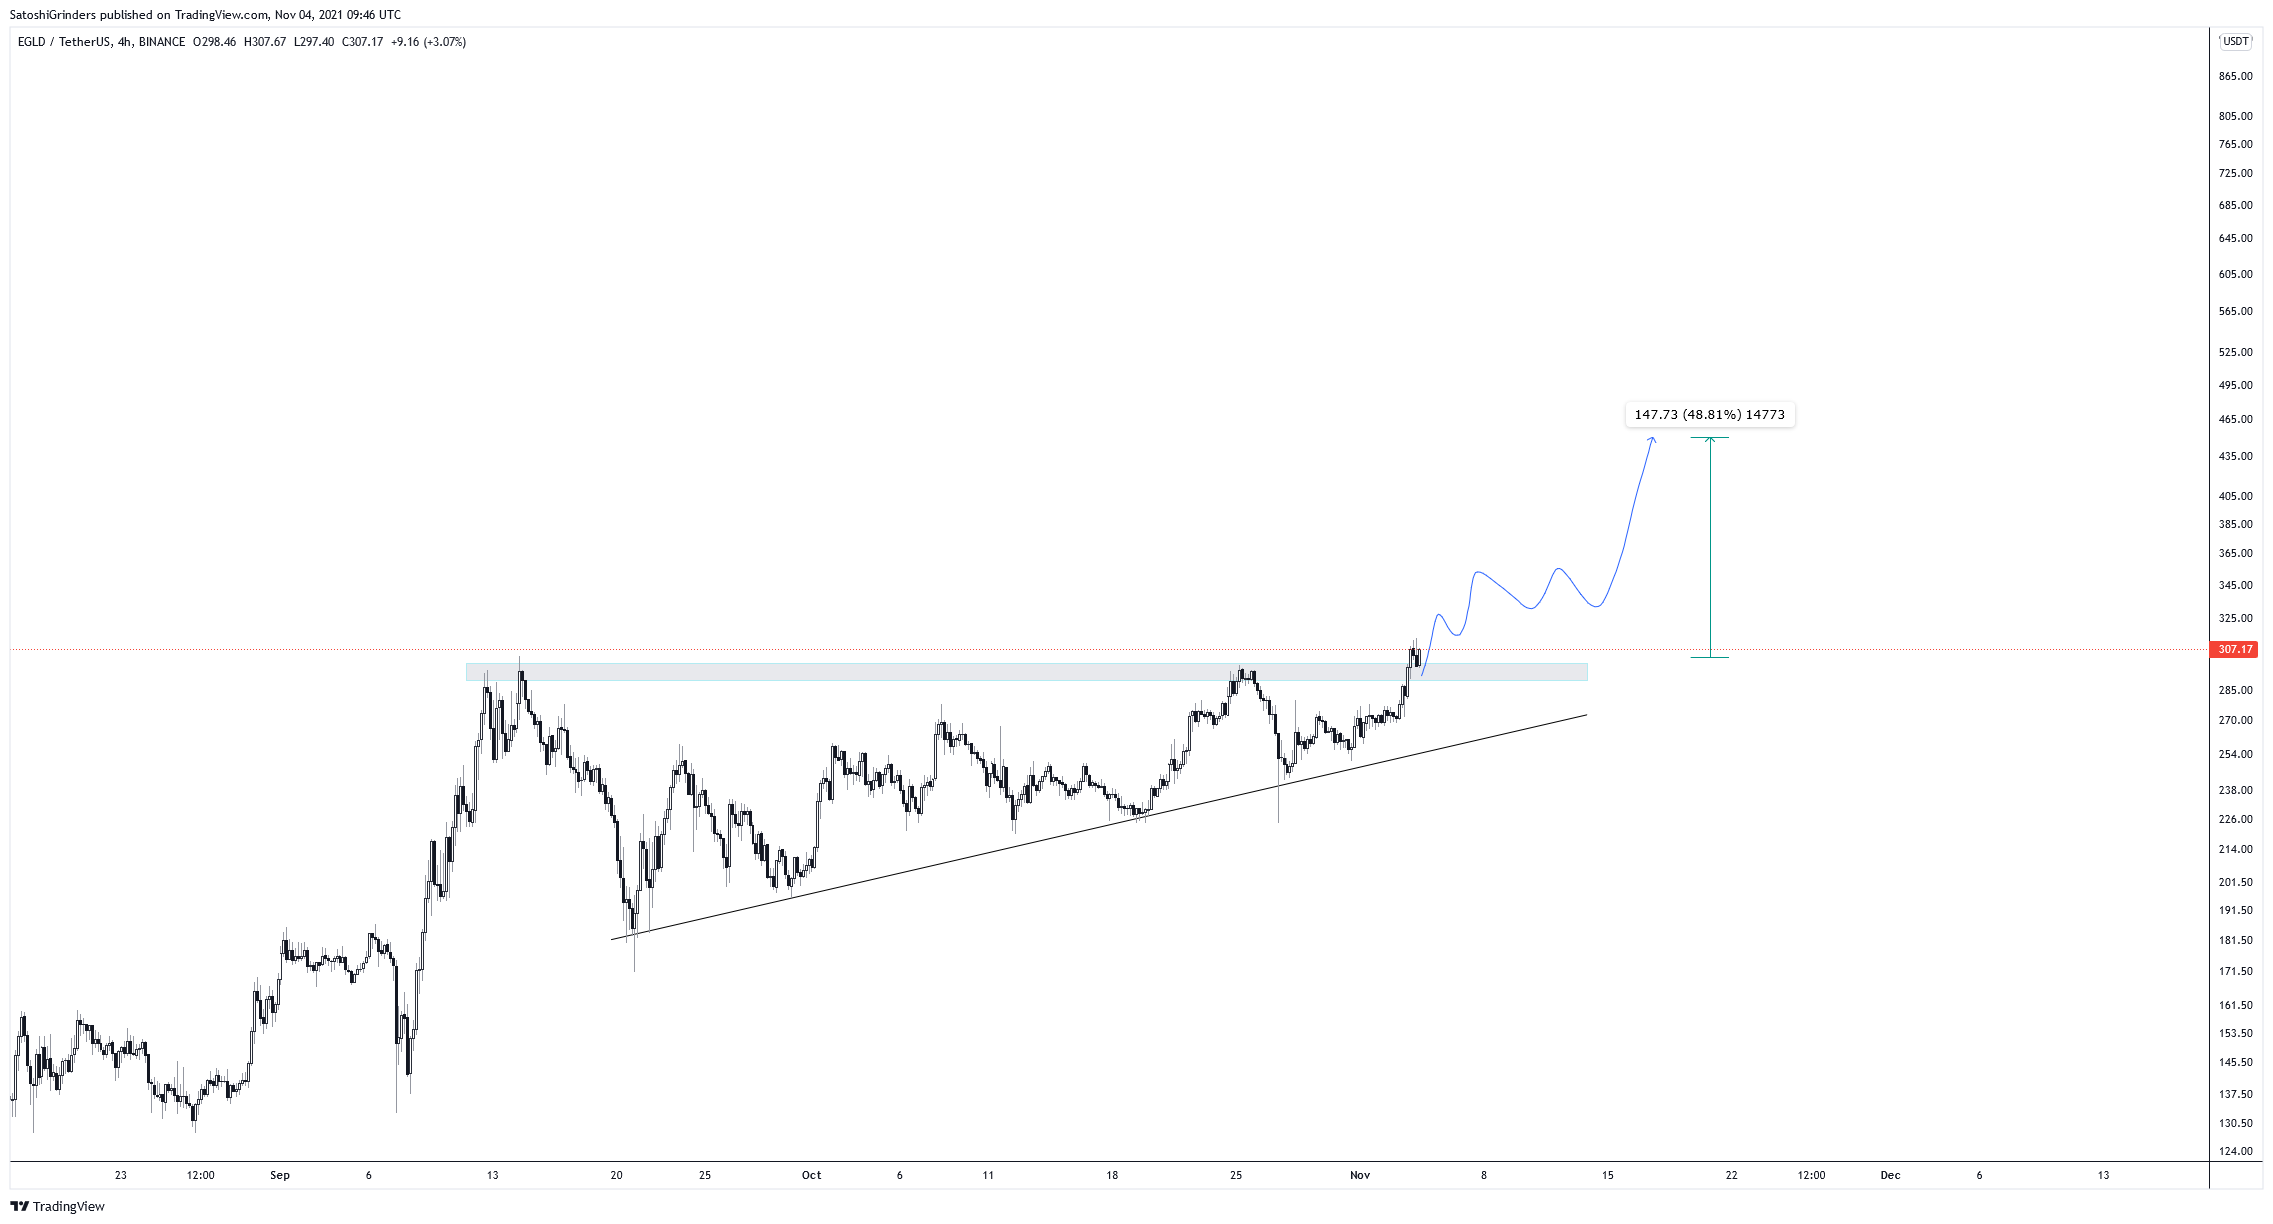
Cryptocurrency trader @Thebull_Crypto tweeted an EGLD chart that shows the ongoing breakout. He indicated that the token could increase by 50% or more.
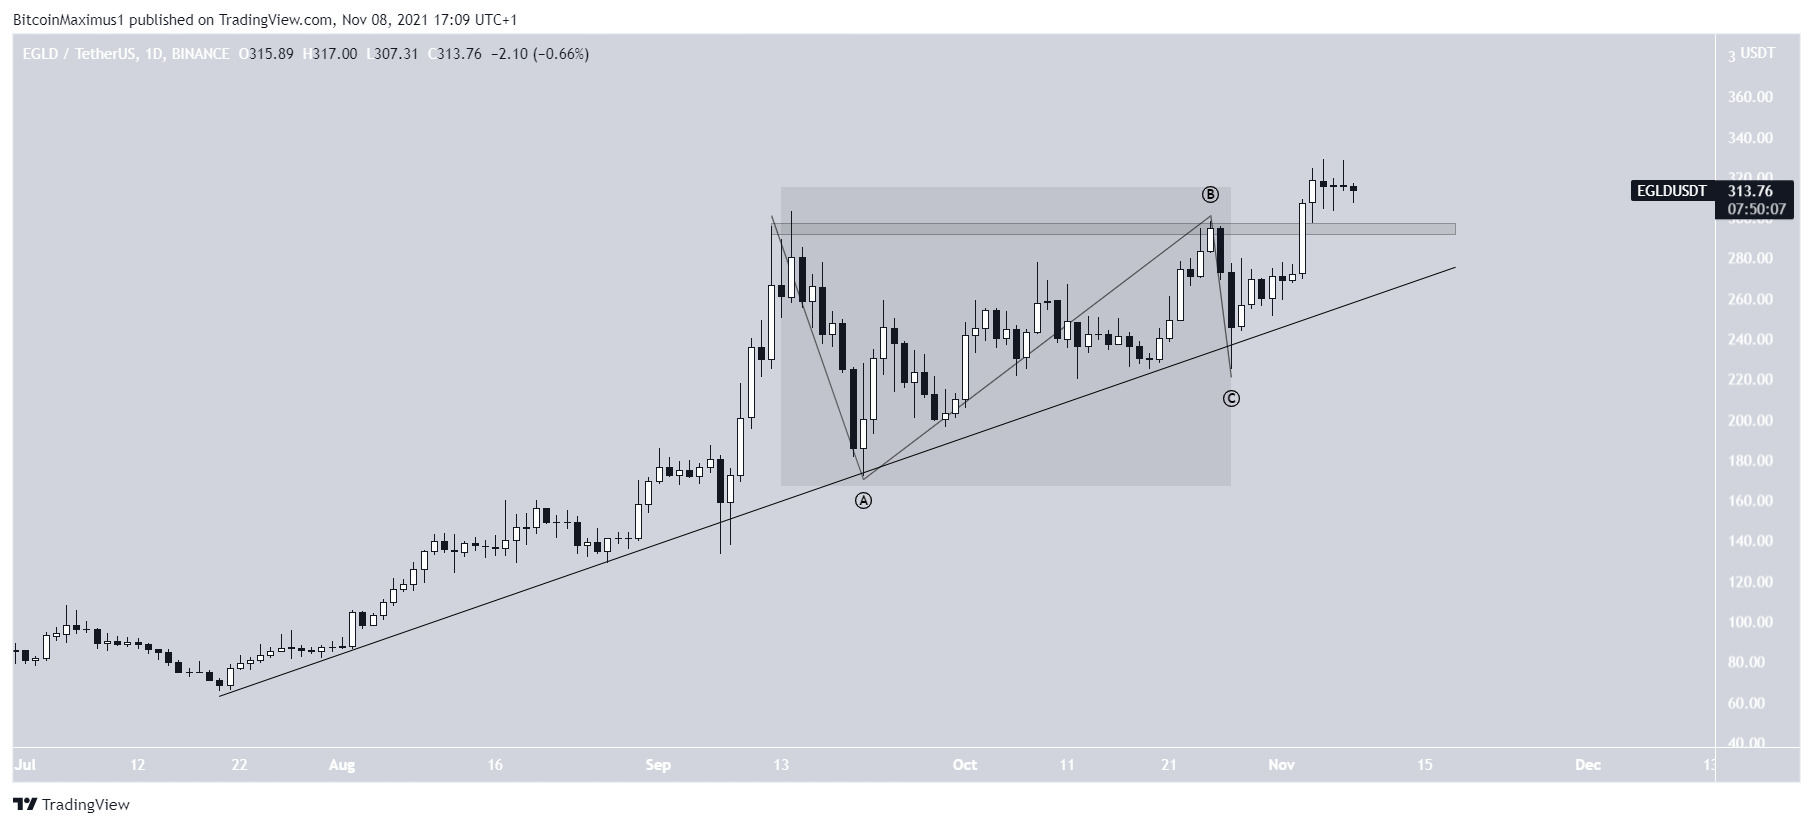
The wave count for EGLD also provides a bullish outlook. The period between Sept 4 and Oct 25 looks like a running flat correction.
This is due to the overlap in the price during the entire movement. A running flat correction is a type of bullish correction, in which the bottom of wave C fails to reach that of wave A. This is considered a sign of strength, since the price was unable to reach its prior lows. It is usually followed by a sharp upward movement.
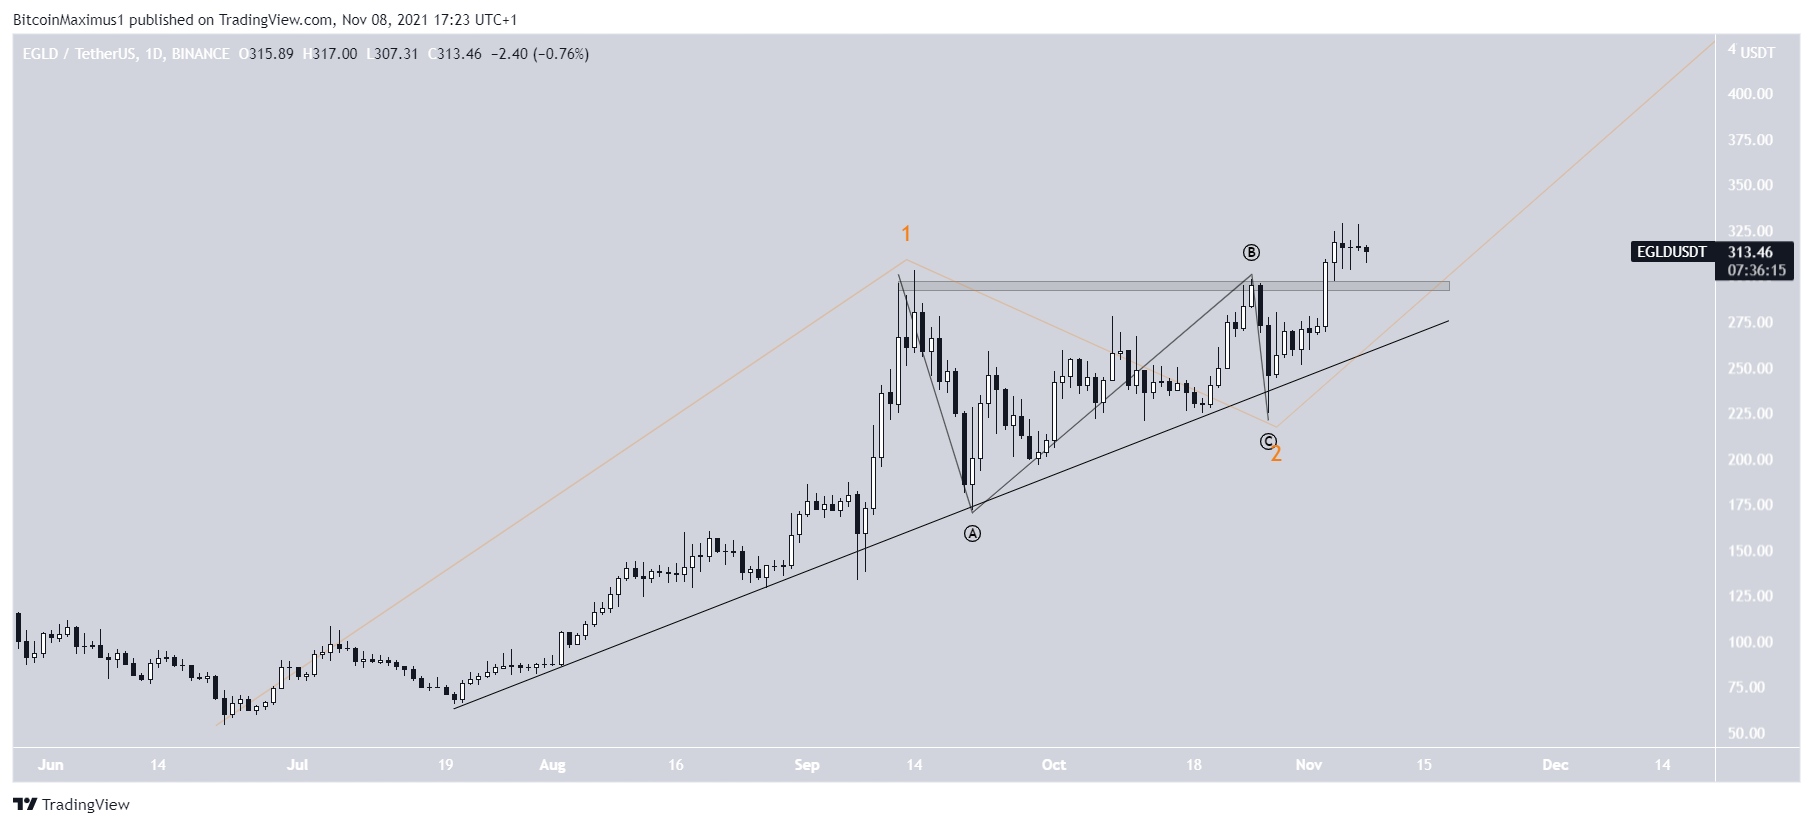
The longer-term wave count is not entirely clear. However, it is possible that the entire upward movement since July was part of wave one, with the outlined period being wave two (orange).
In this possibility, EGLD has just begun wave three, which is usually the sharpest and largest. Therefore, it would be expected to increase well into an all-time high and beyond.
Short-term movement
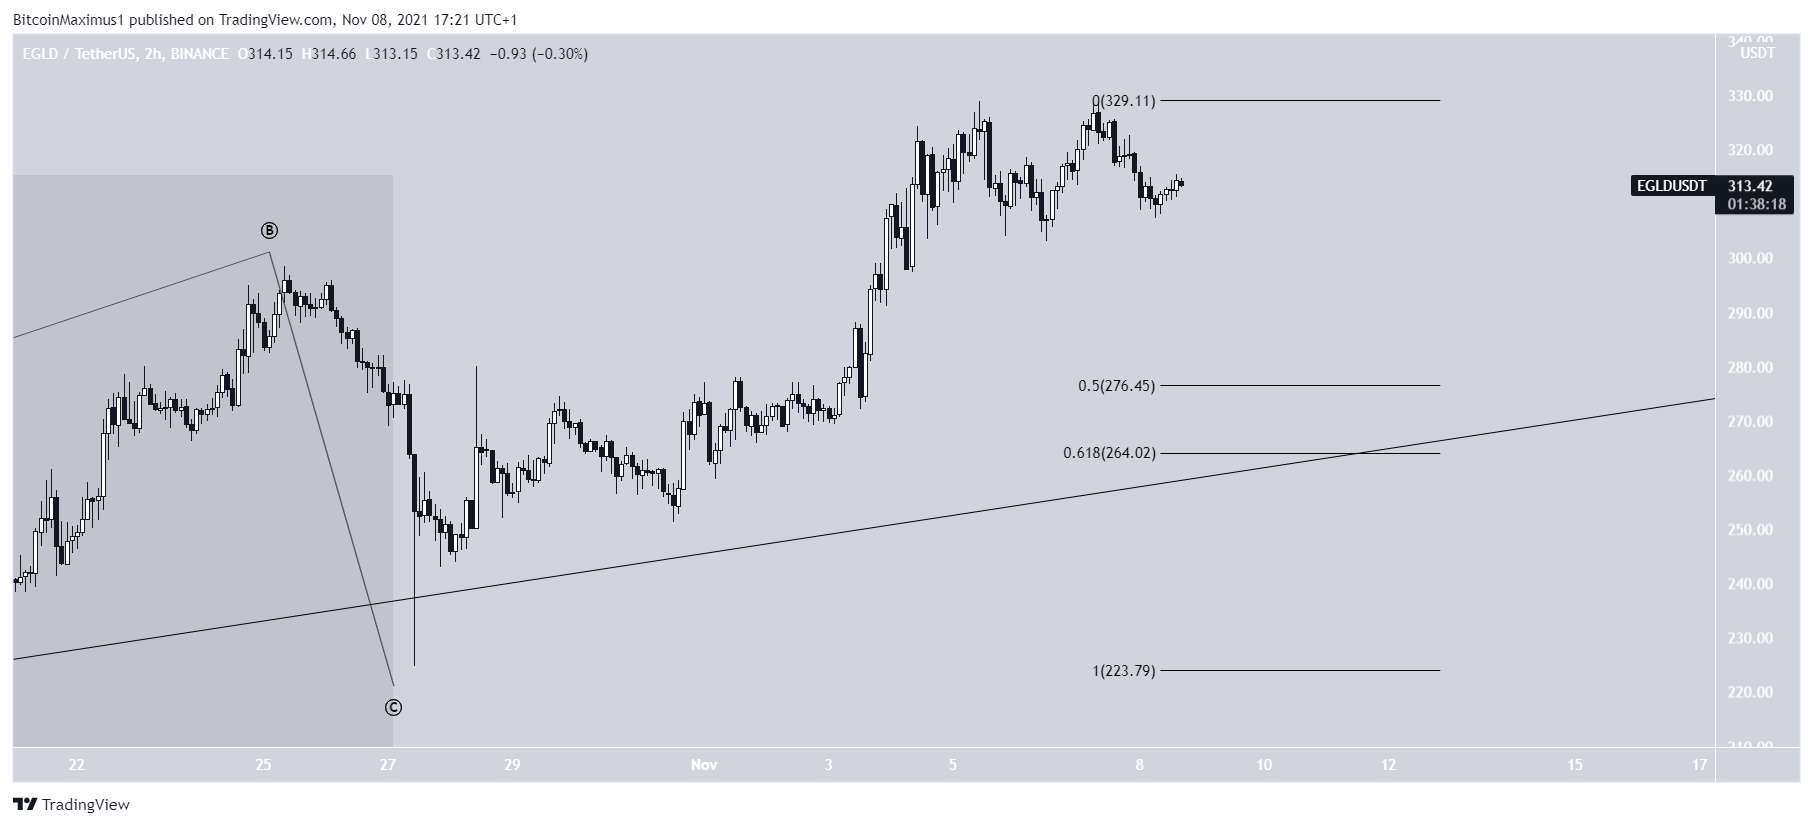
When measuring the short-term upward movement, the 0.5-0.618 Fib retracement support level is between $264-$276. It also coincides with the long-term ascending support line.
Therefore, it is likely that EGLD will bounce at the level and resume its upward movement.
For BeInCrypto’s latest Bitcoin (BTC) analysis, click here.
What do you think about this subject? Write to us and tell us!


