
Elrond (EGLD) has validated a long-term ascending support line that has been in place since November 2020.
Technical indicators support the continuation of the upward movement. An increase above $125 would confirm the bullish trend.
EGLD bounces at long-term support line
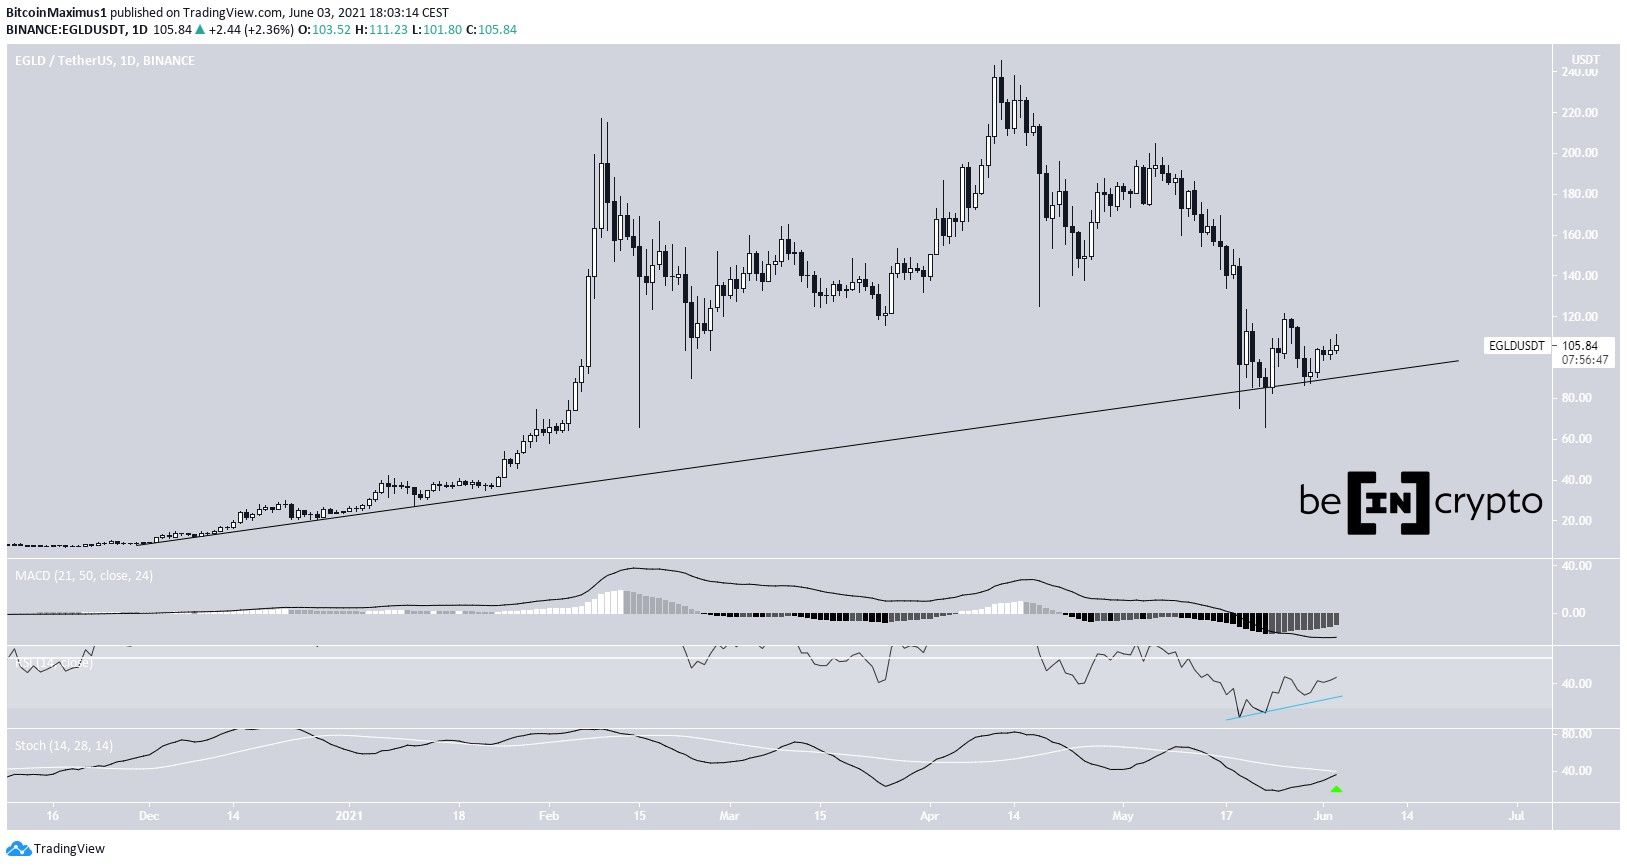
EGLD has been moving downwards since it reached an all-time high price of $245.8, on April 12. The decrease culminated with a low of $65.95, reached on May 23.
The decrease served to validate a long-term ascending support line. This is the sixth touch of this line, which has been in place since November 2020.
Technical indicators are giving bullish signs. The RSI has generated bullish divergence and the Stochastic oscillator has made a bullish cross. Furthermore, the MACD is moving upwards. As long as the line is in place, the trend can be considered bullish.
Future movement
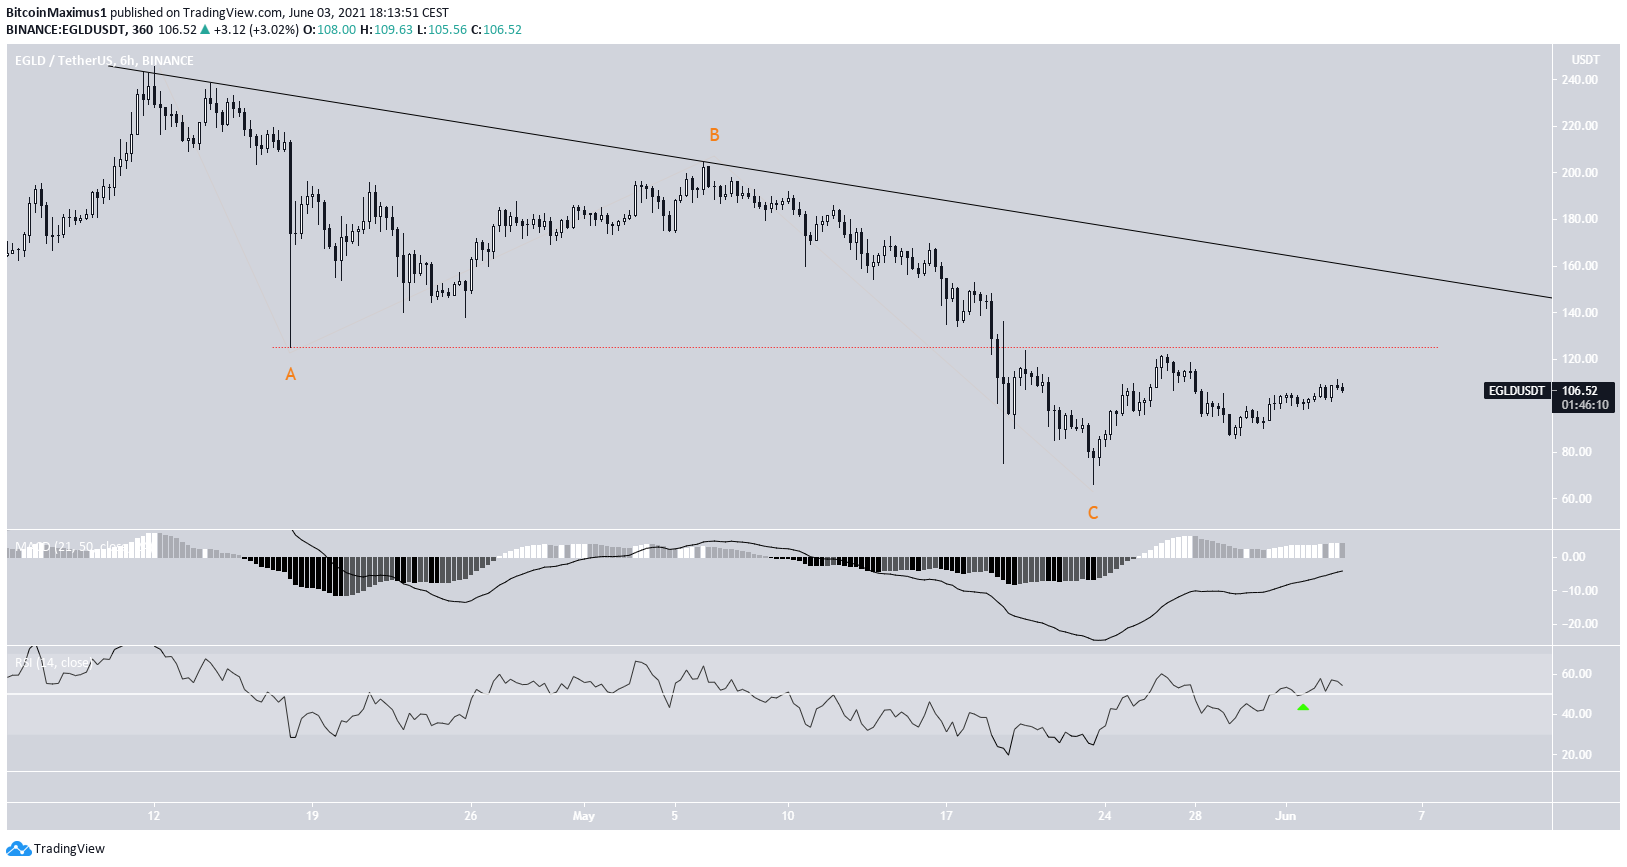
The shorter-term six-hour chart shows a descending resistance line in place, since the aforementioned all-time high price. Currently, it is near $155.
While the bounce and presence of the long-term support line are both bullish signs, the price movement has yet to confirm that the correction is complete. An increase above the $125 low (red line) would confirm that this was a completed A-B-C corrective structure, instead of it being a bearish impulse.
The short-term MACD and RSI support the creation of this upward movement, the latter having just crossed above 50.
EGLD/BTC
Cryptocurrency trader @CryptoNTez outlined an EGLD/BTC chart, stating that the token has bounced at support.
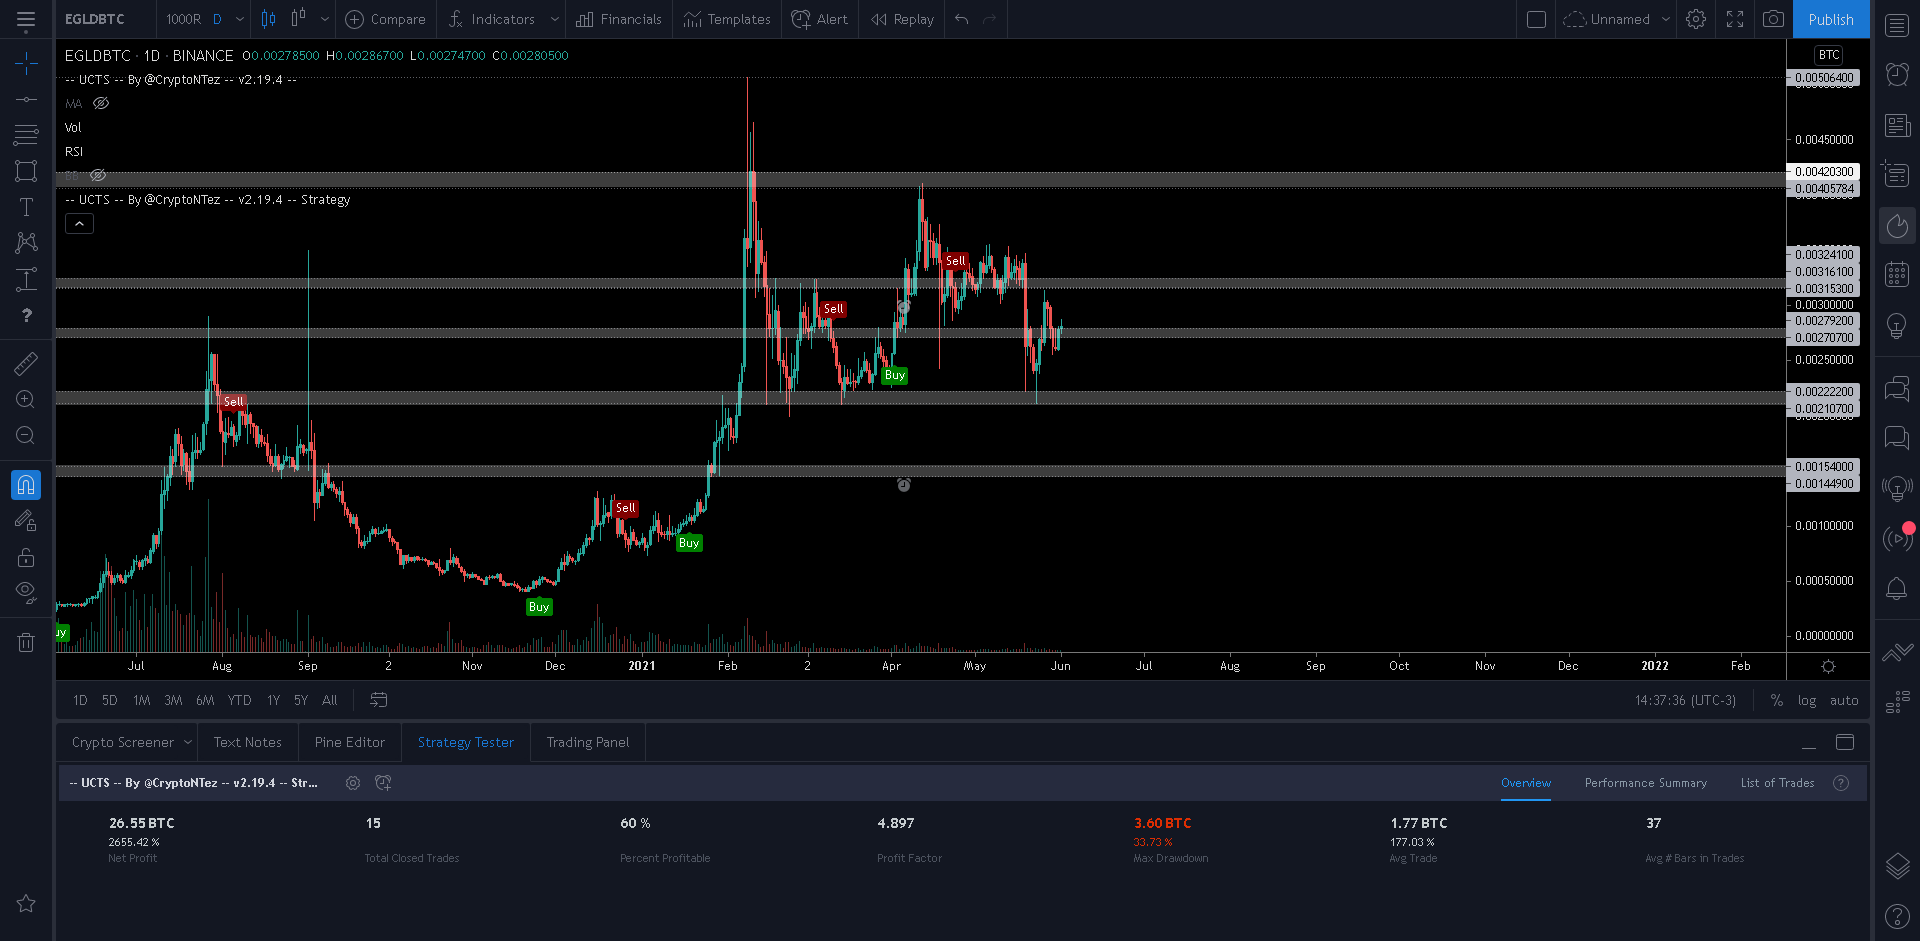
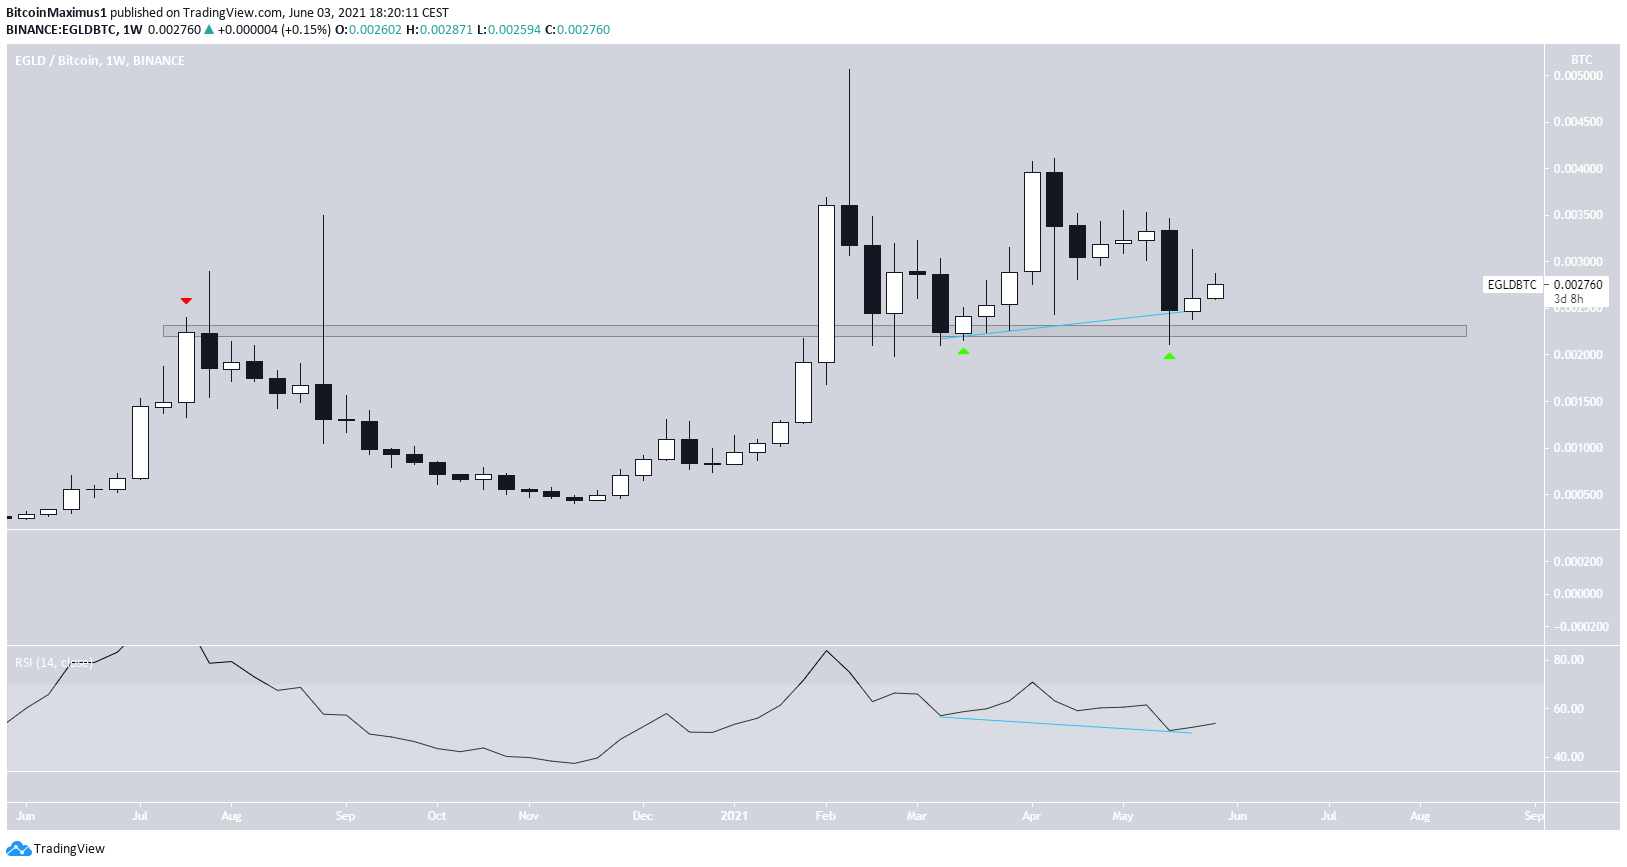
EGLD/BTC has indeed bounced at the long-term support area at ₿0.00225. The area previously acted as resistance on June 2020. Therefore, the current decrease can be seen as a bullish re-test.
Furthermore, the weekly RSI has generated hidden bullish divergence, a strong sign of trend continuation.
Thus, the long-term trend can be considered bullish.
For BeInCrypto’s latest bitcoin (BTC) analysis, click here.
