


The Elrond (EGLD) price has been increasing since it broke out from a long-term descending resistance line on Oct. 24.
EGLD has reclaimed the $9.60 resistance area, and it is expected to continue increasing as long as it is trading above this level.
Despite this, lower time-frames suggest that a short-term drop is expected before it eventually resumes its upward movement.
Long-Term Breakout
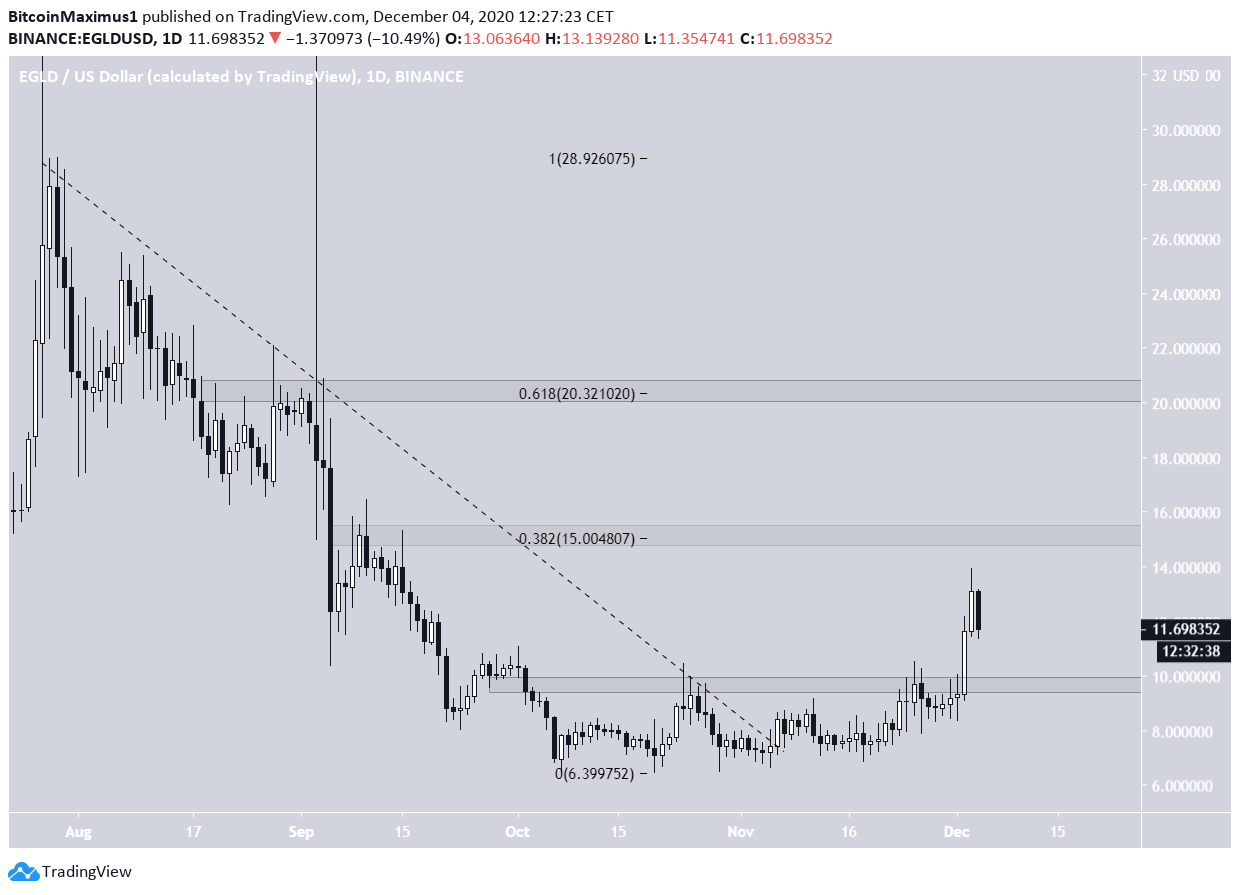
The EGLD price has been increasing since reaching a low of $6.44 on Oct. 7. At the end of the month, it broke out from a descending resistance line that had previously been in place since July and accelerated.
On Dec.2, EGLD successfully broke out above the $9.60 resistance area and proceeded to reach a high of $13.63 before dropping.
The closest resistance area is at $15, the 0.382 Fib retracement level of the entire decline. The next resistance level is at $20.30, the 0.618 Fib retracement.
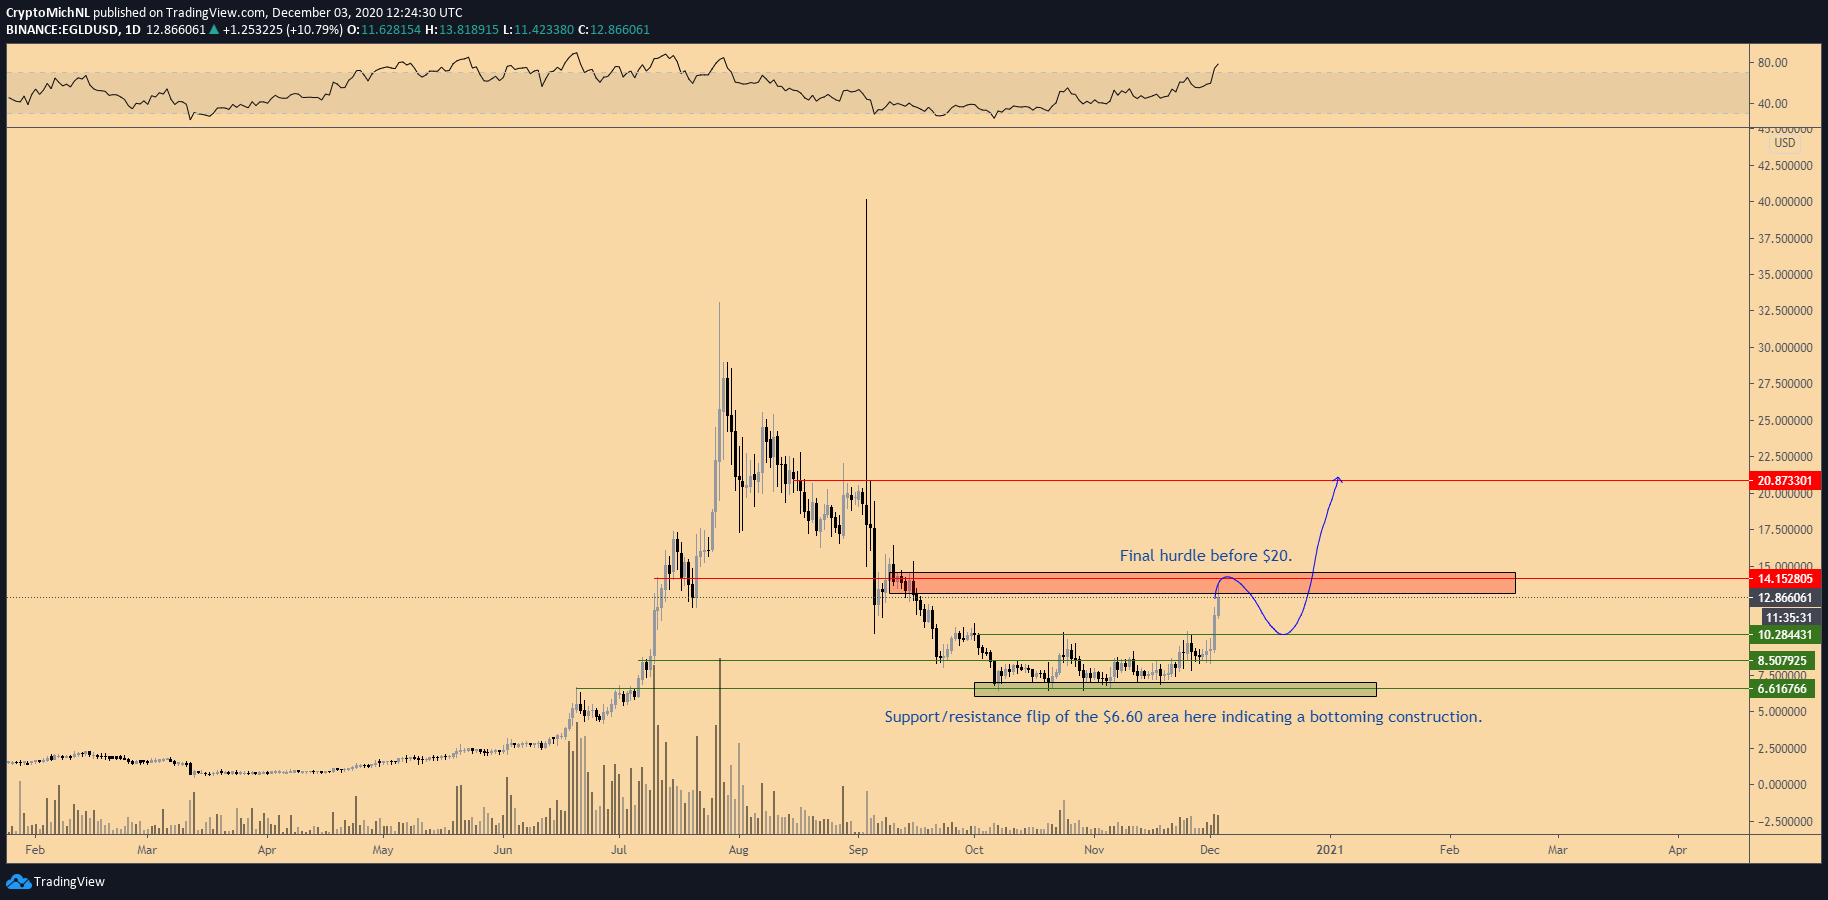
Cryptocurrency trader @CryptoMitchNL outlined an EGLD chart, stating that the price could rally towards $14, and if successful in breaking out, move to $20.
This is similar to the idea presented above, with the only difference being the first resistance area at $14 instead of $15.
Future Movement
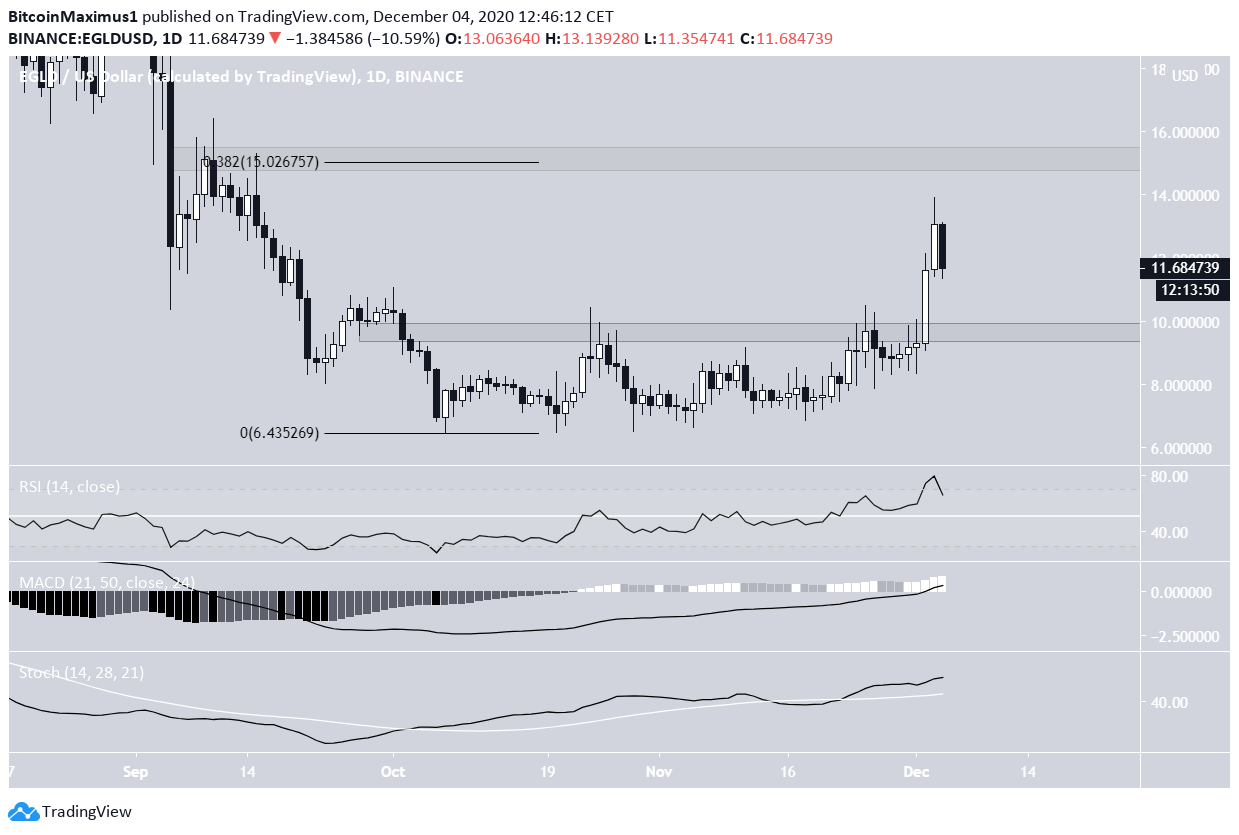
Technical indicators on the daily time-frame support the possibility of continuation:
- The MACD is increasing and is above 0.
- The RSI is increasing and is above 50.
- The Stochastic Oscillator is increasing and has made a bullish cross.
Therefore, EGLD should continue increasing at least until it reaches the $15 resistance area.
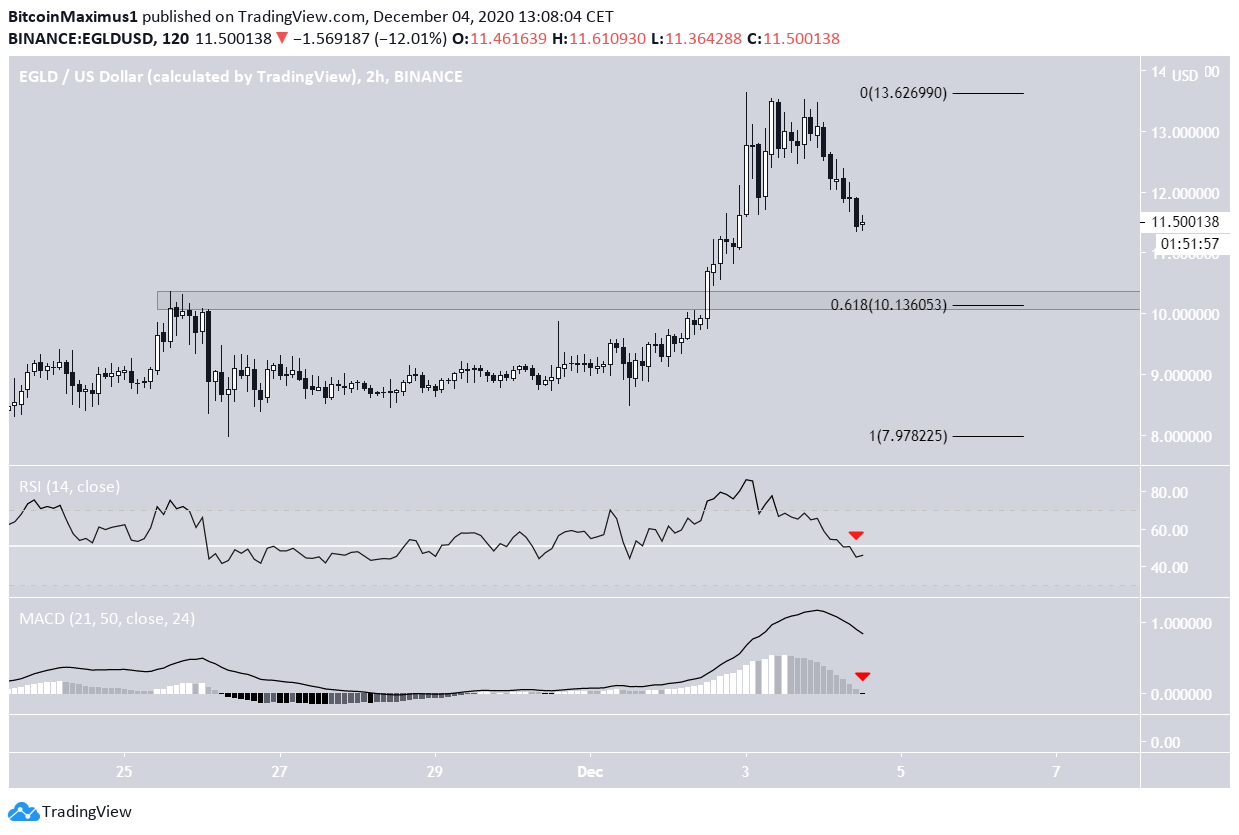
Despite this, the shorter-term two-hour chart shows that EGLD is likely to decline initially before it begins to move upwards.
The RSI has fallen below 50 while the MACD histogram has crossed into negative territory.
The closest minor support area is at $10.10, the 0.618 Fib retracement level and the previous resistance area. If EGLD bounces on this support area as expected, an upward move towards the previously outlined resistance areas should follow.
Conclusion
To conclude, EGLD should continue moving upwards towards the next resistance area at $15 and possibly $20.
Nevertheless, a short-term retracement is likely before it eventually resumes its upward momentum.
For BeInCrypto’s previous Bitcoin analysis, click here!
Disclaimer: Cryptocurrency trading carries a high level of risk and may not be suitable for all investors. The views expressed in this article do not reflect those of BeInCrypto.


