

The Polkadot (DOT) price has reached an important resistance area that has been in place since the beginning of Sept. While the price could eventually break out, a short-term decline is likely.
The DIA (DIA) price is in the process of breaking out from a descending resistance line.
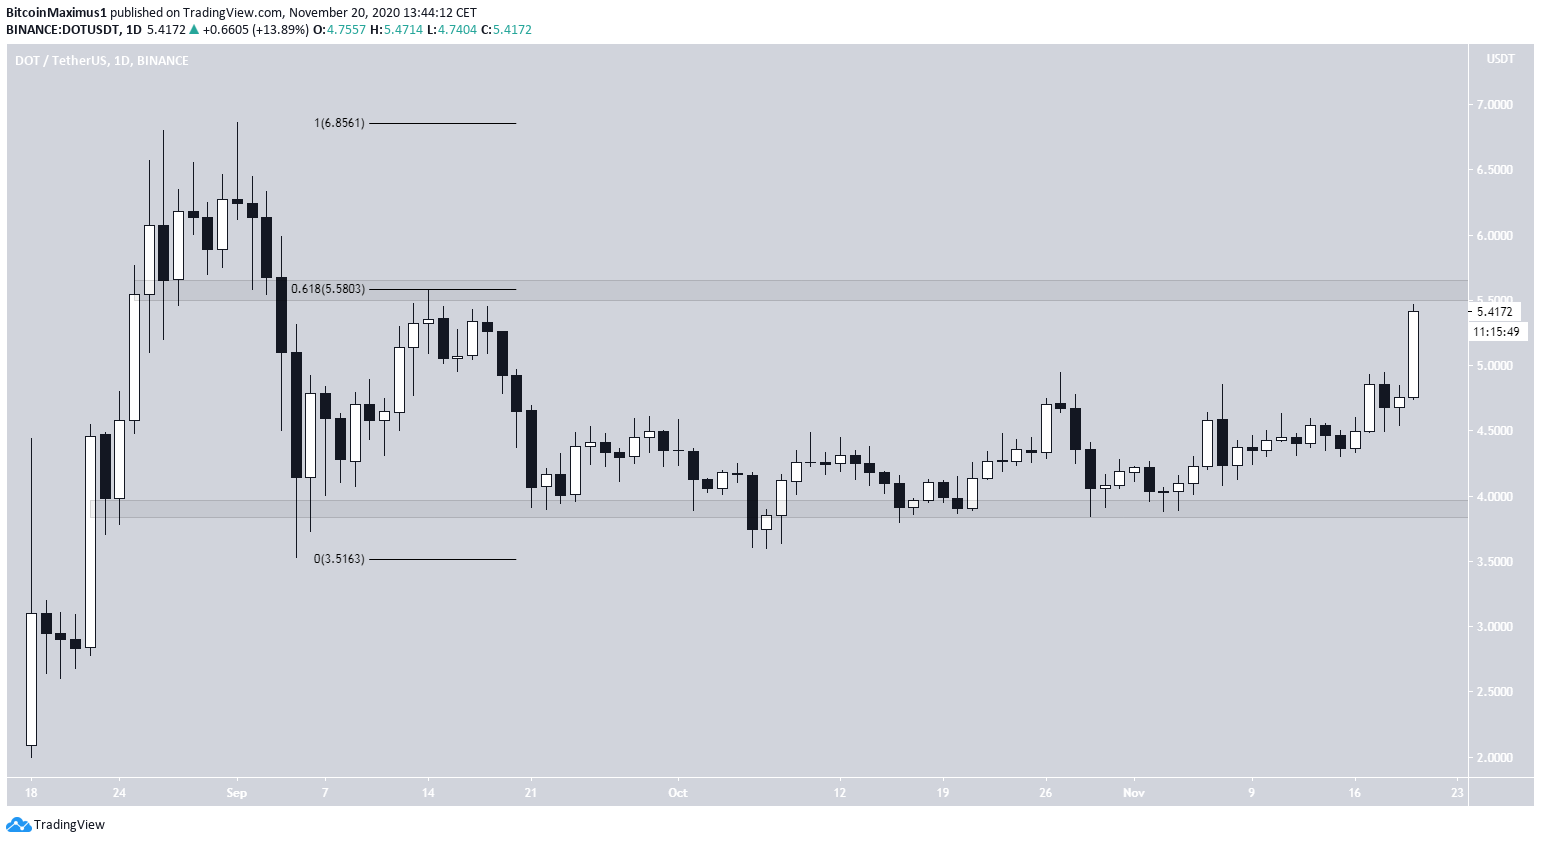
DOT Trading Range
The DOT price has been trading in a range between $3.90 and $5.60 since the beginning of Sept. The price consolidated near the support area throughout Sept-Oct before beginning to move upward in Nov.
At the time of writing, the price had almost reached the $5.60 resistance area, which is also the 0.618 Fib level of the entire previous downward move. A breakout above this level would likely accelerate the rate of increase until DOT reaches the Sept highs near $6.80.
Future Movement
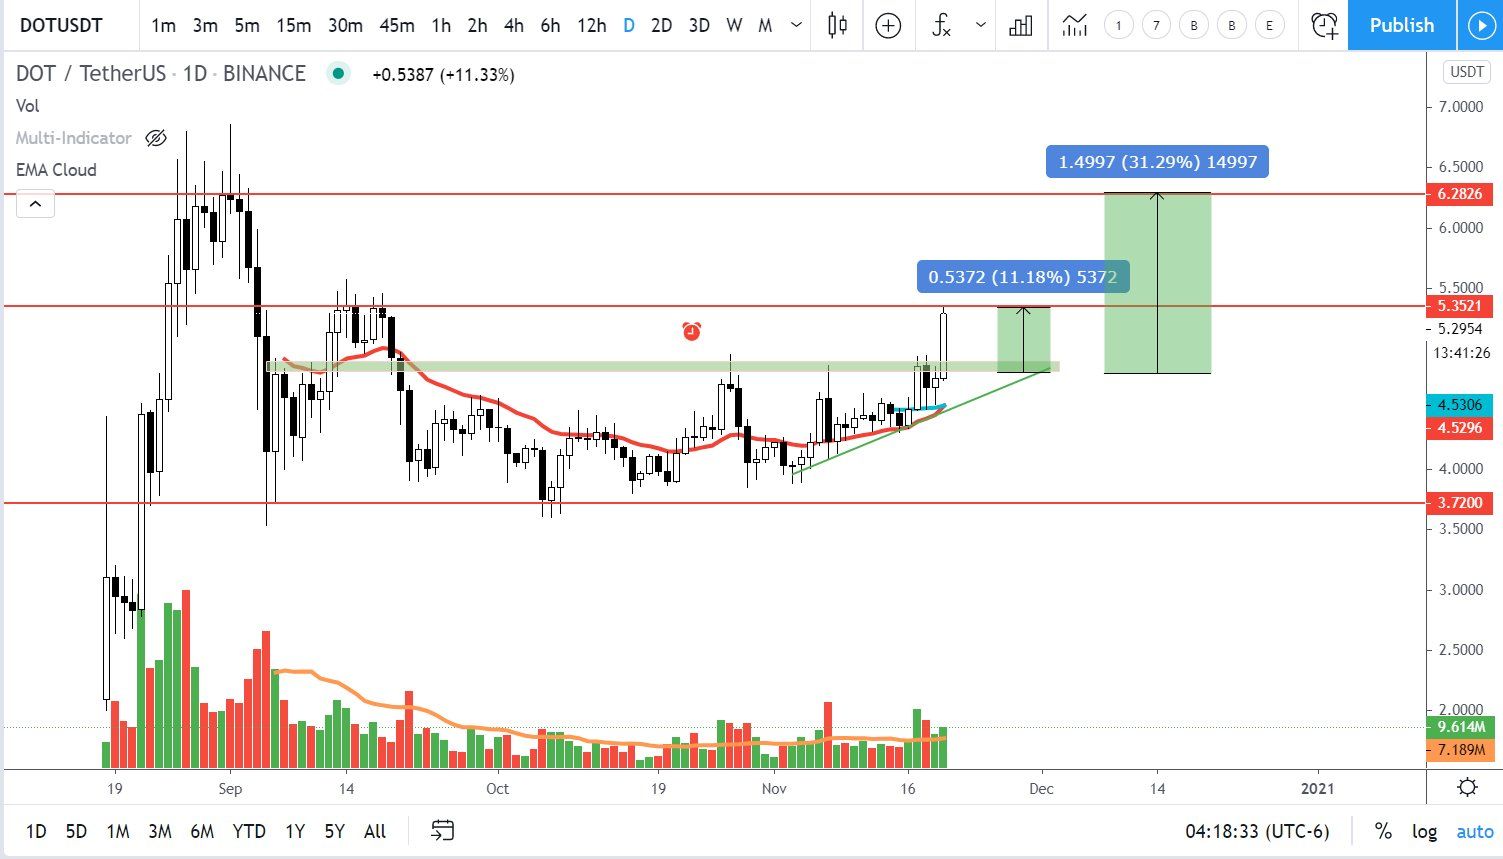
Cryptocurrency trader @Devchart, outlined a DOT chart, stating that the price had reached his first target of 11%. He suggested that it might continue rallying until $6.30. The proposed increase would take the price all the way to the Sept highs.
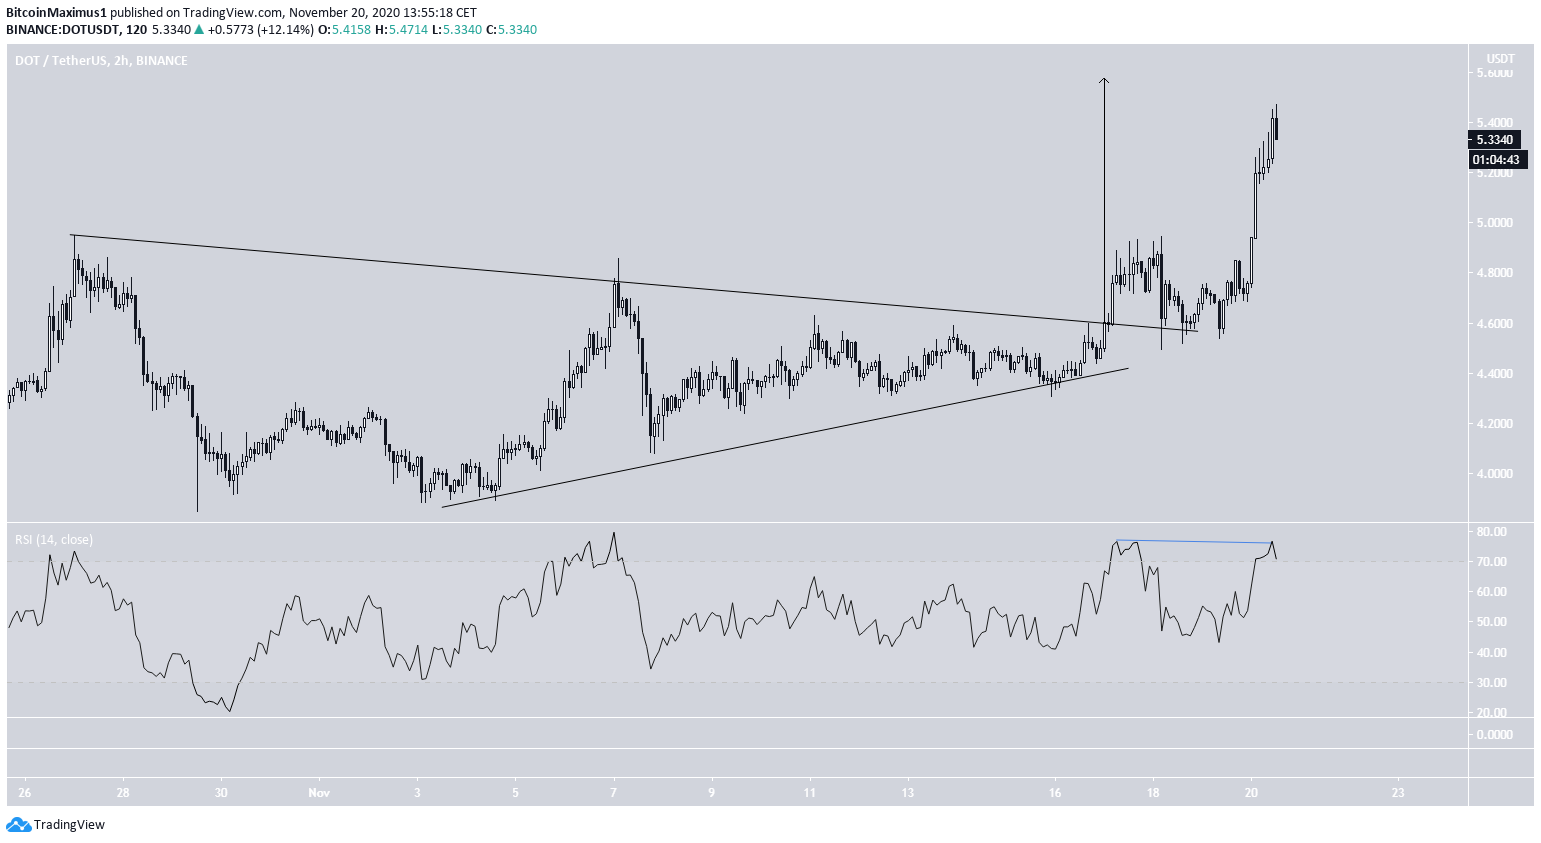
The short-term two-hour chart shows that DOT has broken out from a symmetrical triangle, validated it as support, and continued to move upwards.
Despite this, the price has also reached the height of the pattern projected to the breakout level (black arrow), which also coincides with the previously mentioned resistance area.
Furthermore, the bearish divergence that has developed in the two-hour RSI is a sign that the price is likely to retrace in the short-term before possibly making another breakout attempt.
DIA Movement
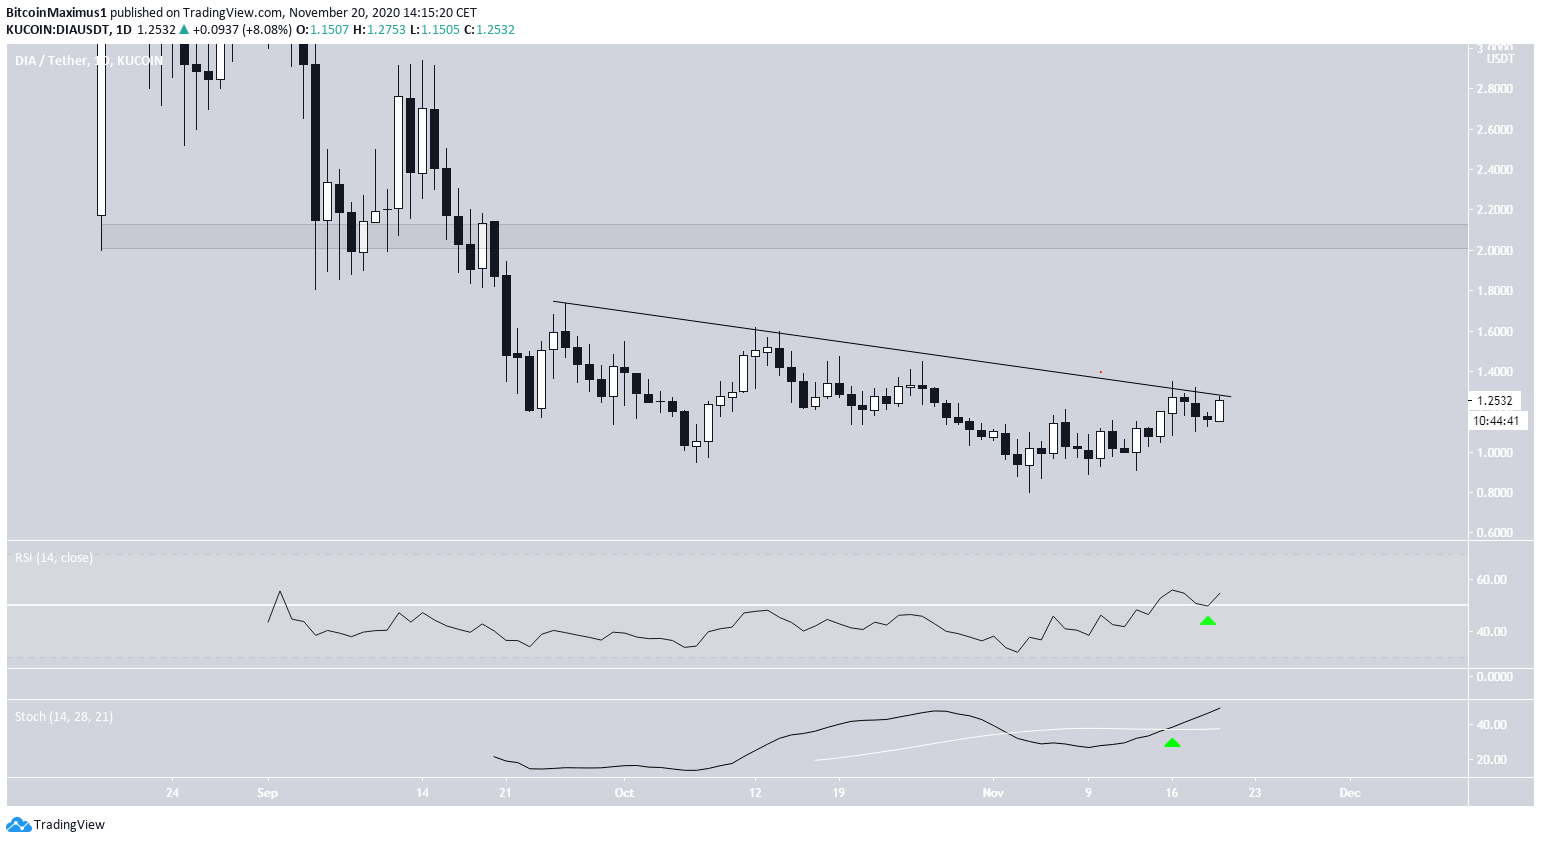
The DIA price has been following a descending resistance line since Sept 21. At the time of writing, the price was making its fifth breakout attempt.
Technical indicators on the daily time-frame are bullish since both the RSI and the Stochastic Oscillator are increasing. Furthermore, the RSI is above 50 and the Stochastic Oscillator has just made a bullish cross.
Therefore, DIA is likely to break out and move towards the closest resistance area at $2.10.
Conclusion
To conclude, both DIA and DOT are in the process of breaking out from important resistance levels. While DOT seems more likely to undergo a short-term decline before eventually breaking out, DIA could break out without retracing at all.
For BeInCrypto’s previous Bitcoin analysis, click here!
Disclaimer: Cryptocurrency trading carries a high level of risk and may not be suitable for all investors. The views expressed in this article do not reflect those of BeInCrypto
Disclaimer
In line with the Trust Project guidelines, this price analysis article is for informational purposes only and should not be considered financial or investment advice. BeInCrypto is committed to accurate, unbiased reporting, but market conditions are subject to change without notice. Always conduct your own research and consult with a professional before making any financial decisions. Please note that our Terms and Conditions, Privacy Policy, and Disclaimers have been updated.
