


The Polkadot (DOT) price reached an all-time high price on Jan. 16, while the DeFi index followed suit three days later.
Both should continue increasing towards their closest respective resistance areas.
All-Time High Price
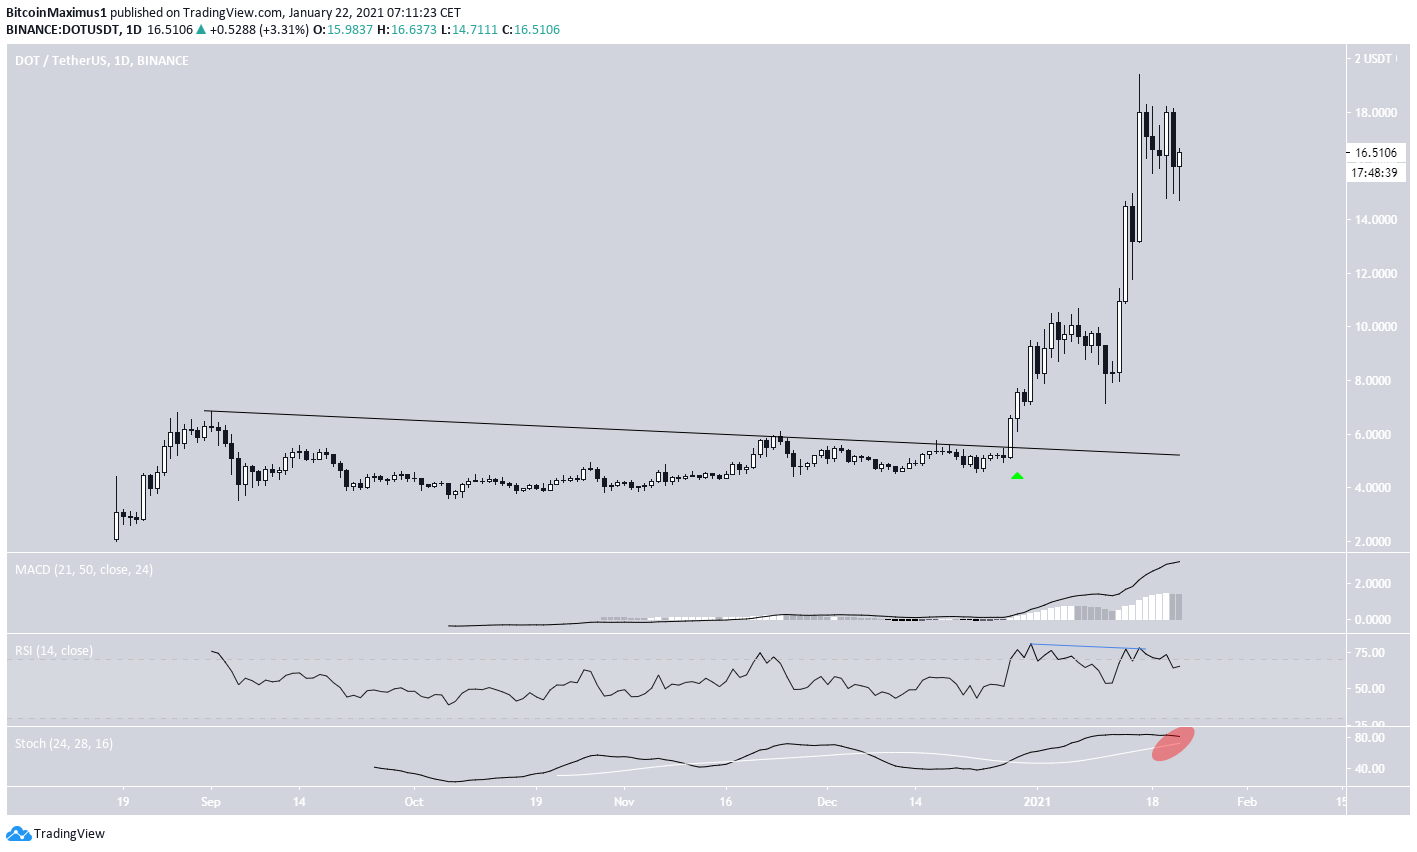
DOT has been increasing rapidly since breaking out from a descending resistance line on Dec. 28, 2020. DOT continued to rally and reached an all-time high price of $19.40 on Jan. 16.
The rate of increase has turned parabolic, and technical indicators have begun to show weakness. While the MACD is still increasing, the RSI has formed bearish divergence, and the Stochastic Oscillator is close to making a bearish cross.
DOT’s Short-Term Movement
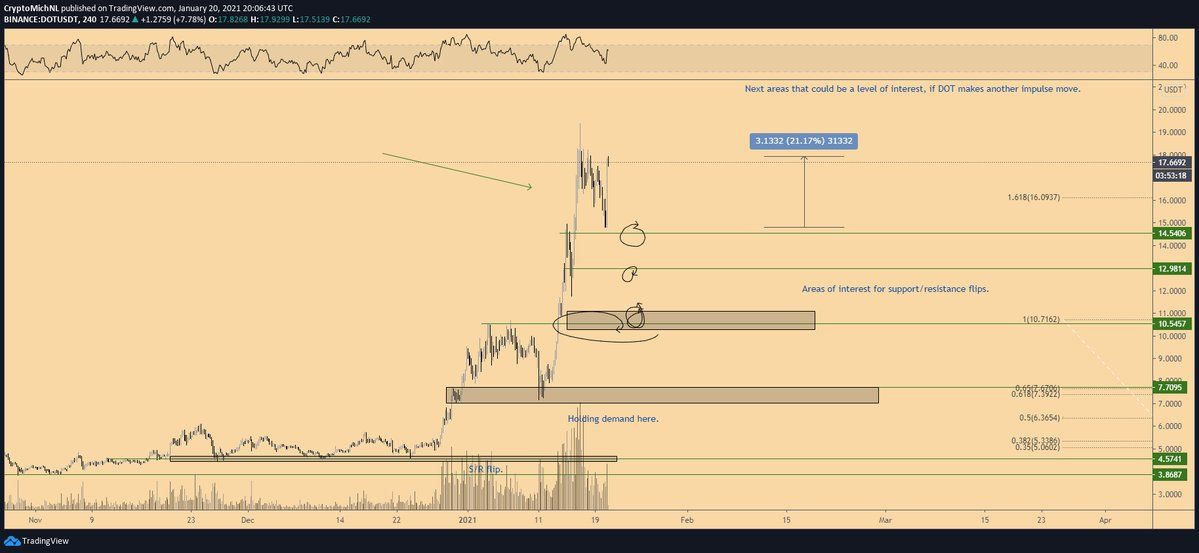
Cryptocurrency trader @CryptoMichNL outlined a DOT chart, stating that it has reached the first support area at $14.50 and is likely to bounce from here.
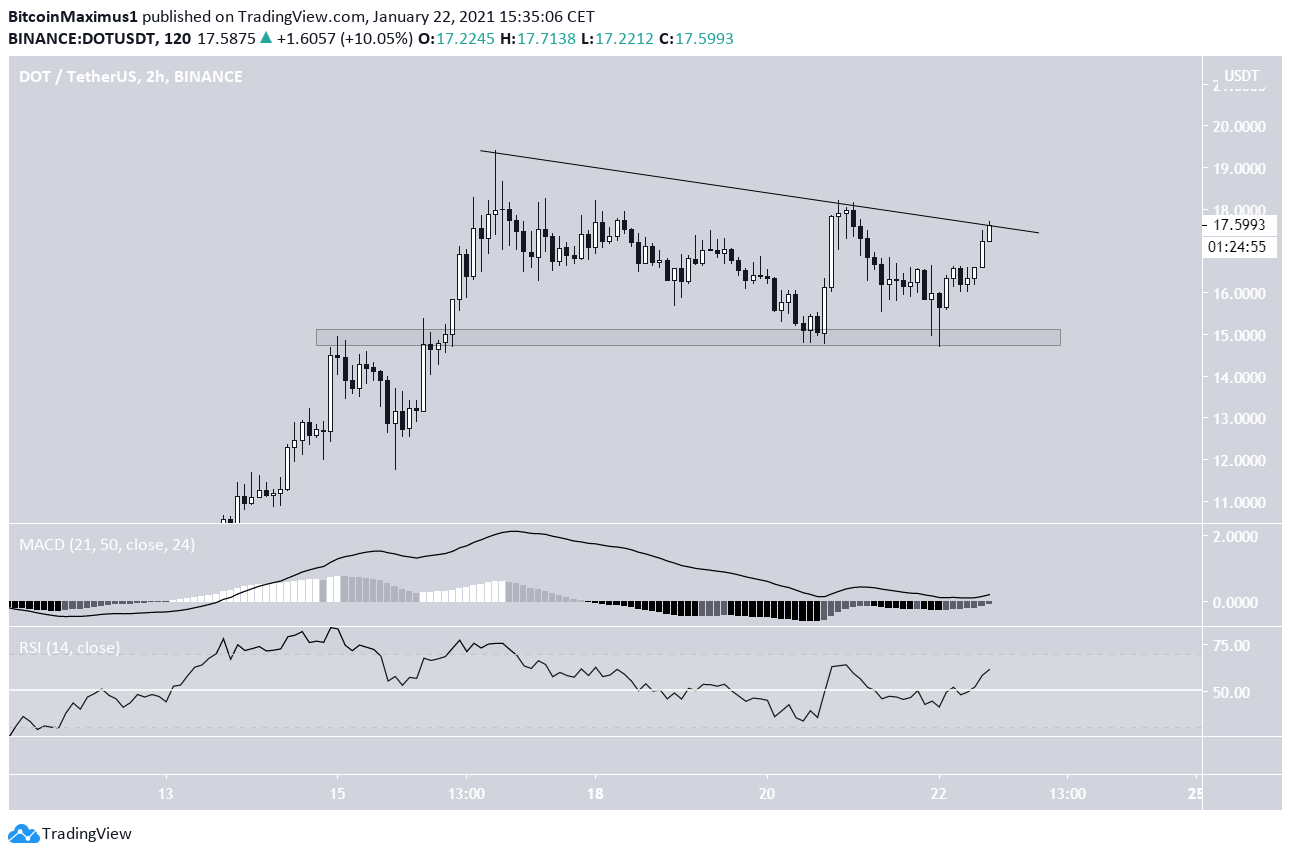
The shorter-term two-hour chart shows that DOT is following a descending resistance line. It continued to track this line after reaching the previous all-time high price on Jan. 16.
Currently, DOT is in the process of breaking out after bouncing on the $15 support area this morning. Technical indicators are bullish and support the potential for a breakout.
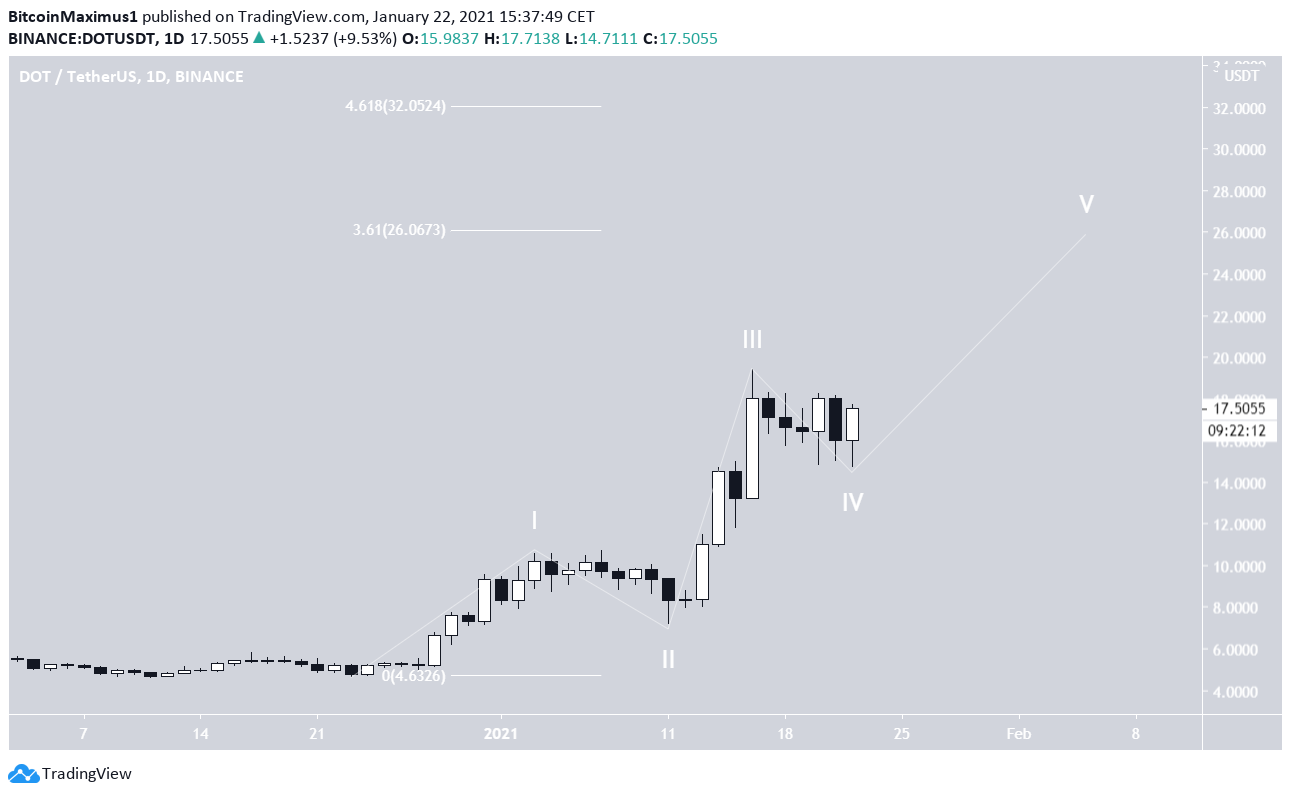
If it does, the most likely target for the next resistance area is at $26, the 3.61 Fib extension of wave 1 (shown in white below). The next target would be at $32, the 4.61 Fib extension of the same wave.
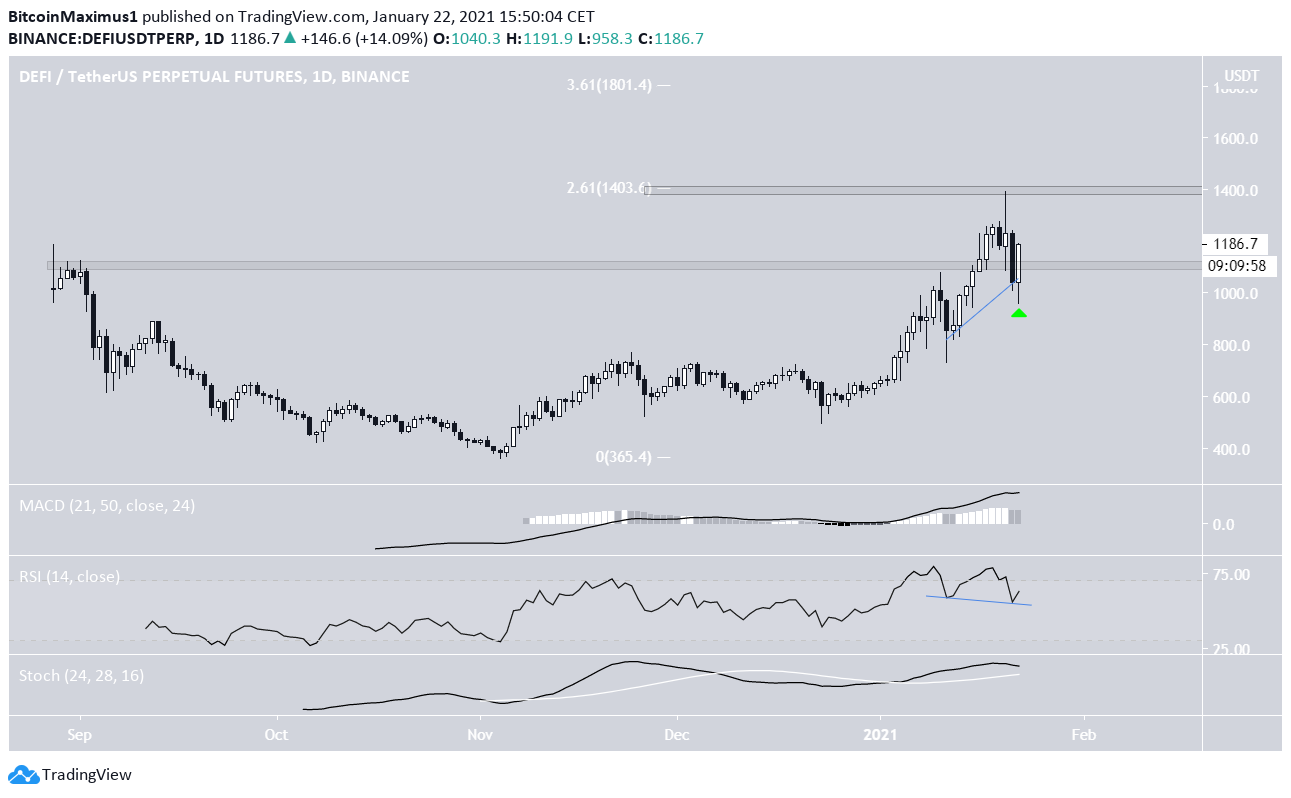
The DeFi Index
The DeFi index reached an all-time high of $1,391 on Jan. 19. While it dropped afterward, breaking down from the $1,050 level, it is currently in the process of reclaiming it.
Furthermore, the RSI has generated significant hidden bullish divergence, a sign of a trend continuation. If the index moves upwards as expected, the next closest resistance areas are at $1,400 and $1,800, respectively.
Conclusion
To conclude, both DOT and the DeFi index should continue increasing towards their closest resistance areas at $26 and $1,400, respectively.
For BeInCrypto’s latest Bitcoin (BTC) analysis, click here!


