
OFFICIAL TRUMP (TRUMP) is trading at $3.115, down 5.15% on the day and pressing toward its all-time low of $2.705. The Fibonacci structure shows the price has already broken below the 0.236 level at $3.128, with no meaningful support between the current price and the all-time low floor.
Two on-chain signals confirm that holders are not buying the dip. They are exiting. A rising impeachment probability on prediction markets has added a direct political catalyst to the technical breakdown.
Trump’s Impeachment Odds at 69% Before 2028
Kalshi, the regulated prediction market platform, currently prices the probability of Trump being impeached before January 1, 2028, at 69%. That reading has been climbing steadily since November 2025, rising from the low 40s to its current level with no meaningful reversal.
The nearer-term contract — impeachment before January 1, 2027 — sits at 14%, while the contract for impeachment before June 1, 2026, is priced at just 2%.
Want more token insights like this? Sign up for Editor Harsh Notariya’s Daily Crypto Newsletter here.
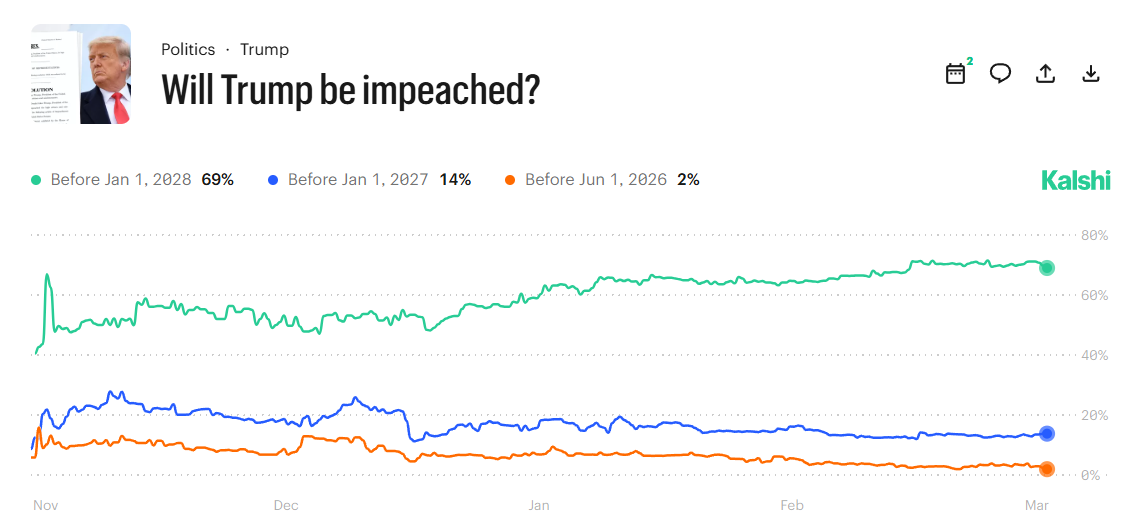
The market is not pricing an imminent event, but the long-run probability rising to 69% introduces sustained political uncertainty that removes a central value proposition from the TRUMP token, which is directly tied to the president’s public persona and political brand.
TRUMP Sellers Have Returned
The TRUMP exchange net position change chart covers March 3 through March 25, 2026. The first ten days of March were dominated entirely by red bars — consistent net outflows of between 5 million and 10 million tokens per day, with March 7 registering the largest outflow, nearly 10 million tokens.
A sharp reversal arrived on March 13 and 14, with a single green bar reaching approximately 22 million tokens — the largest inflow event on the chart. That spike coincided with TRUMP’s brief price recovery to the 0.786 Fibonacci level at $4.114. However, exchange flows normalized almost immediately after, returning to near-zero by March 17 and oscillating in a very tight range through March 25.
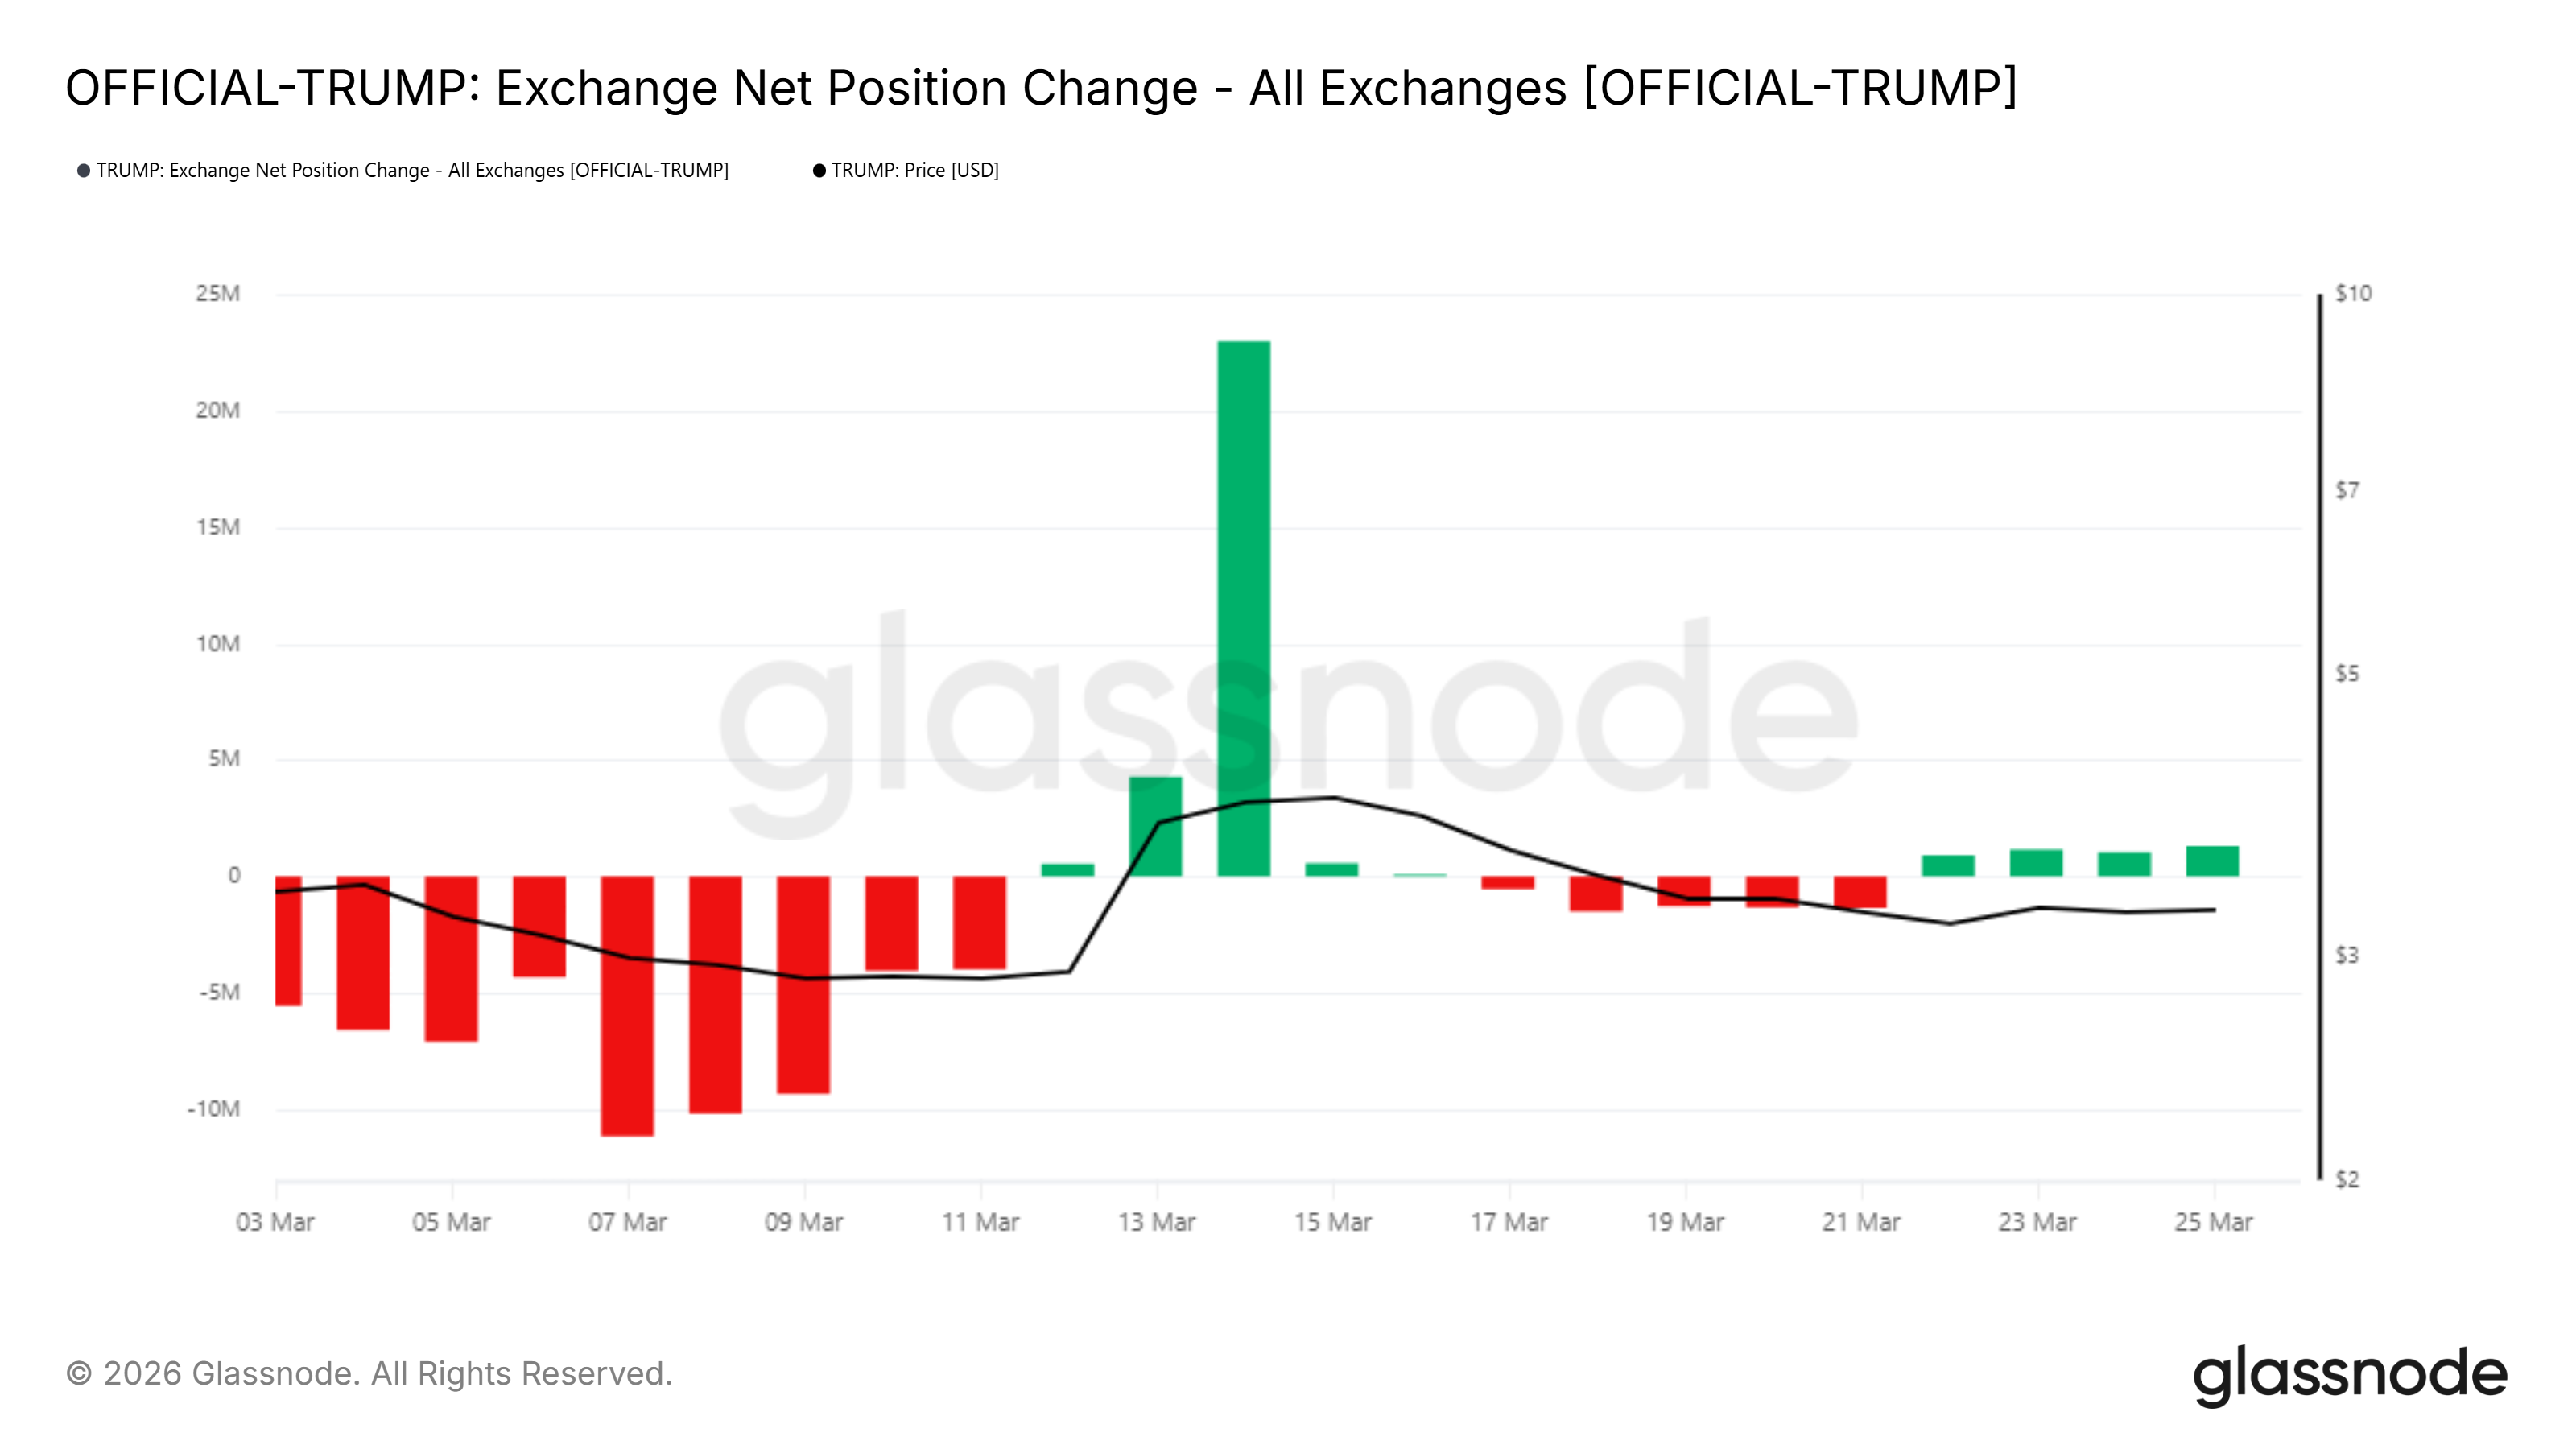
The lack of follow-through buying after the March 14 inflow spike is telling. Tokens moved onto exchanges in large volume, price briefly recovered. As a result, the situation stabilized at lower levels rather than continuing higher. That pattern is consistent with short-term traders selling into the brief rally rather than fresh buyers accumulating.
TRUMP Holders Are Selling At a Loss
The net realized profit/loss chart for TRUMP from March 6 through March 25 shows an uninterrupted sequence of red bars below the zero line. Not a single day in that span recorded a net realized gain for holders.
The largest single-day realized loss occurred on March 14, reaching approximately -$70 million — the worst reading on the chart. That day aligns directly with the large exchange inflow spike. This confirms that the tokens sent to exchanges were sold at a loss rather than accumulated.
The realized loss metric has moderated since then, hovering between -$5 million and -$15 million per day through late March. However, it has not moved above zero once.
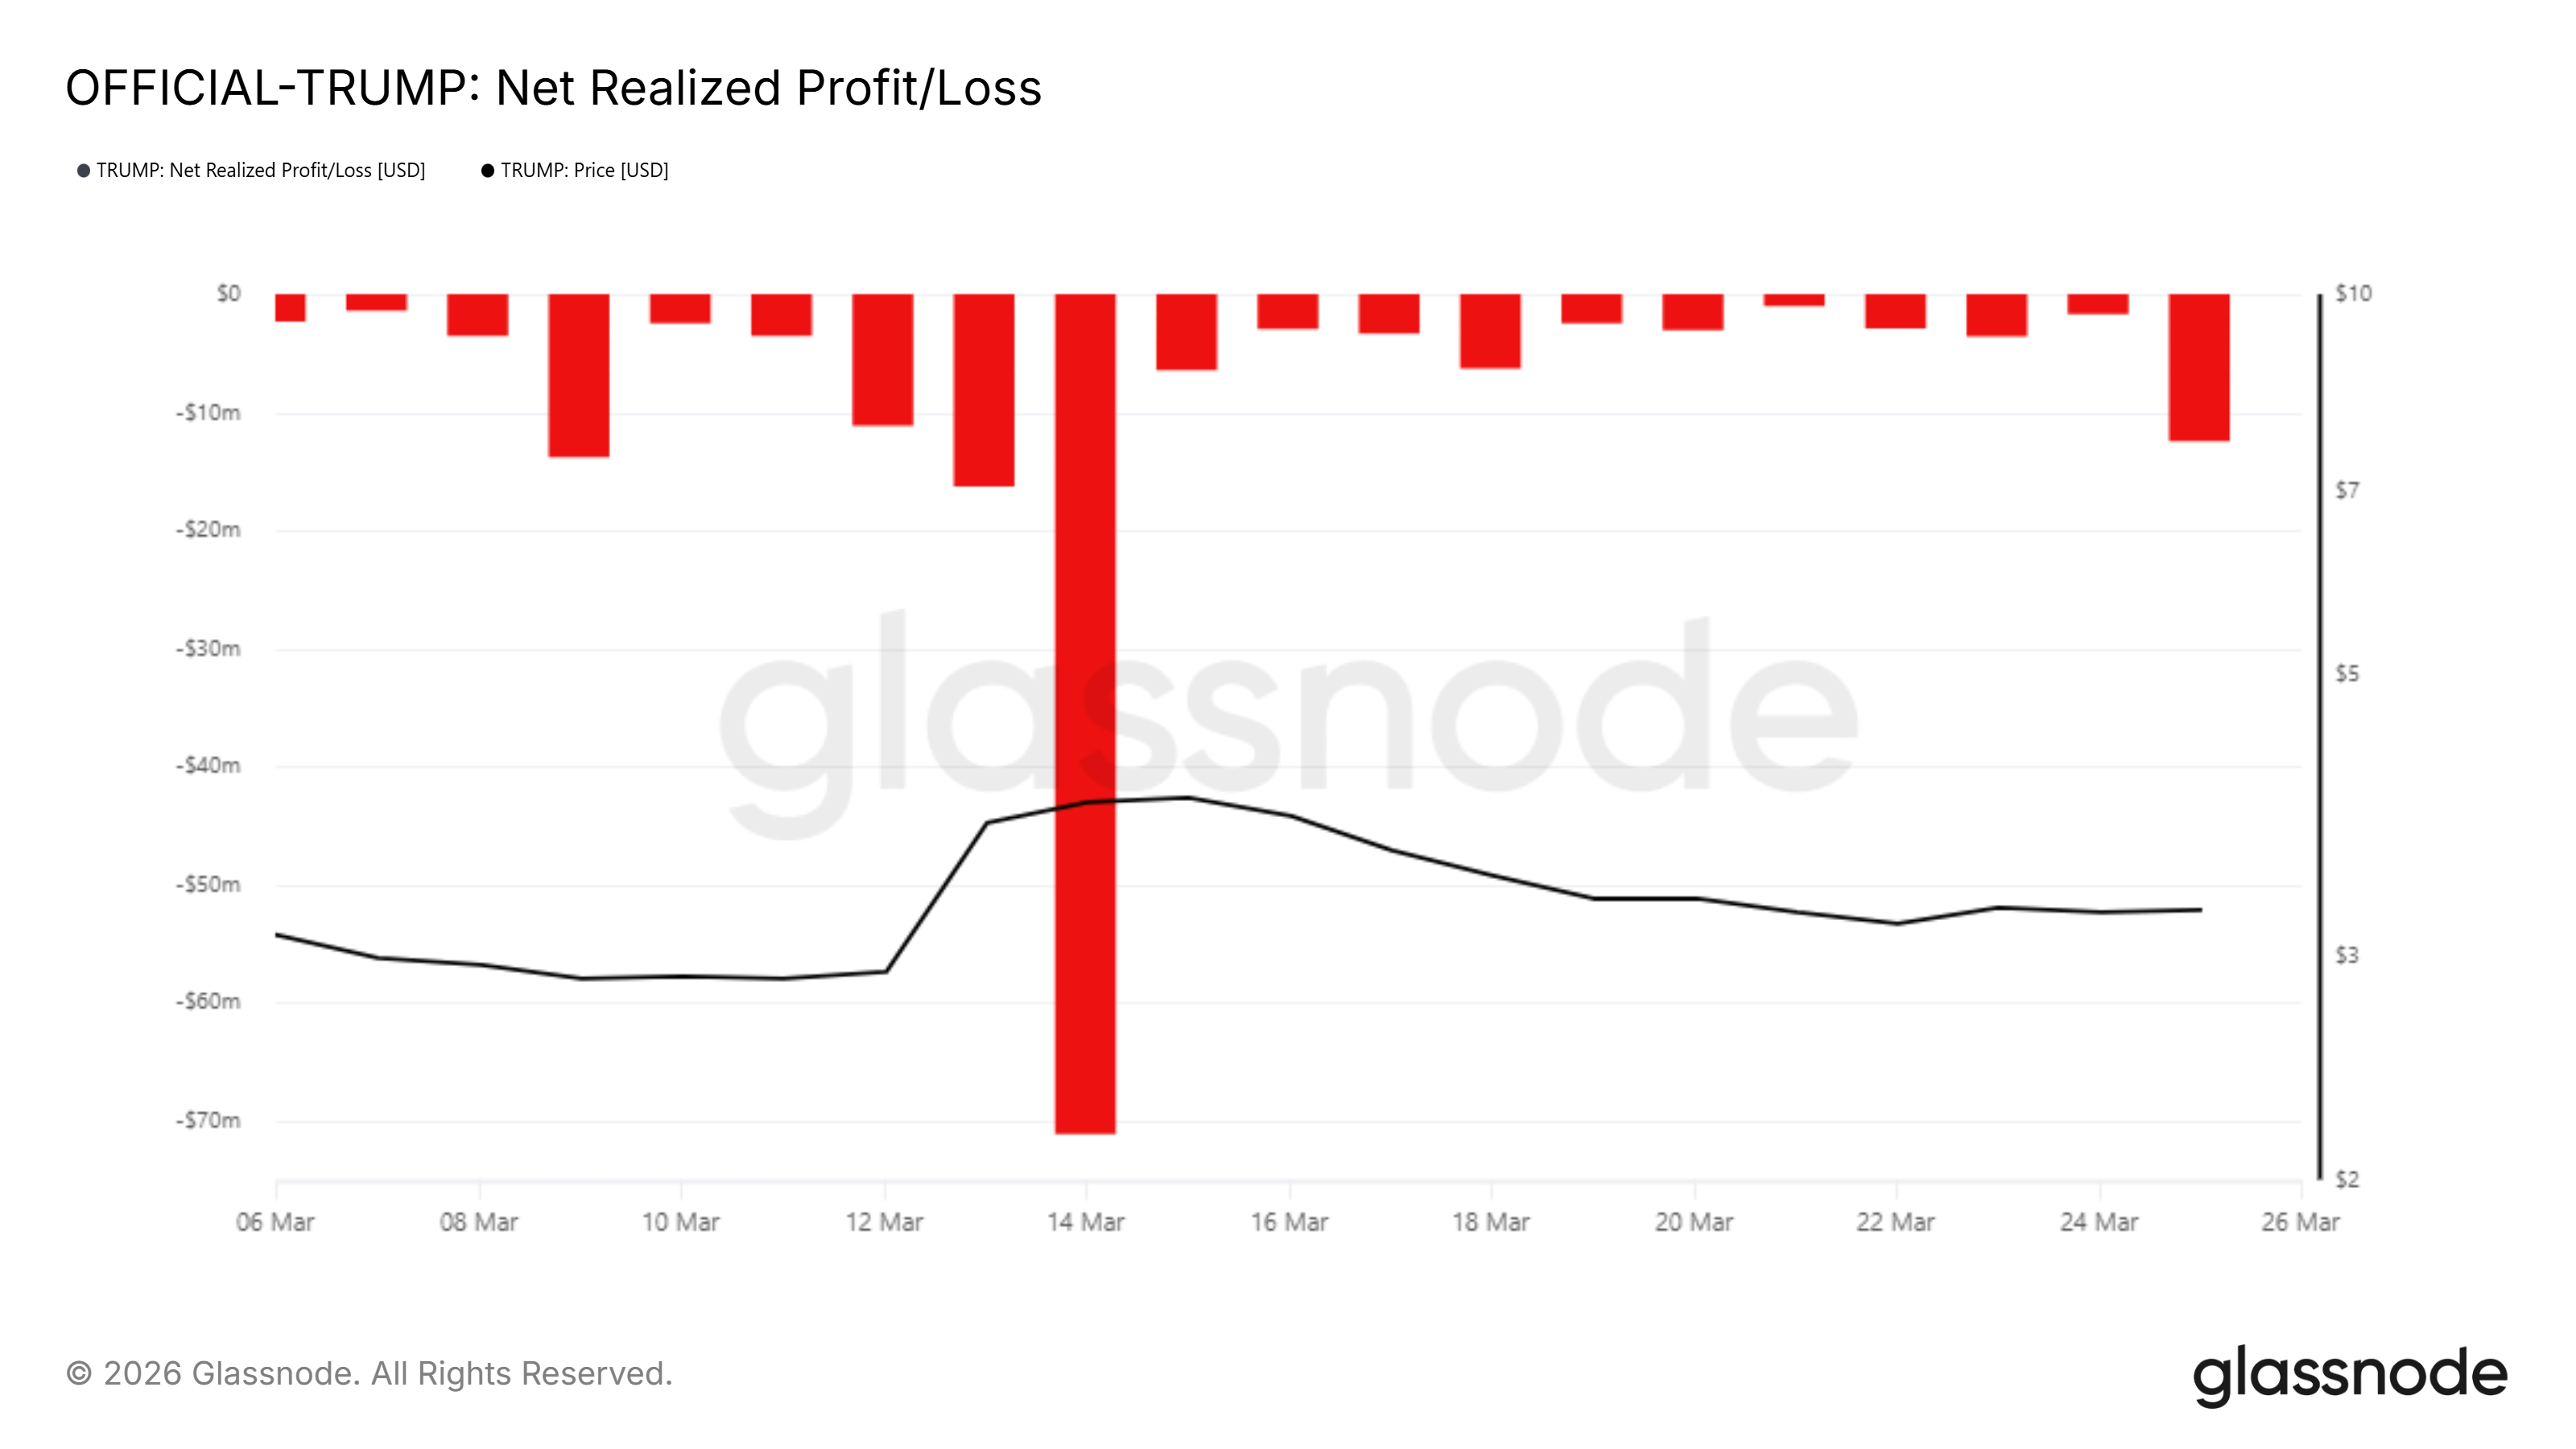
Sustained negative realized profit/loss with no green bars indicates that the seller base is not composed of profit-takers. It is composed of holders exiting positions at whatever price the market offers. This is the behavioral signature of capitulation rather than healthy rotation.
TRUMP Price Could Land Towards ATL
TRUMP has broken below the 0.236 Fibonacci level at $3.128, the last horizontal support above the all-time low. The Fibonacci grid runs from the zero level at $2.705 to the 1.0 level at $4.497.
The annotated measured move on the chart shows a prior 22.98% decline from $4.045 to $3.115. A 13% decline from current levels would bring the price below $2.705 and set a new all-time low below it. The above-mentioned factors make it very likely for the same to happen.
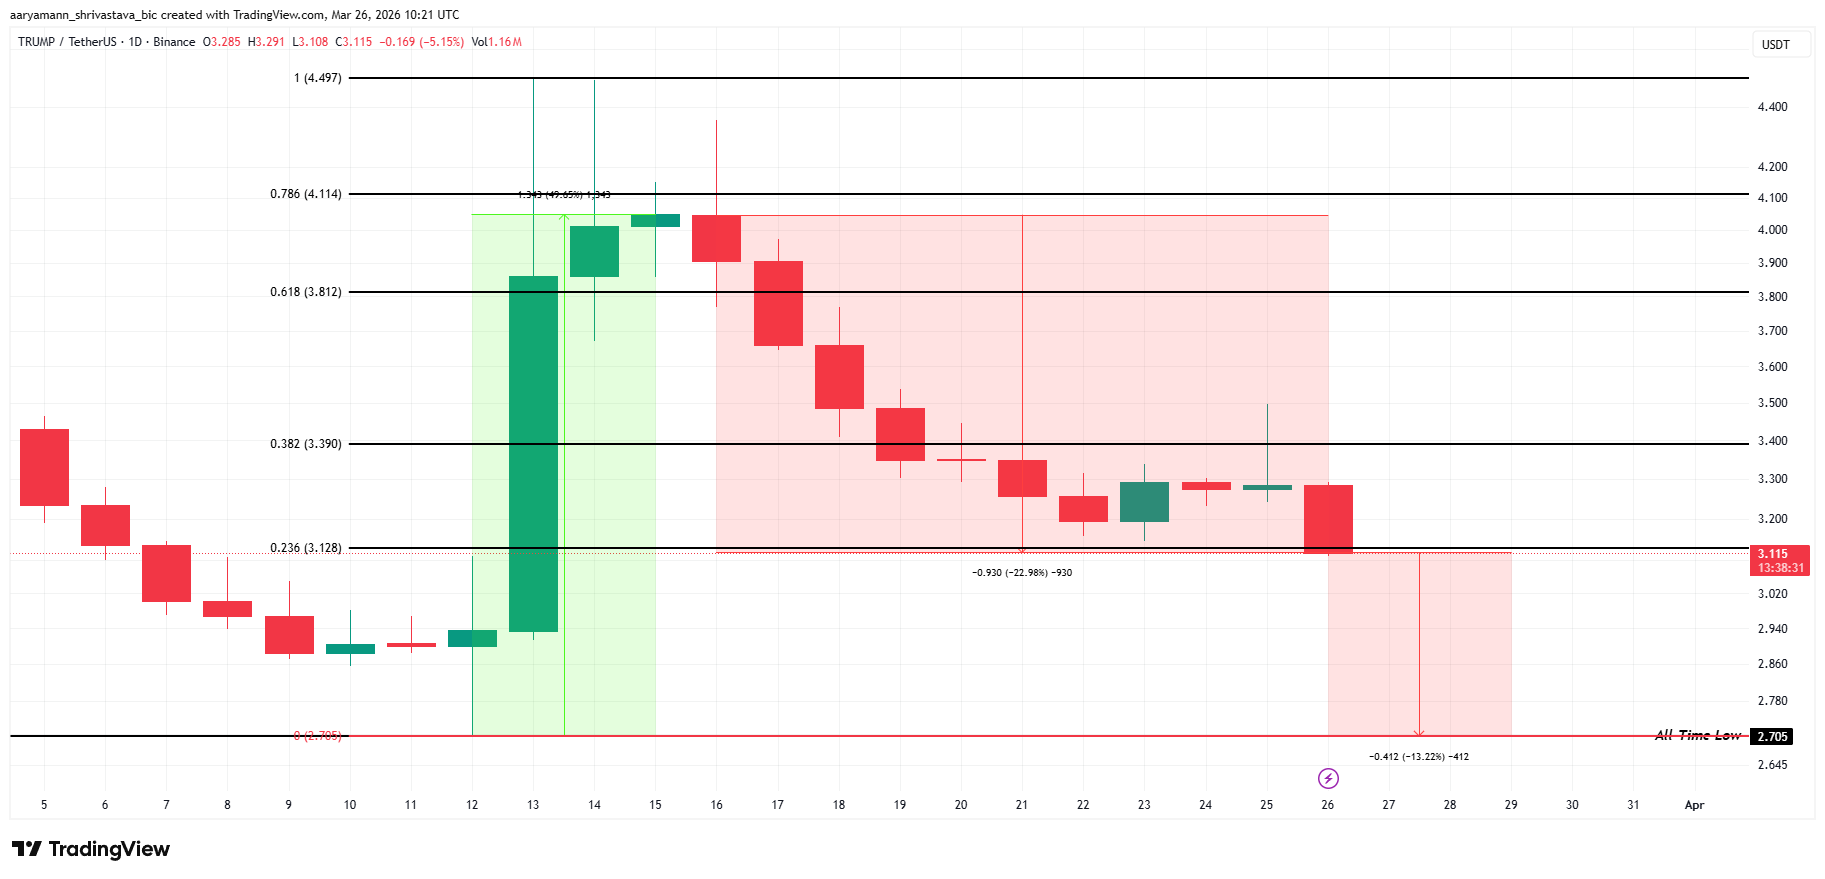
A daily close above the 0.382 Fibonacci level at $3.390 would be the first sign of stabilization. A sustained close above $3.812 would shift the TRUMP price structure from bearish to neutral and invalidate the new all-time low thesis. Until either of those levels reclaim on a daily close, on-chain data points toward $2.705 as the next target.
