After a one-year-long period of consolidation, the Dogecoin (DOGE) price finally broke out on July 7.
It initially increased by 100% in less than two days but has retraced slightly since.
DOGE Breaks Past Resistance
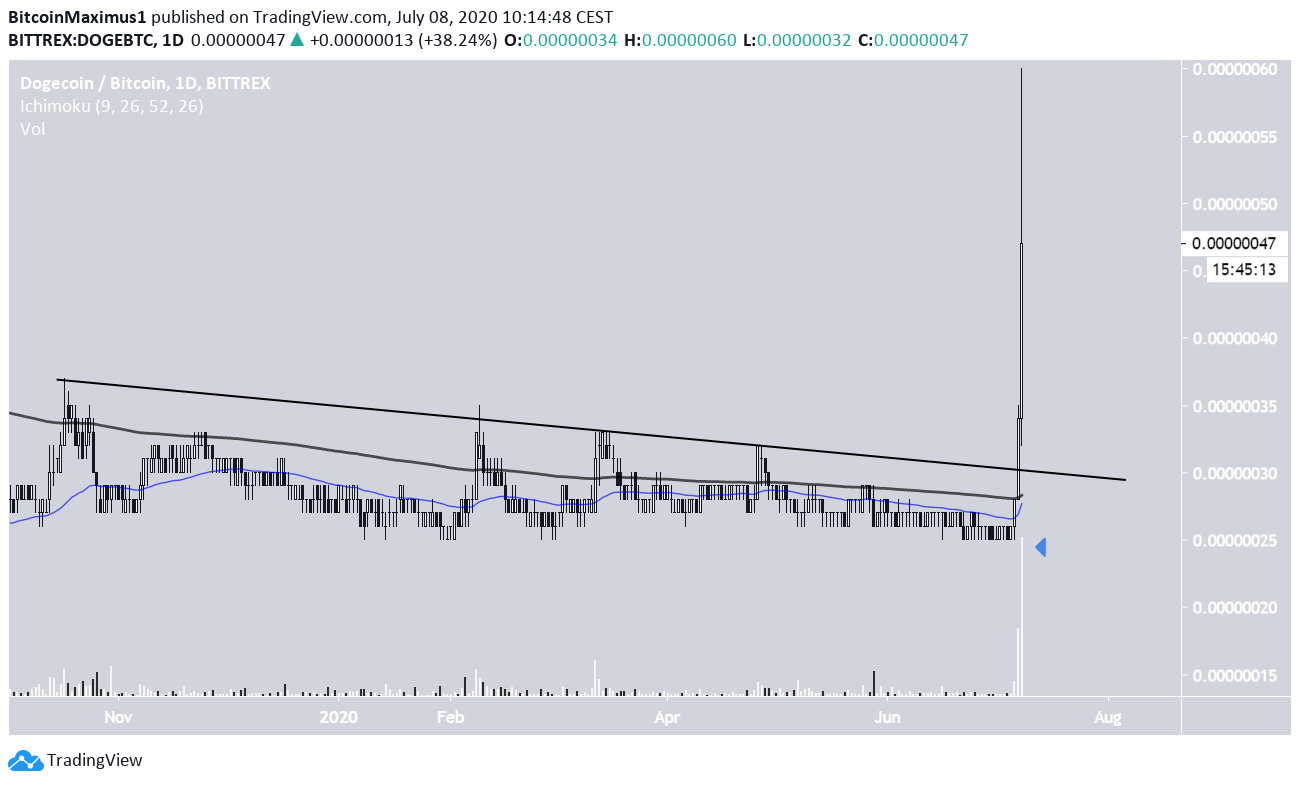
The DOGE price had been following a descending resistance line since October 2019, when the price reached a high of 37 satoshis. Until yesterday, the price made four unsuccessful attempts at breaking out above this level.
On July 7, the price was finally successful in breaking out, doing so with considerable volume, and followed that up by a massive bullish candlestick that reached a high of 60 satoshis. However, the price has decreased since, back down to 47 sats.
Before, the breakout, the price moved above both its 50 and 200-day moving averages (MA), which are very close to making a bullish cross.
Future Movement
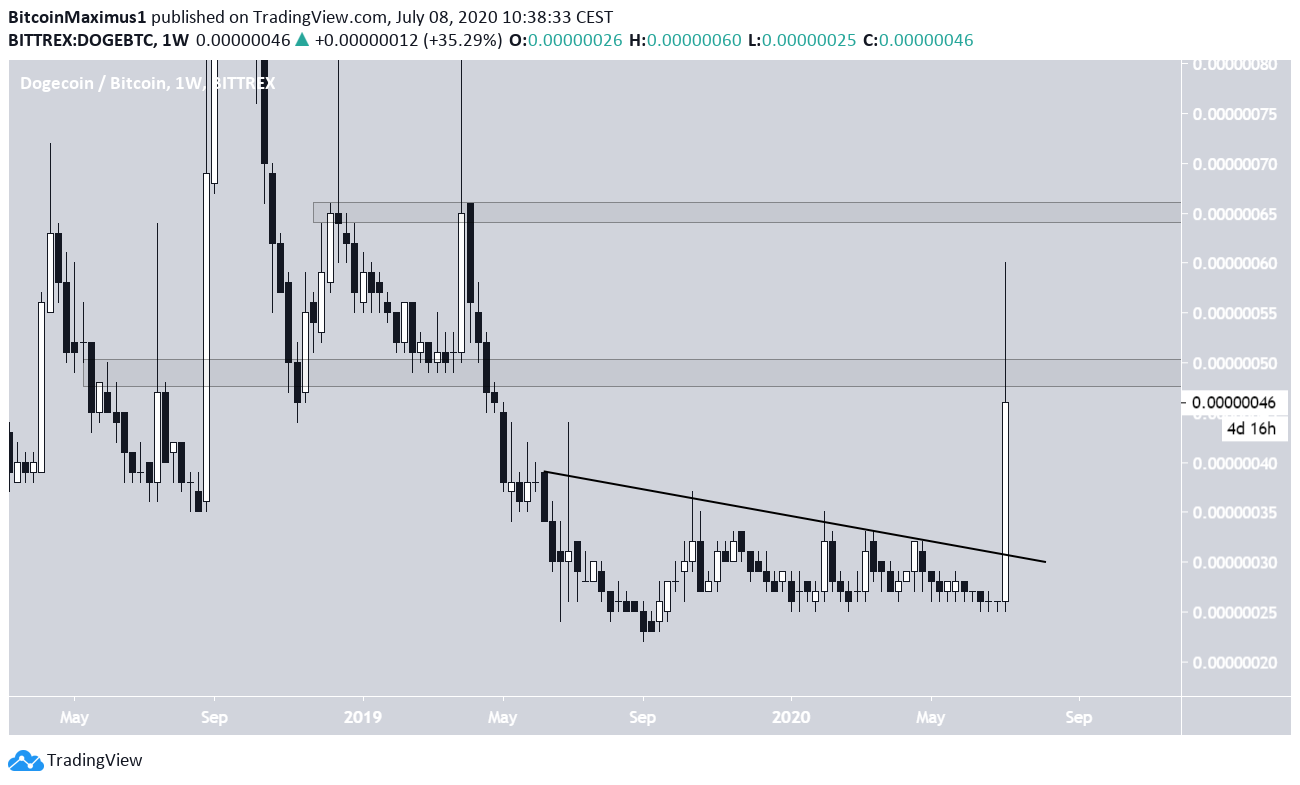
The weekly chart reveals two main resistance areas found at 50 and 65 satoshis. While the price initially increased above the former, it has since created a long upper-wick and decreased back below it.
The close for this week is very important. A close above 50 sats would indicate that the price will move towards the next resistance area at 65 satoshis, while failure to do so could cause the price to decrease towards 40 sats.
DOGE/USD
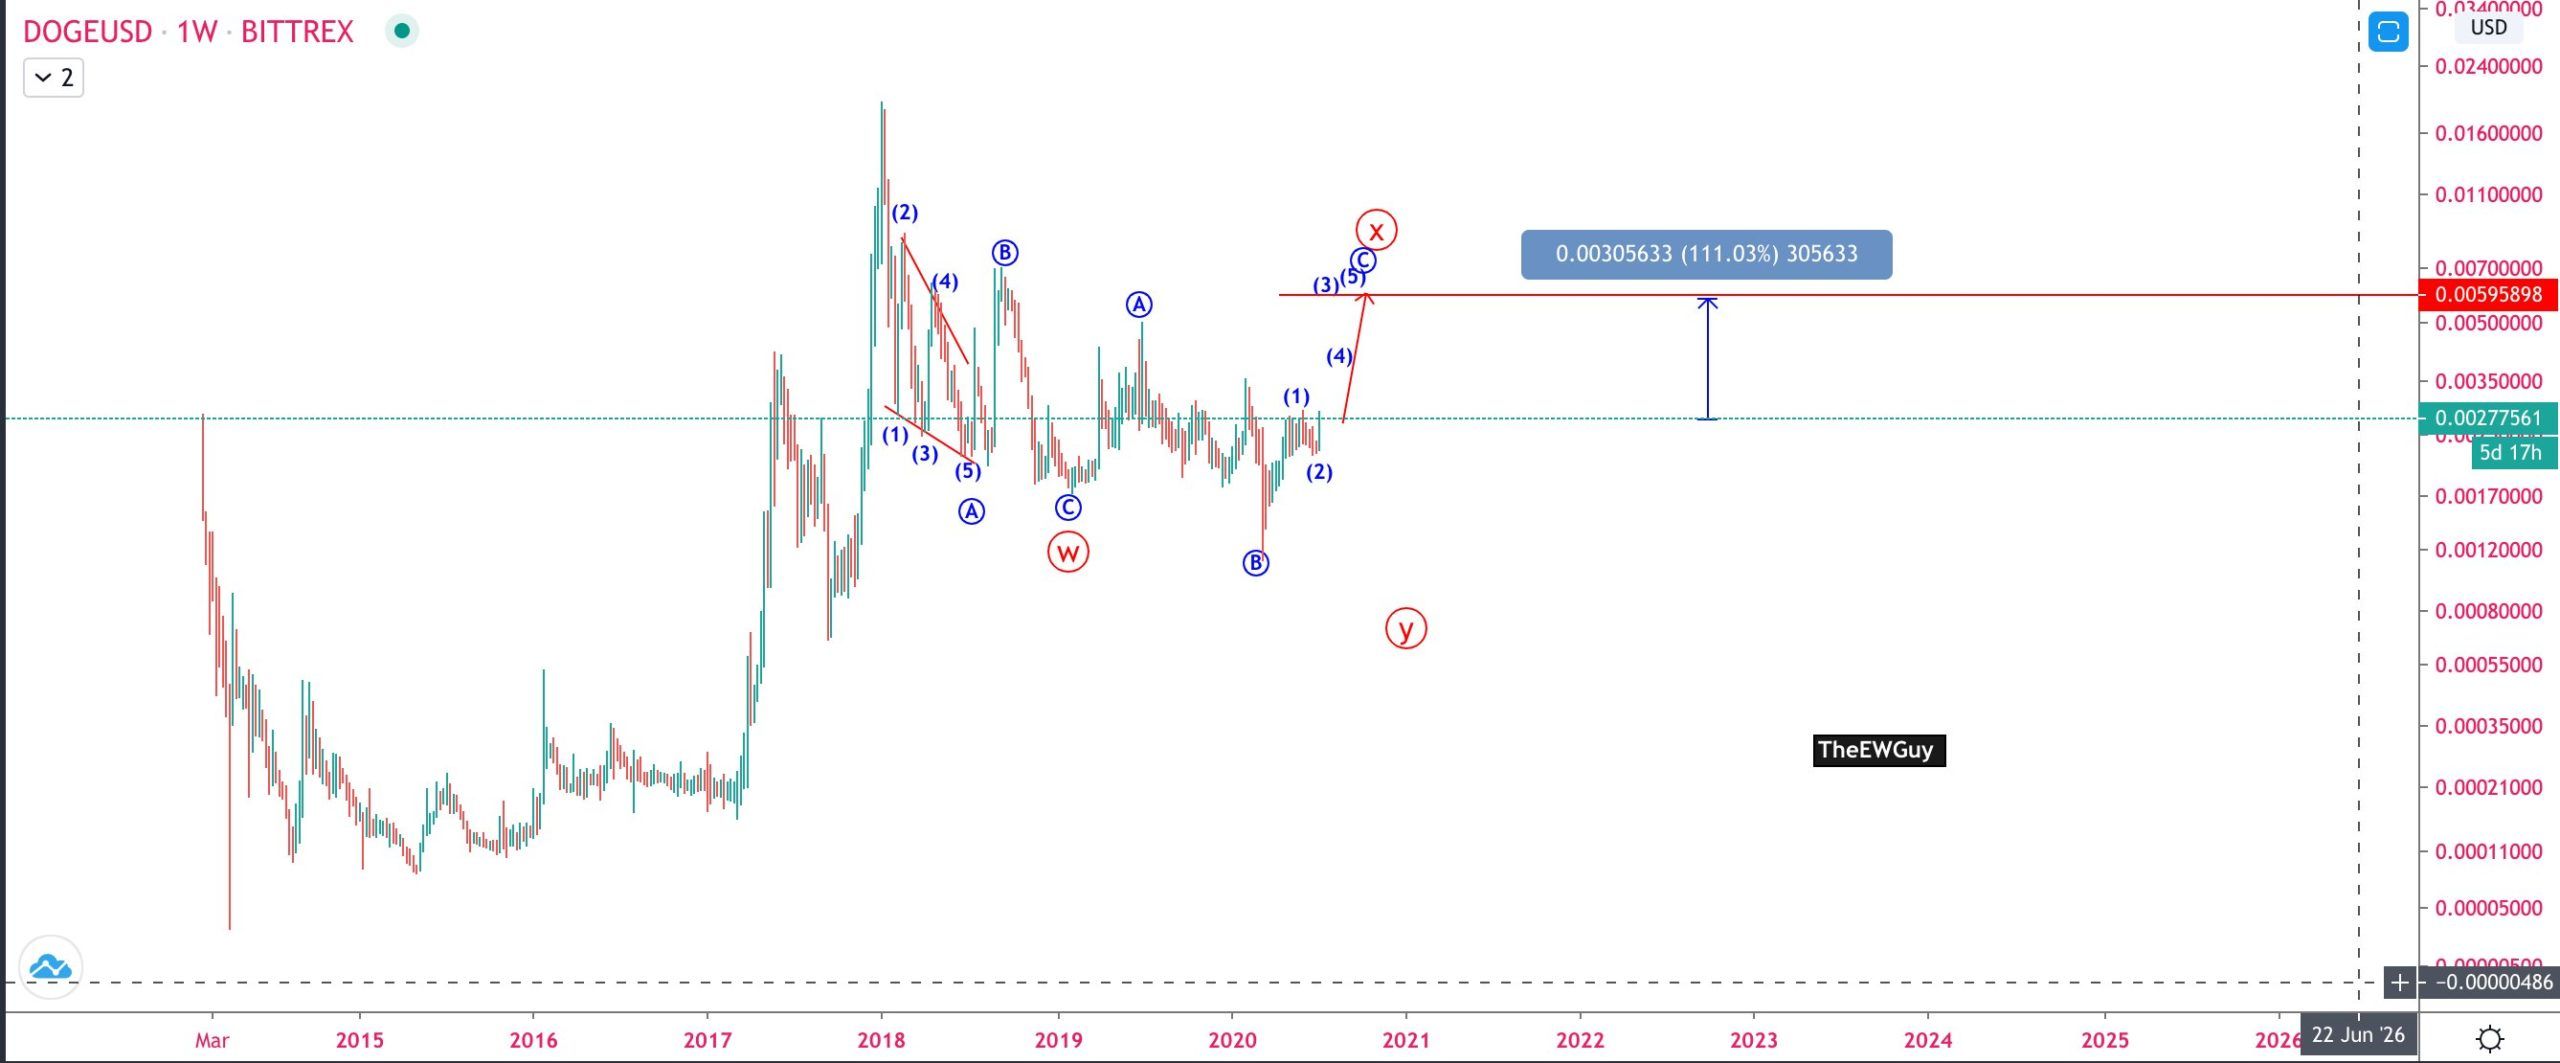
Cryptocurrency trader @TheEWguy stated that the DOGE price has already begun an upward movement, and will likely continue increasing until it reaches $0.0059. Yesterday’s increase took the price all the way to $0.0055 (60 satoshis), so the target has already been reached.
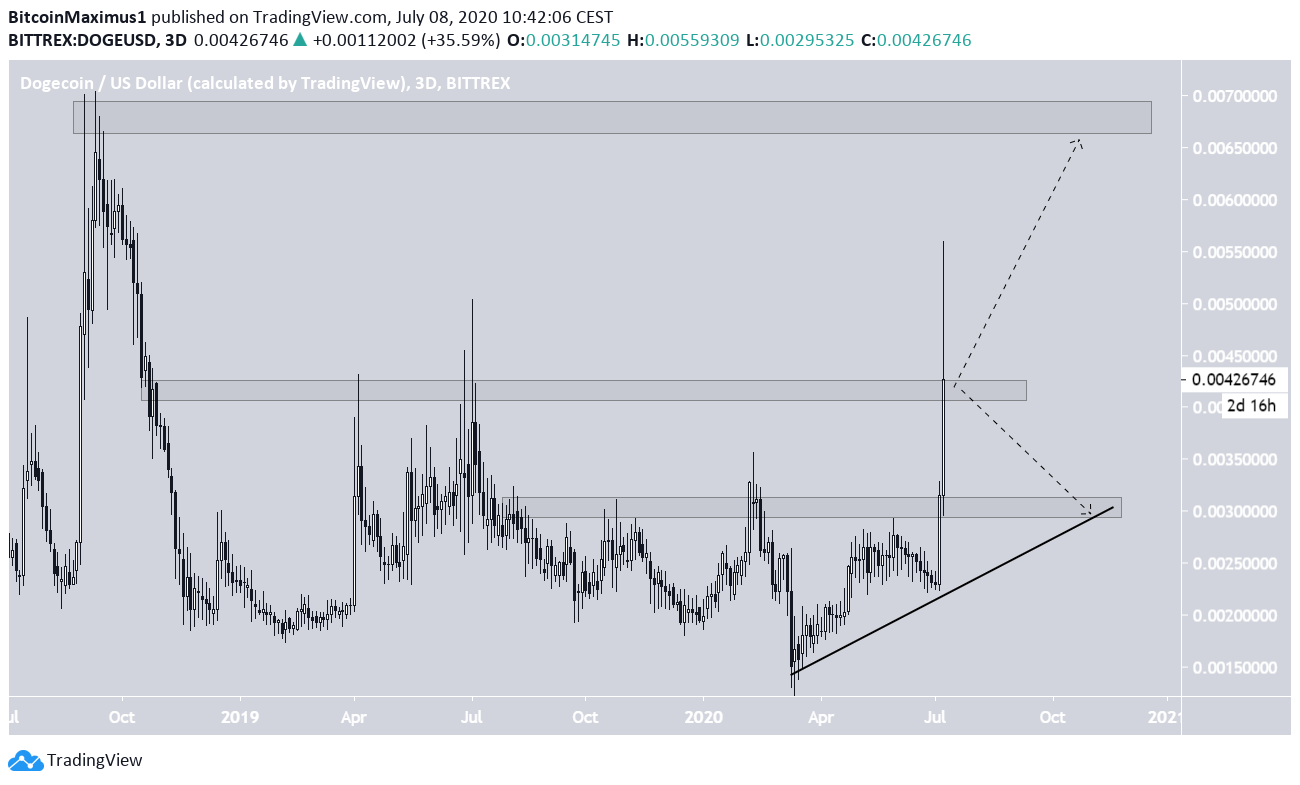
The DOGE/USD chart looks similar to its BTC counterpart, especially in the creation of a very long upper-wick.
The price is also currently trading inside the $0.0042 area, which previously acted as a resistance. A successful close above it would likely take the price towards the next resistance area at $0.0068, while failure to do so would cause a decrease towards the $0.003 support area and the current ascending support line.
At the time of press, there is little in the way of definitive signals to predict which is more likely.