
On July 5, 2019, the DOGE price reached a high of 44 satoshis. A downward move ensued. On September 4, DOGE reached a low of 23 satoshis. After trading near this level for the first half of September, it seemingly initiated an upward move on September 17.
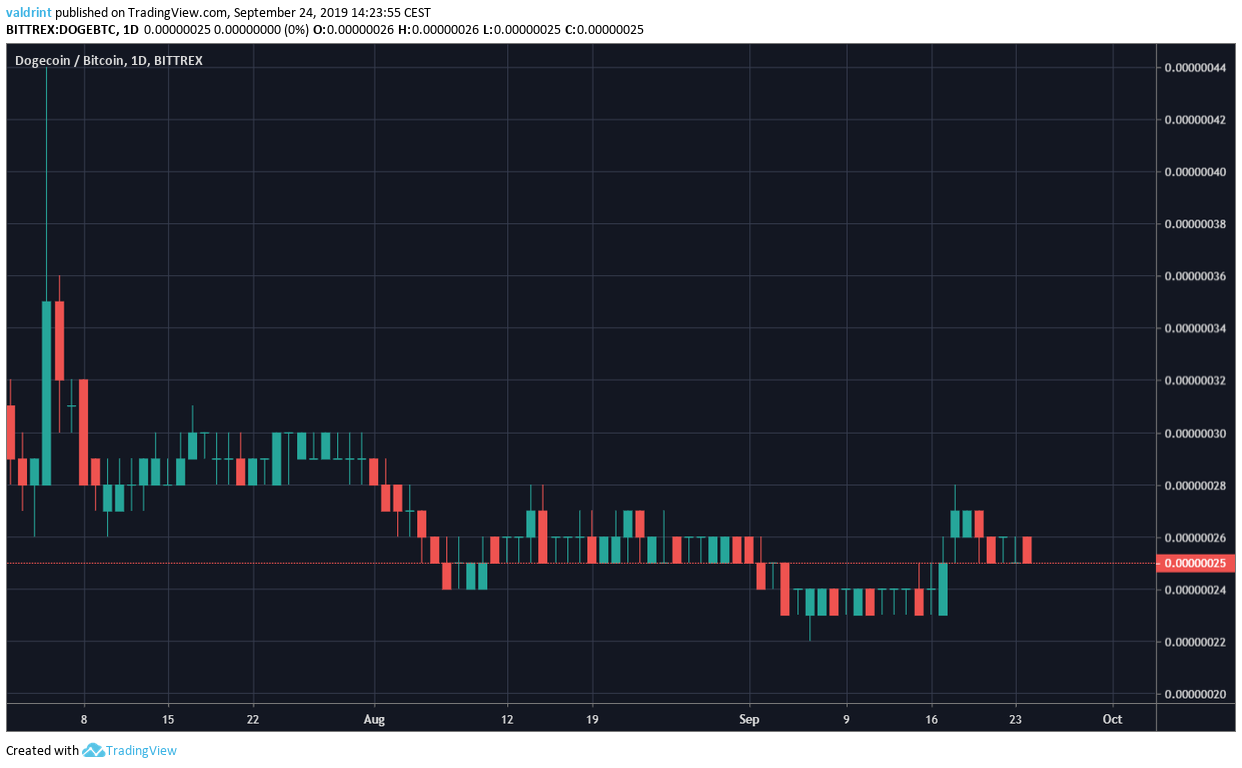
Will DOGE continue to increase? Keep reading below if you want to find out.
For our previous analysis, click here.
Dogecoin Price: Trends and Highlights for September 24
- DOGE/BTC broke out from a descending wedge.
- Support areas are found at 23 and 16 satoshis.
- Resistance areas are found at 28. 30 and 35 satoshis
- The breakout was preceded by bullish divergence.
- The 10- and 20-day moving averages have made a bullish cross.
Wedge Breakout
Dogecoin has been trading inside a descending wedge since May 30.

On September 17, it initiated an upward move and broke out.
Afterwards, it decreased slightly in order to validate the previous resistance line.
Support Areas
Looking at the weekly chart we can identify two support areas.
They are found at 23 and 16 satoshis, respectively.
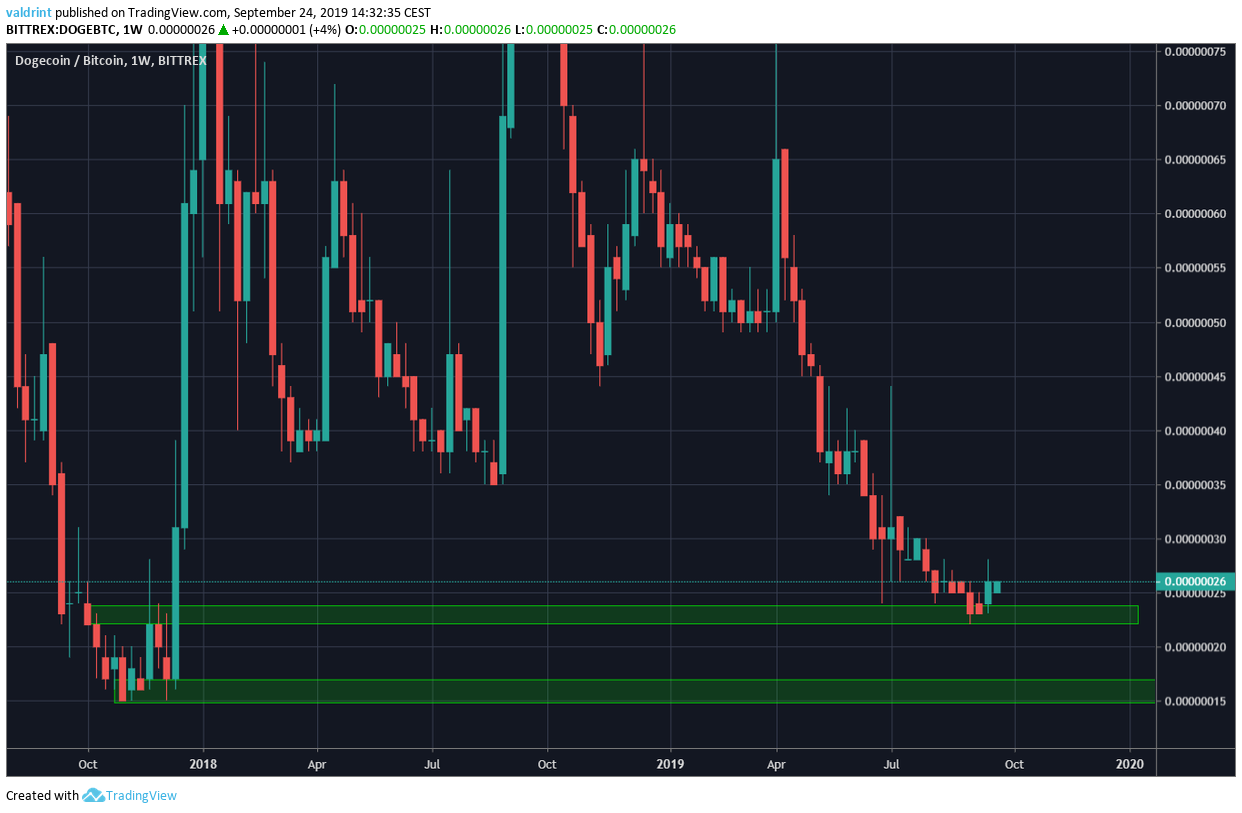
The price initiated the breakout once it reached the support area at 16 satoshis.
Legitimate Breakout
The legitimacy of the breakout is increased once we incorporate the daily MACD and RSI into the analysis.
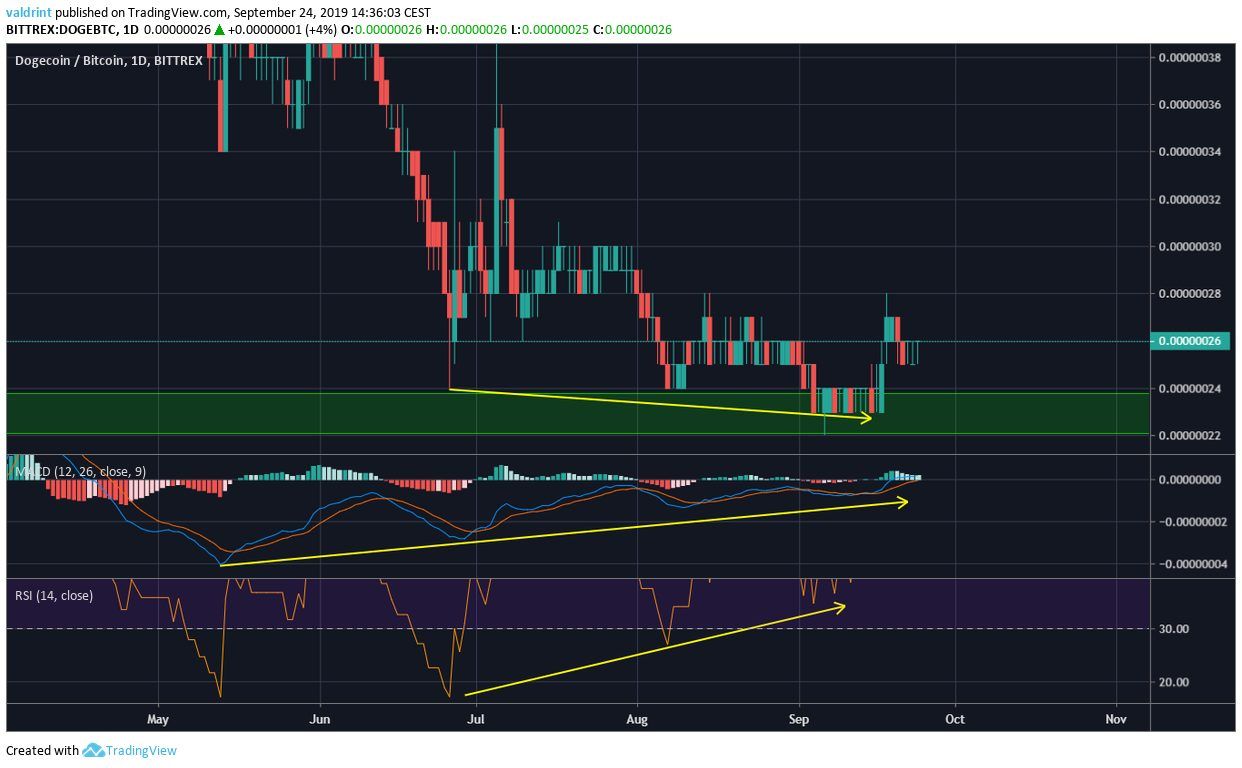
Both of them had generated very noteworthy bullish divergence prior to the breakout.
The significance of the breakout is further increased once we incorporate daily moving averages (MA) into the analysis.
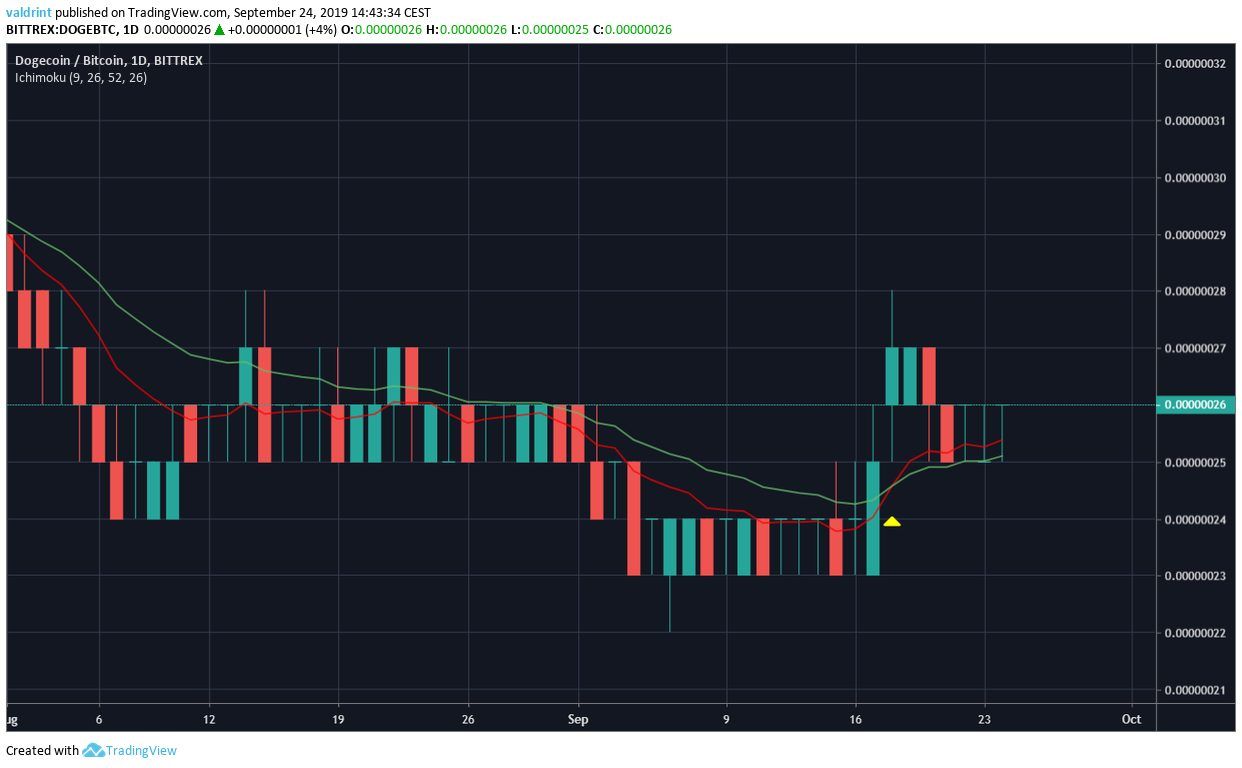
The 10- and 20-day MAs made a bullish cross on September 17.
The price has been trading above both since.
Additionally, it is worth mentioning that the previous bullish cross occurred in the beginning of April.
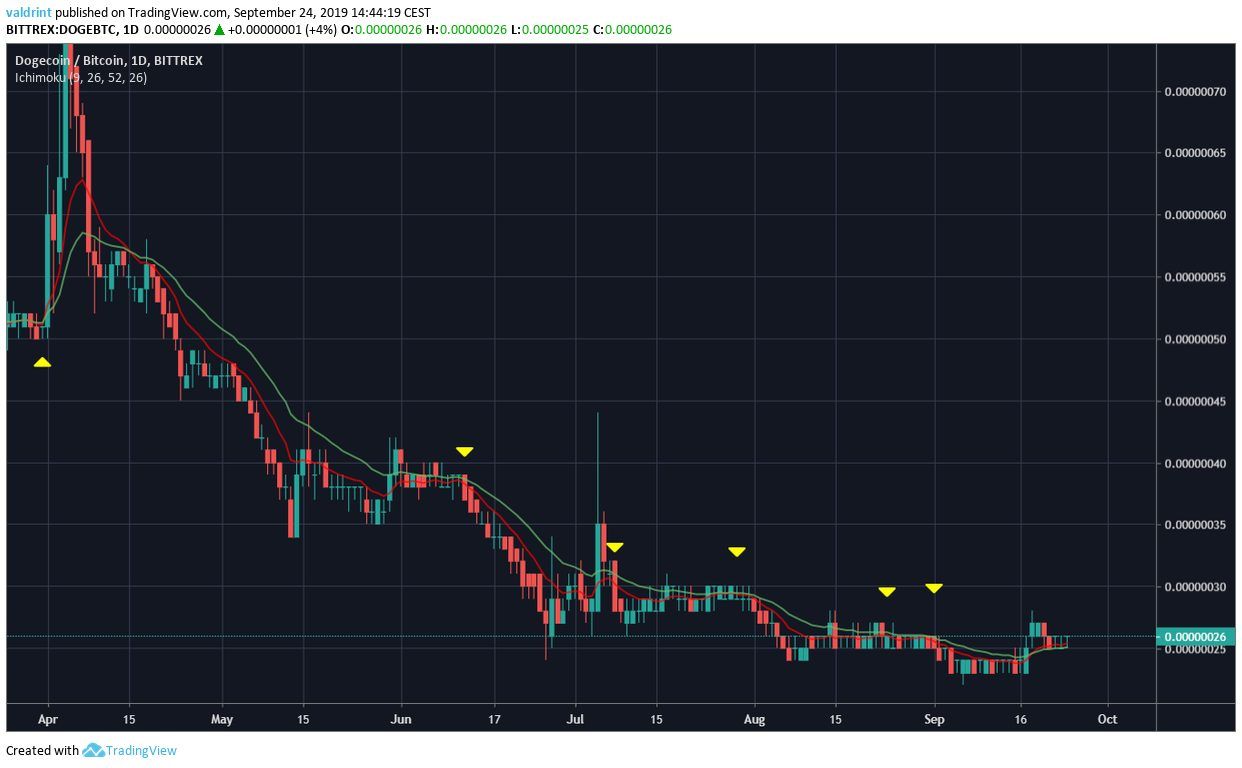
Since then, there have been five instances of failed attempts at creating bullish crosses.
This also adds legitimacy to the current movement, since DOGE was finally successful in initiating a bullish cross.
Future Movement
An outline of possible future price movement along with three resistance areas is given below.
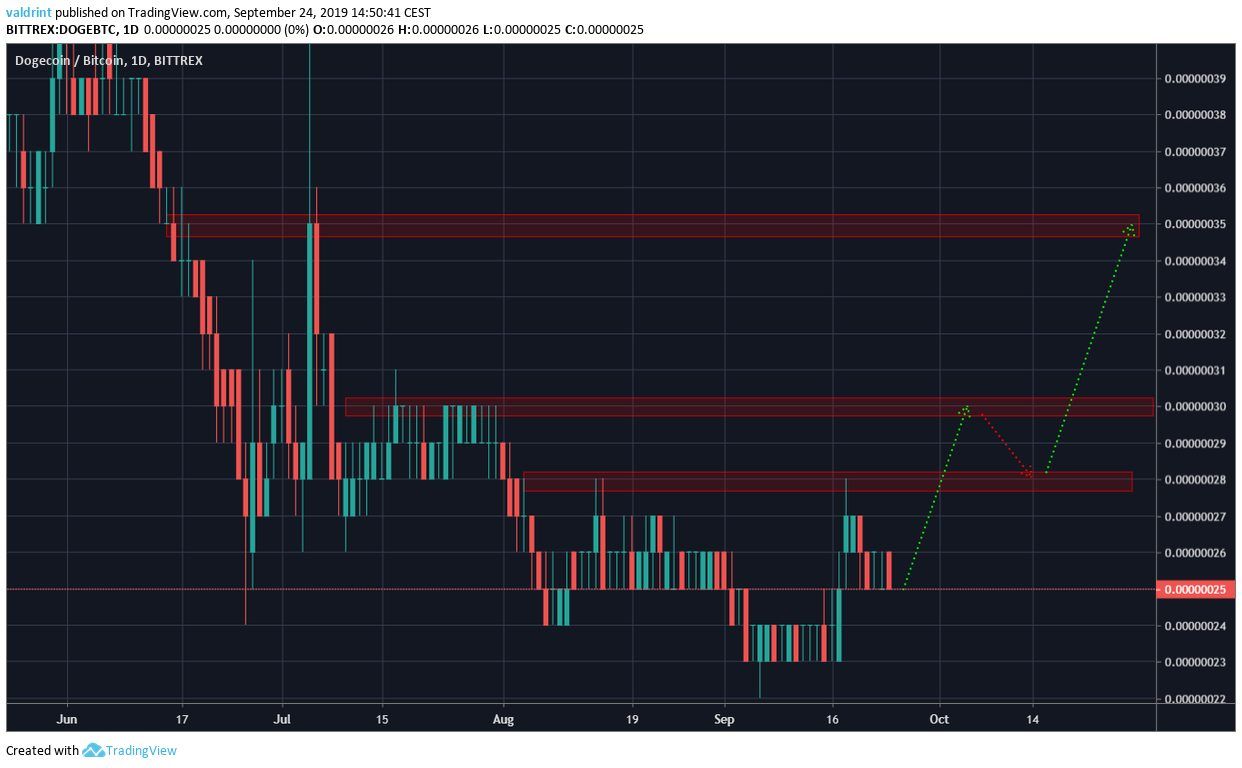
The resistance areas are found at 28, 30 and 35 satoshis.
According to our analysis, DOGE is likely to reach the final resistance area at 35 satoshis.
However, it will probably initiate short-term reversal once it reaches the resistance areas at 30 and 29 satoshis.
Dogecoin Price Summary
The Dogecoin price recently broke out from a descending wedge.
According to our analysis, it is likely to continue increasing and eventually reach the farthest resistance area at 35 satoshis.
For hypothetical trading purposes, we consider DOGE a buy near the current price of 26 satoshis.
Do you think DOGECOIN will reach the resistance area? Let us know in the comments below.
Disclaimer: This article is not trading advice and should not be construed as such. Always consult a trained financial professional before investing in cryptocurrencies, as the market is particularly volatile.
Images are courtesy of Shutterstock, TradingView.
