Dogecoin (DOGE) has broken down from an important horizontal support level, but is trading inside a bullish pattern and showing bullish reversal signs.
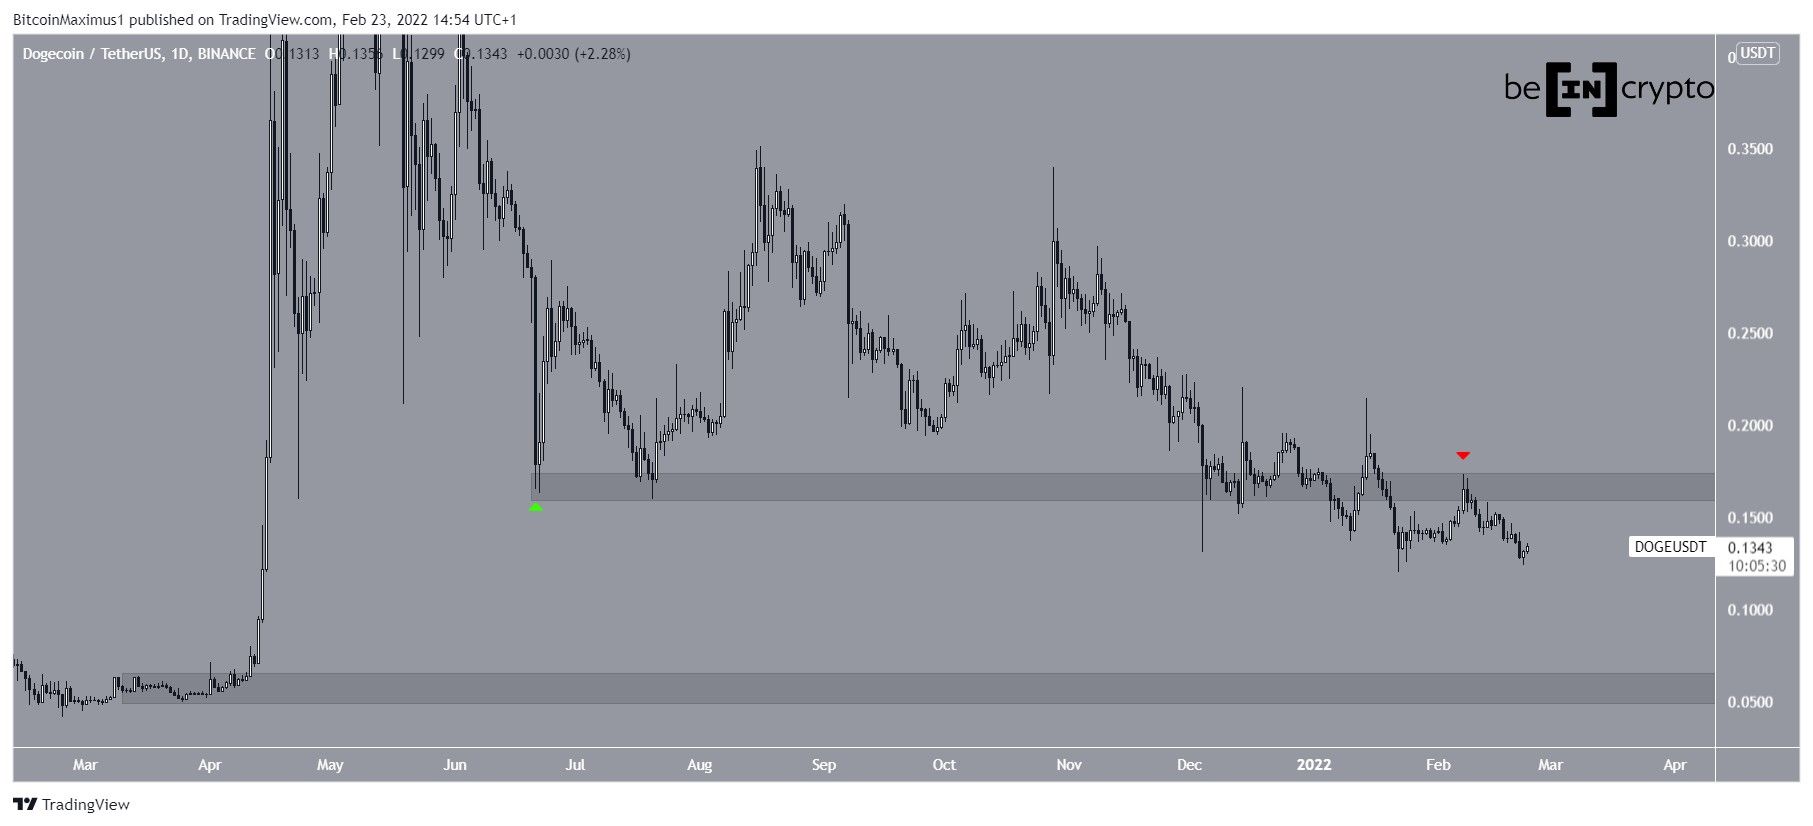
Since June 21 (green icon), DOGE has been trading above the $0.17 horizontal support area, initiating several bounces in the process. However, it broke down definitively on Jan 20 and proceeded to validate the area as resistance on Feb 8.
When looking at the long-term movement, there is no clear horizontal support area until $0.057. This level has not been reaches since April 2021.
Bullish DOGE pattern
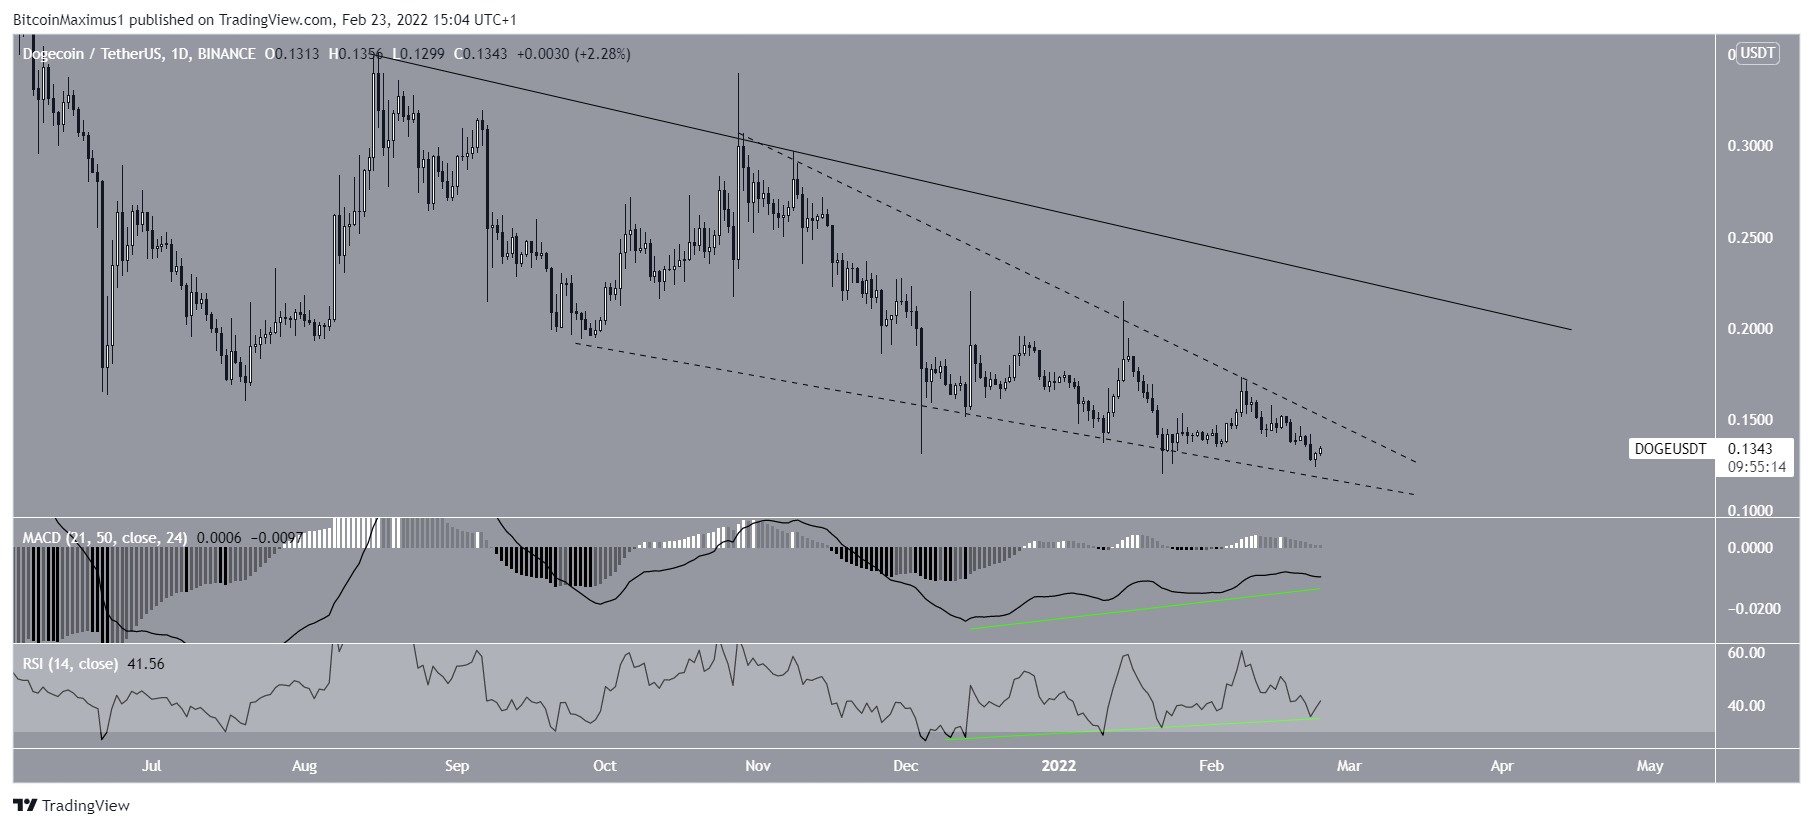
A closer look at the movement shows that DOGE has been following a descending resistance line since Aug 15. More importantly, it has been trading inside a descending wedge (dashed) since Oct 28.
The descending wedge is considered a bullish pattern. Therefore, a breakout from it would be the most likely scenario.
Furthermore, there is a very significant bullish divergence that has developed in both the RSI and MACD. This is an occurrence that very often precedes bullish trend reversals. Therefore, it supports the scenario in which DOGE breaks out from the wedge.
If the breakout occurs, the next resistance would be at $0.20, aligning with the long-term descending resistance line.
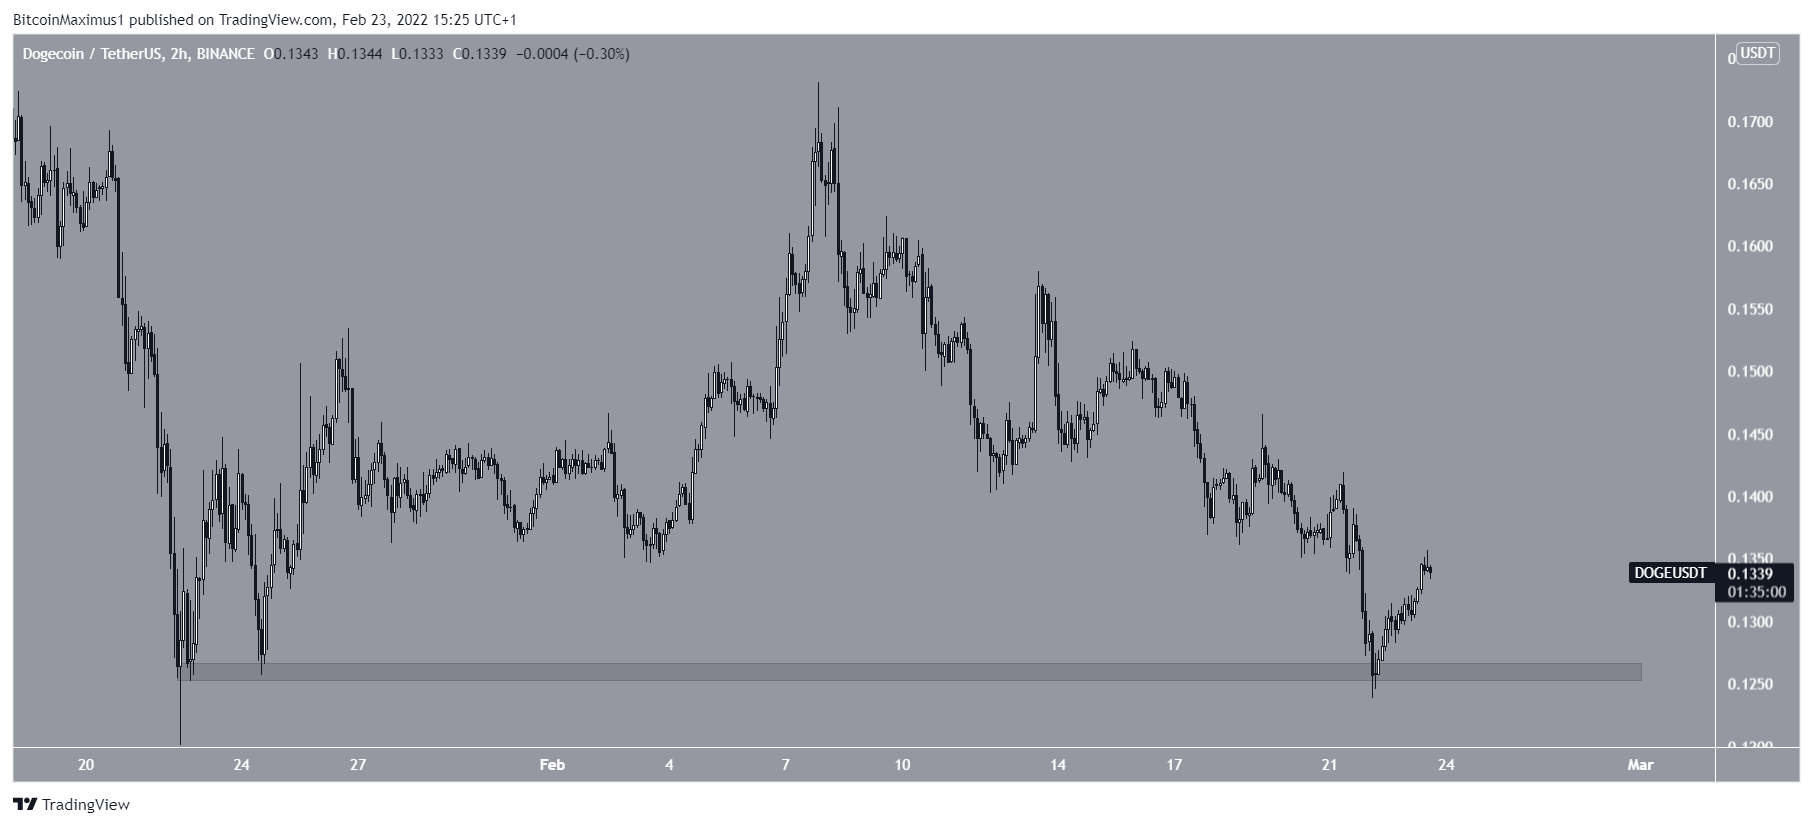
The two-hour chart shows that DOGE has bounced at the $0.125 horizontal support area. This same level initiated the previous upward movement on Jan 22. Relative to that price, this creates a triple bottom, which is also considered a bullish pattern.
Wave count analysis
Cryptocurrency trader @JacobEmmerton stated that DOGE is in wave four of a five wave upward movement.
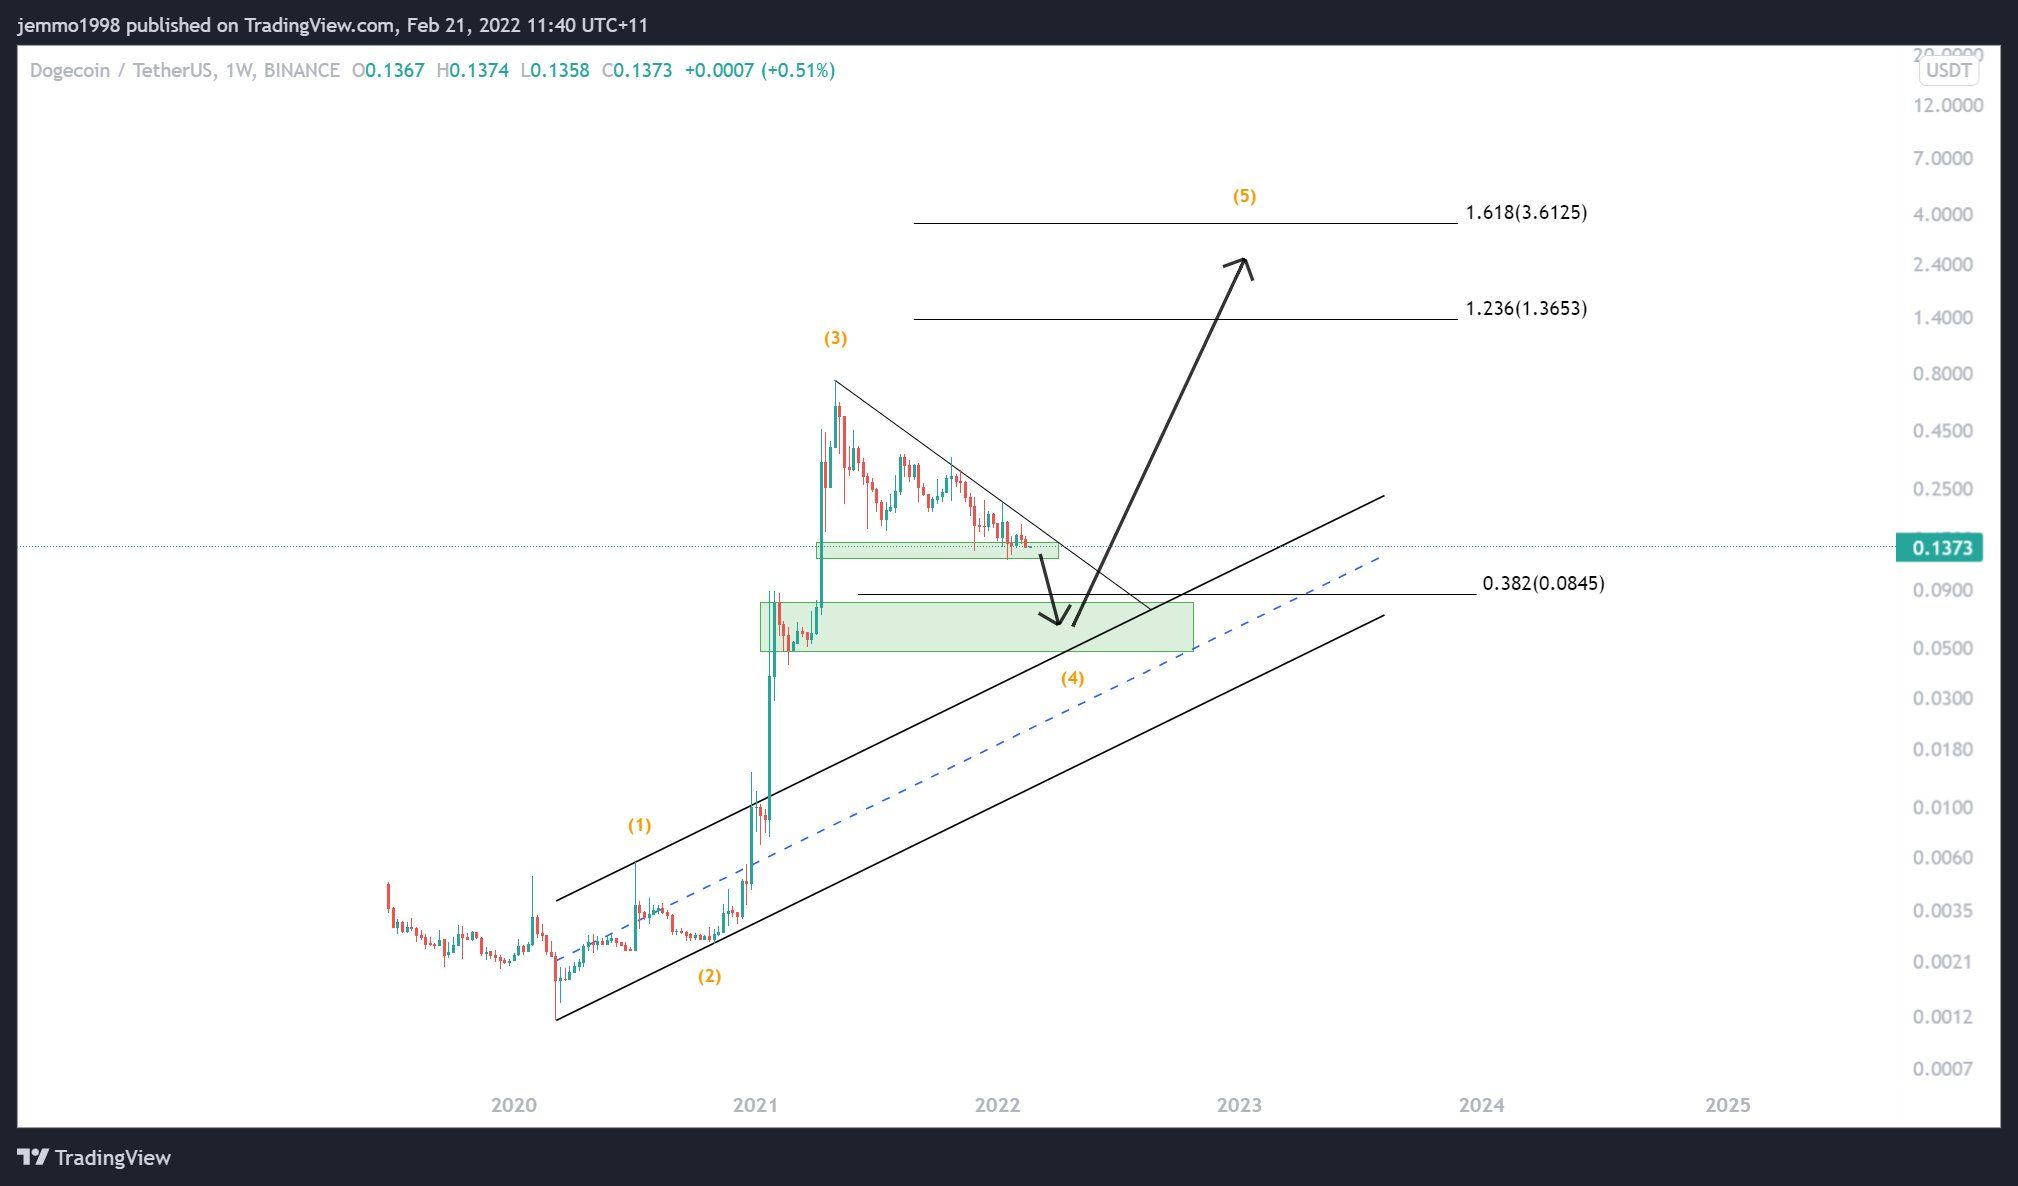
The most likely wave count does suggest that DOGE is in wave four of a five wave upward movement. However, the exact shape of wave four remains unclear.
As stated in the first section, the next closest support area is at $0.065. This also coincides with the resistance line of an ascending parallel channel connecting waves one and two. Therefore, it is a potential bottom level for the current correction.
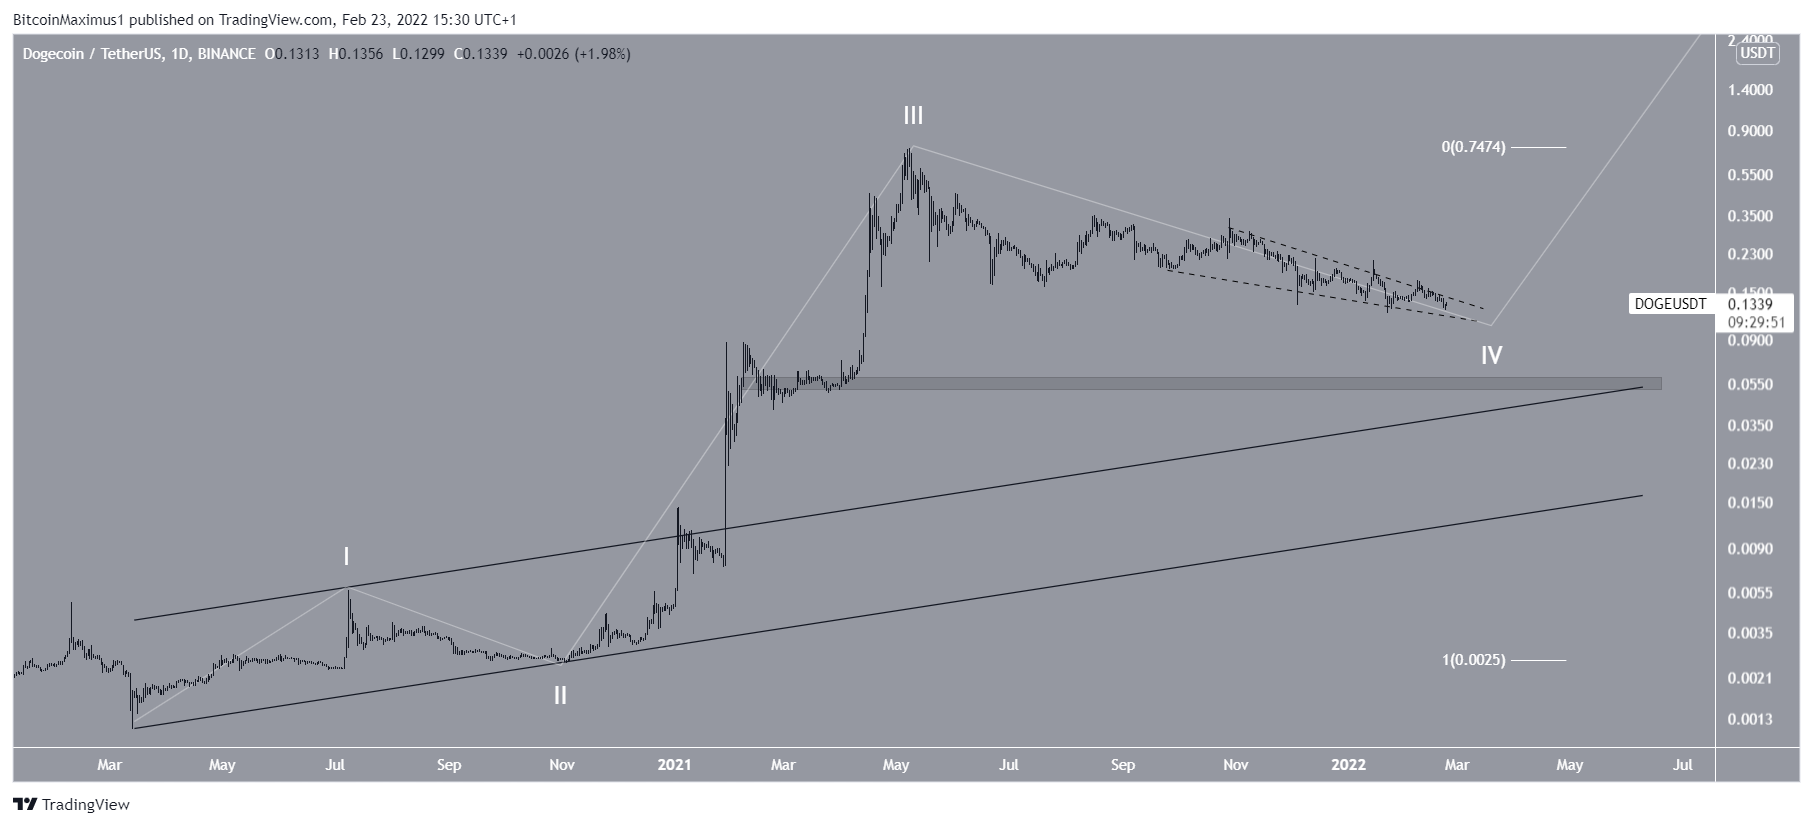
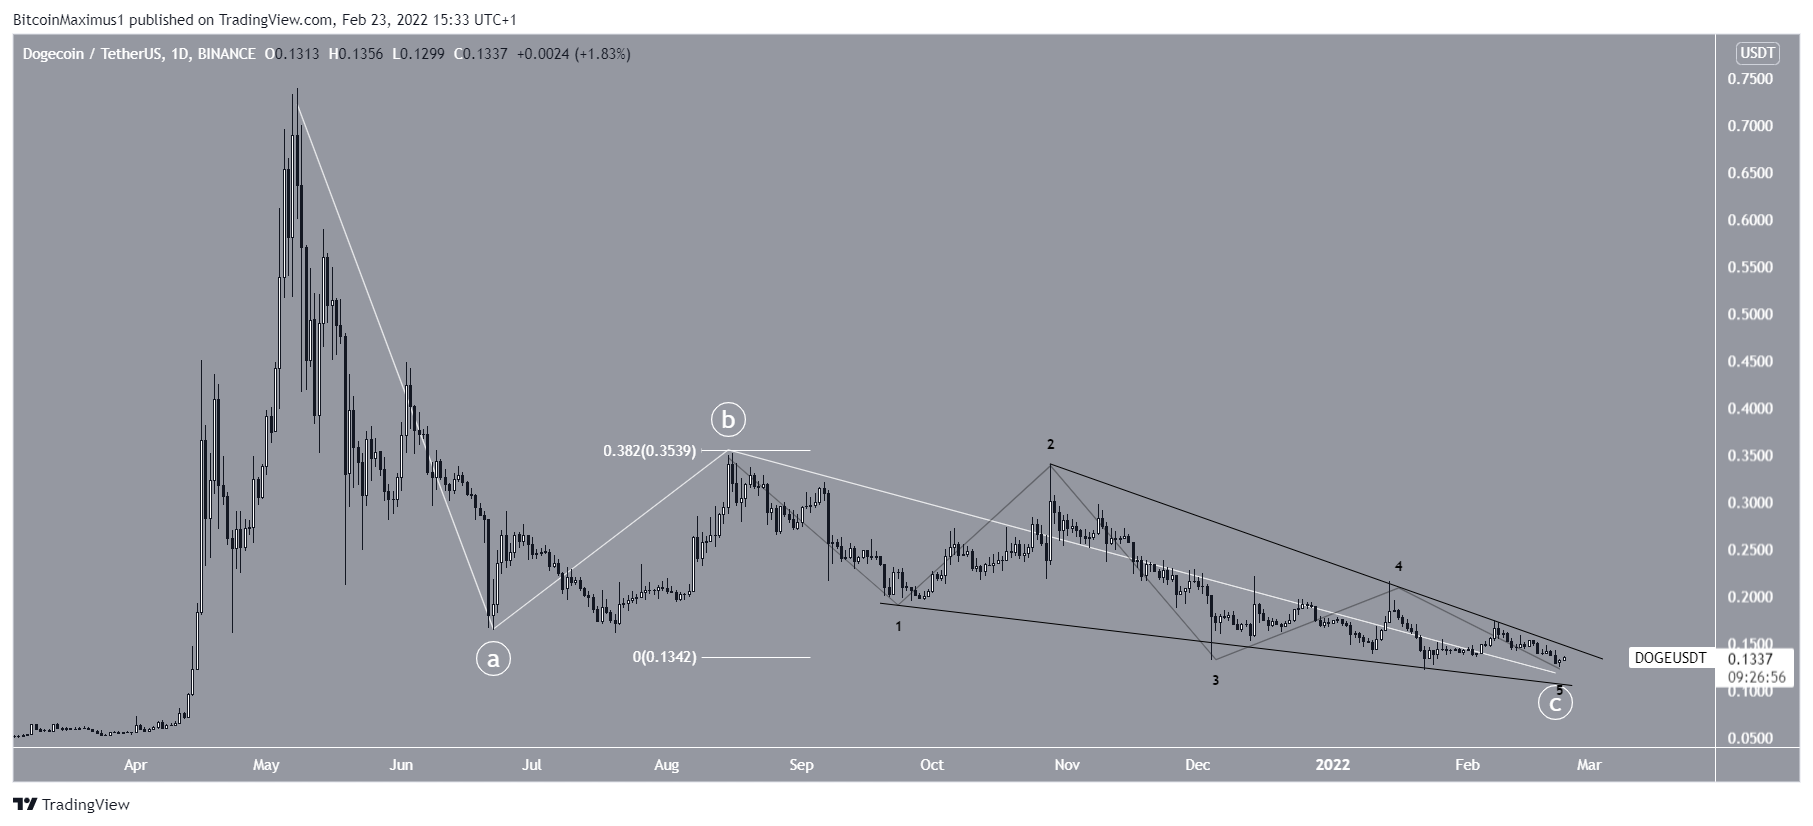
However, a closer look shows a possibly completed A-B-C corrective structure (white), in which waves A:C had a 1:0.382 ratio. Wave C took the shape of an ending diagonal (black).
Therefore, it is possible that DOGE will break out from the current wedge and reclaim the $0.179 area afterwards. However, if it does not, the most likely scenario would suggest that a drop all the way to $0.065 will transpire.