
Dogecoin (DOGE) price could soon break out from a long-term descending resistance line. Nonetheless, the short-term movement prior to the eventual breakout is still inconclusive.
DOGE price has been falling underneath a descending resistance line since reaching an all-time high price of $0.739 in May 2021. The downward movement has so far led to a low of $0.049 in June 2022. Initially, it seemed that the decrease caused a breakdown below the $0.056 horizontal support area. However, the price bounced and created a long lower wick, validating the area as support (green circle).
Until now, the line has been validated five times (red icons), increasing its legitimacy. Due to the high number of touches and the long time in which the line has been in place, a breakout above it would likely cause an acceleration of the upward Dogecoin price movement. It is worth noting that the resistance line is only visible in the logarithmic chart.
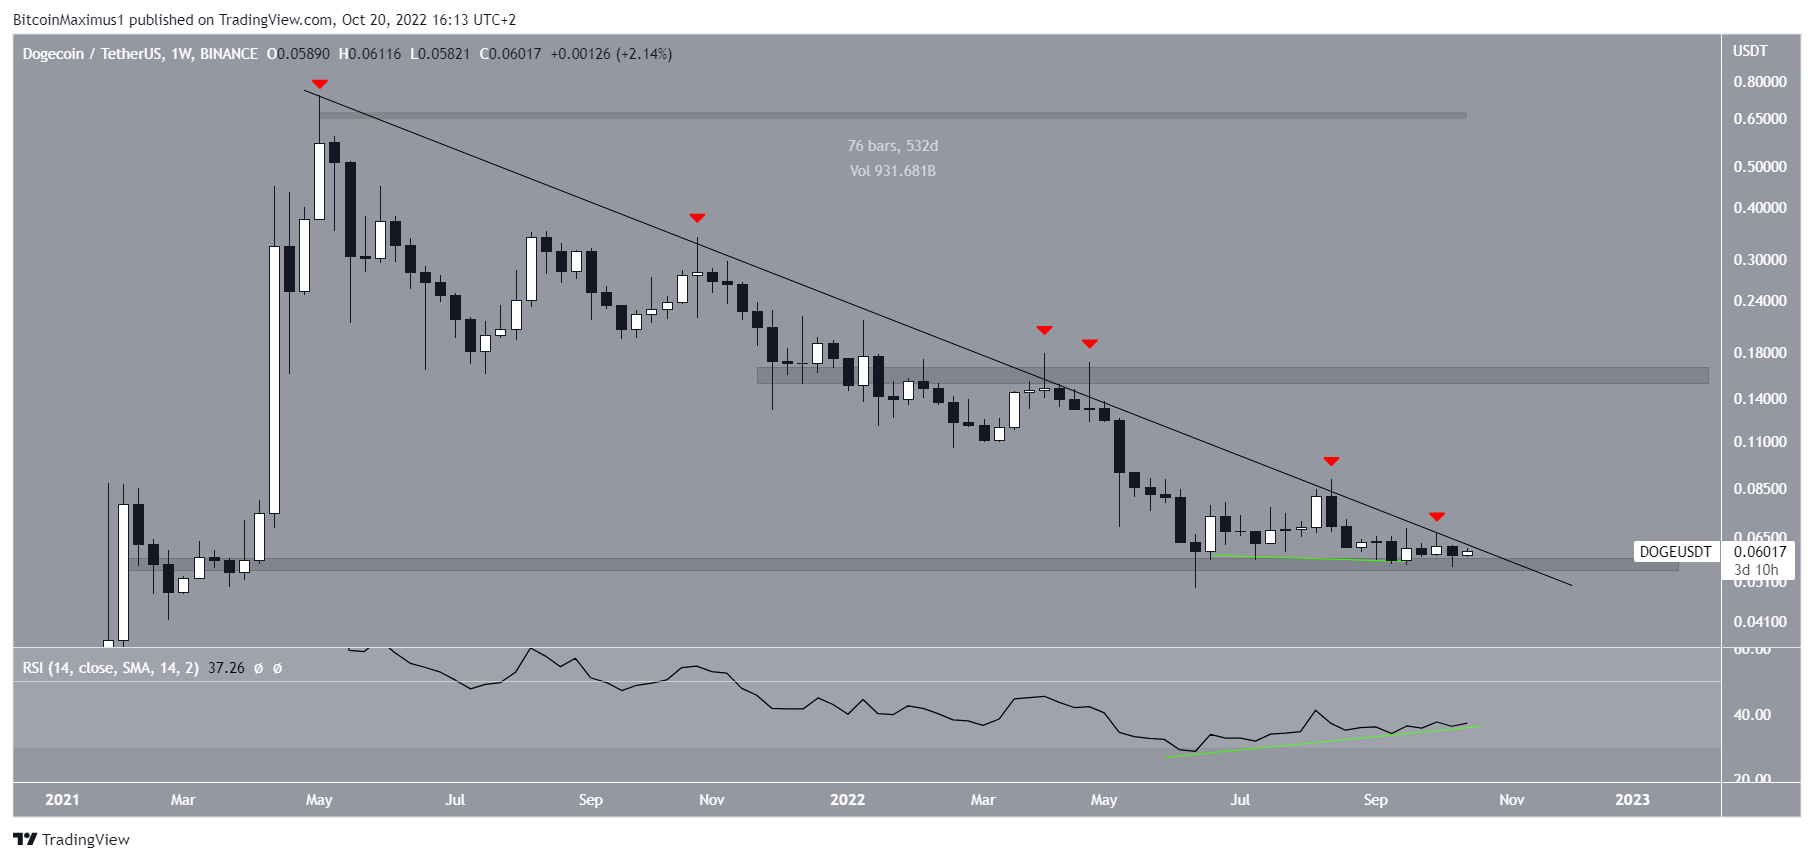
The weekly RSI reading supports the possibility of a breakout. The indicator has been generating a bullish divergence (green line) since the beginning of June. The trendline of the divergence is still intact.
For these reasons, a DOGE price breakout seems likely. If one occurs, Dogecoin price could increase rapidly towards the closest resistance level at $0.16.
Dogecoin price consolidates at $0.06
Despite the bullish weekly timeframe DOGE price prediction, technical analysis readings from shorter timeframes are still unclear.
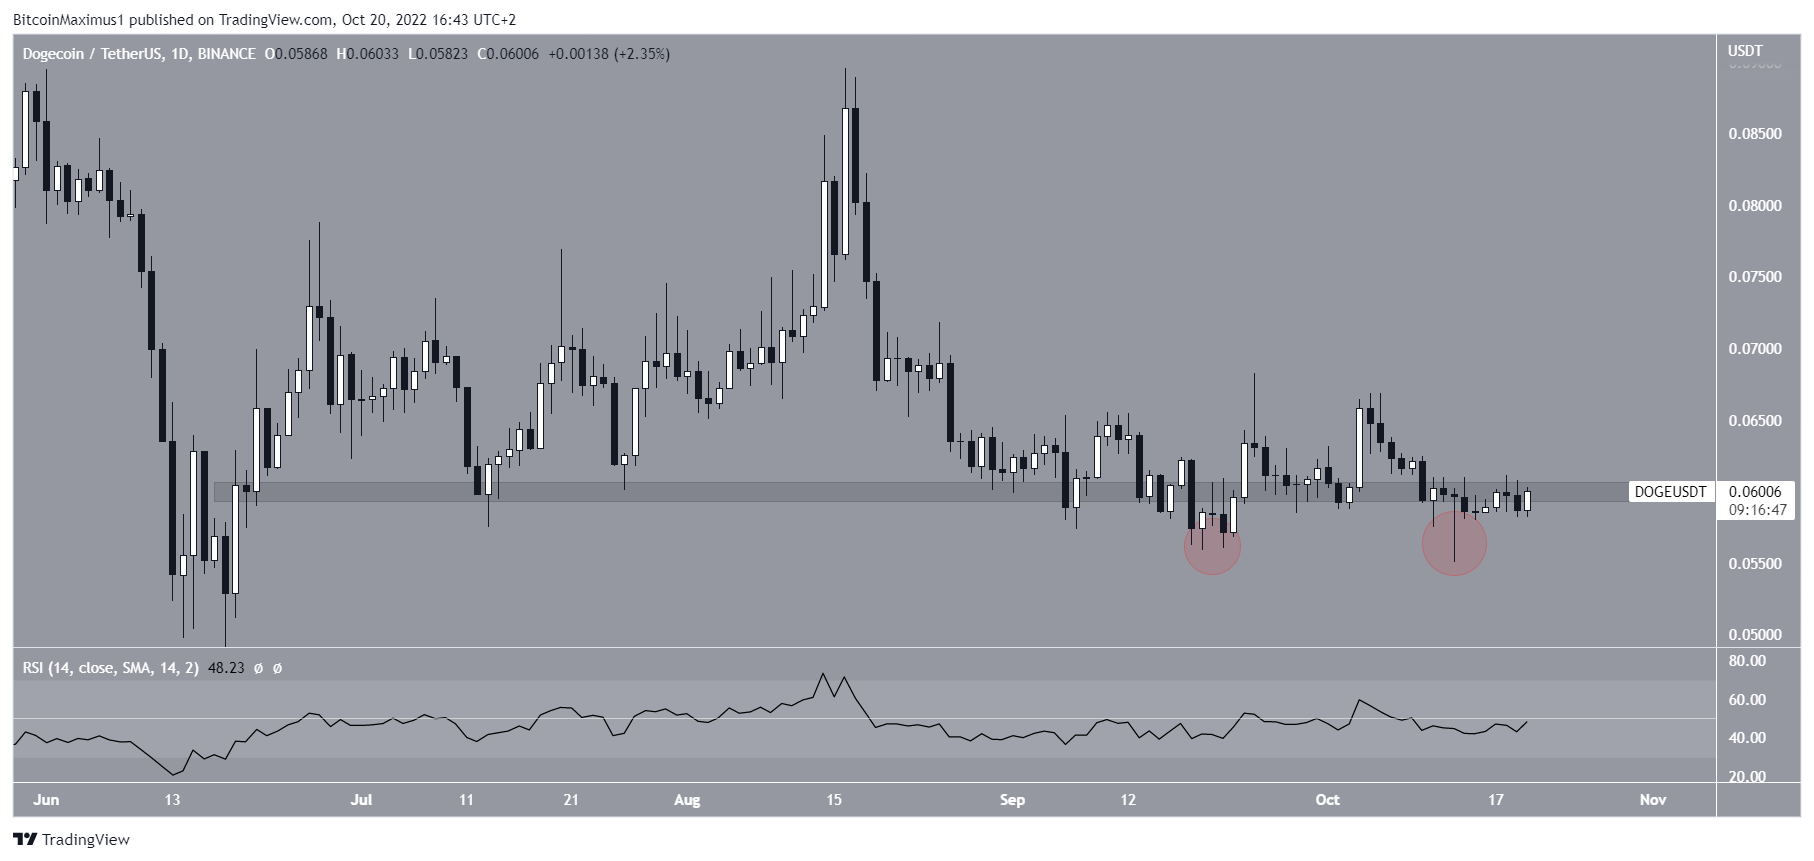
The daily timeframe confirms the legitimacy of the $0.06 area. With the exception of two deviations, the area has acted as support since June 15. Currently, it the DOGE price is trading inside the area. So, it is unclear if the area is acting as support or resistance.
Additionally, the daily RSI is freely moving above and below the 50 line. This could be a sign of an undetermined trend and aligns with the price action.
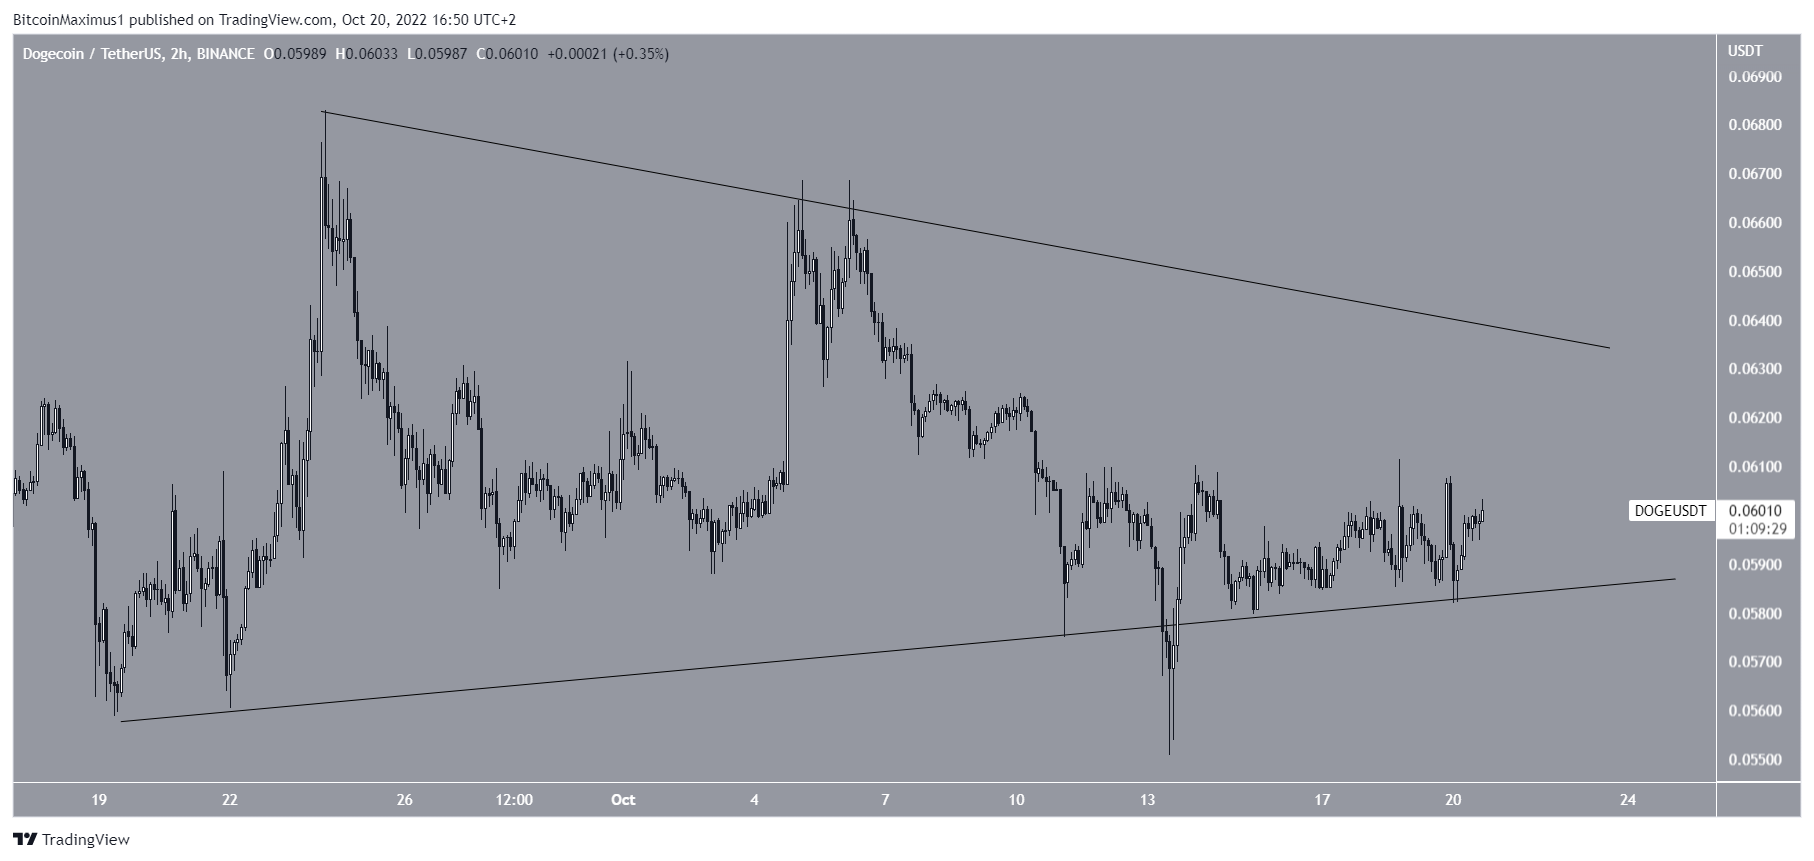
Finally, the two-hour chart shows that the Dogecoin price is trading inside a symmetrical triangle. The symmetrical triangle is considered a neutral pattern, fitting perfectly with the inconclusive price action and technical indicator readings.
As a result, whether the DOGE price will break out or down from the triangle will likely determine the direction of the short-term trend.
Long-term trend bullish while short-term one undetermined
To conclude, the long-term Dogecoin price forecast is bullish due to the bullish divergence in the weekly RSI and multiple attempts at breaking out from the long-term resistance line. As a result of these readings, an eventual breakout from the line is expected.
However, the direction of the short-term movement is still undetermined. A weekly price close below $0.06 would invalidate the bullish hypothesis and indicate that new lows are expected instead.
For the latest BeInCrypto Bitcoin (BTC) and crypto market analysis, click here
Disclaimer: BeInCrypto strives to provide accurate and up-to-date information, but it will not be responsible for any missing facts or inaccurate information. You comply and understand that you should use any of this information at your own risk. Cryptocurrencies are highly volatile financial assets, so research and make your own financial decisions.
