
BeInCrypto takes a look at the price movement for seven different altcoins, including Dogecoin (DOGE), which has increased by 15% today.
BTC
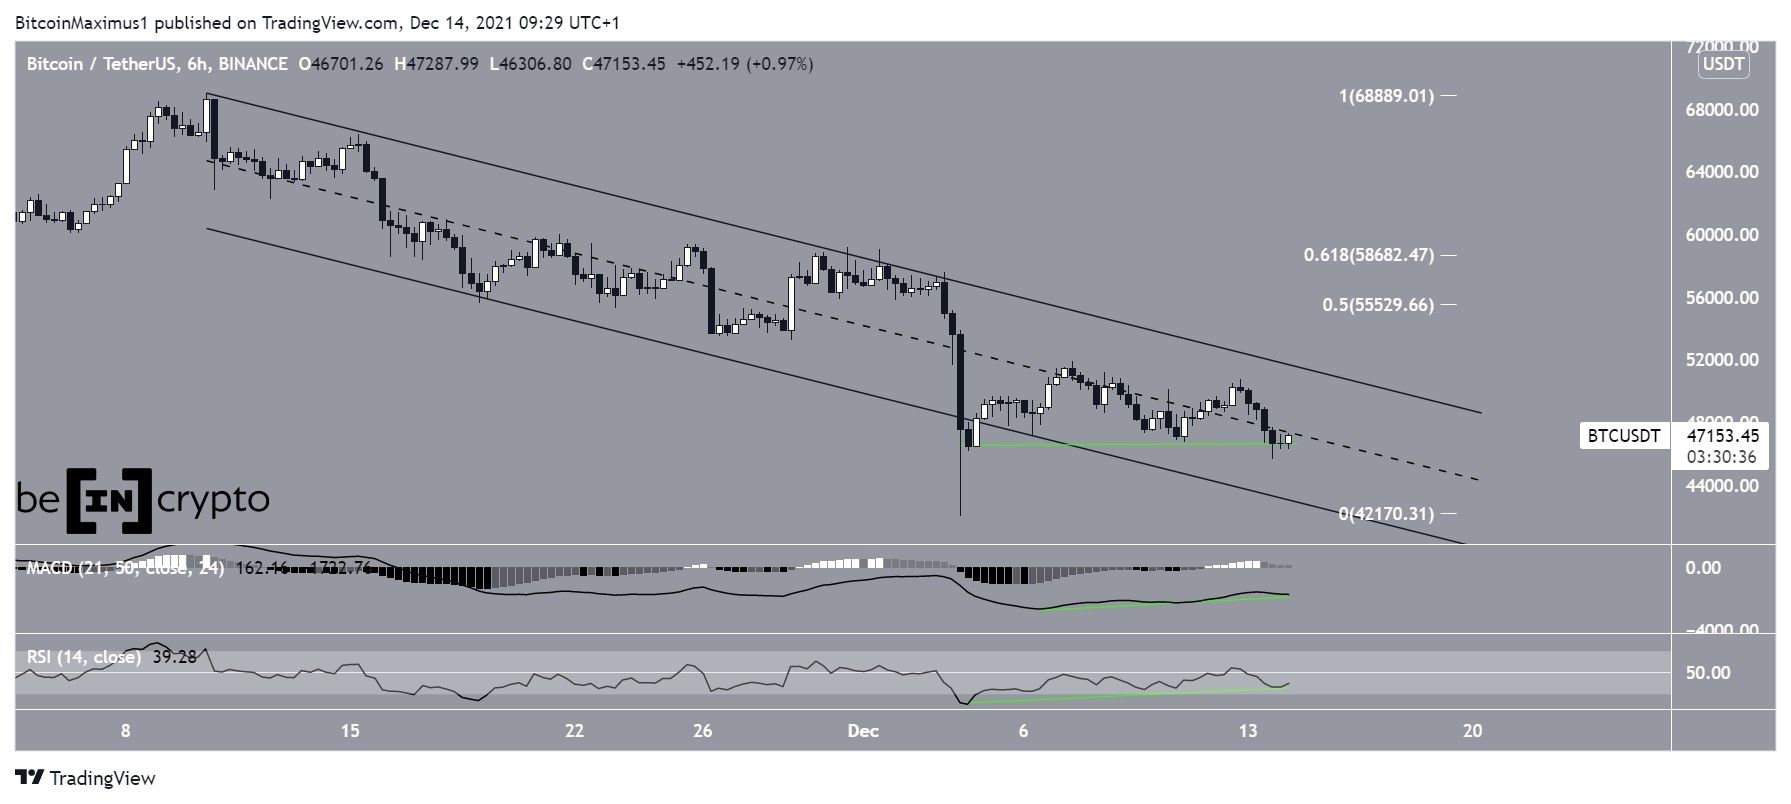
Bitcoin (BTC) has been trading inside a descending parallel channel since Nov 10, when it reached an all-time high price of $69,000.
So far, it has reached a low of $42,000, doing so on Dec 4. While this initially caused a breakdown from the channel, BTC reclaimed it shortly afterwards.
Both the RSI and MACD have generated bullish divergences. This is a bullish occurrence that often precedes bullish trend reversals.
If a breakout from the channel transpires, the closest resistance area would be between $55,530 and $58,670. This area is created by the 0.5-0.618 Fib retracement resistance levels.
ETH
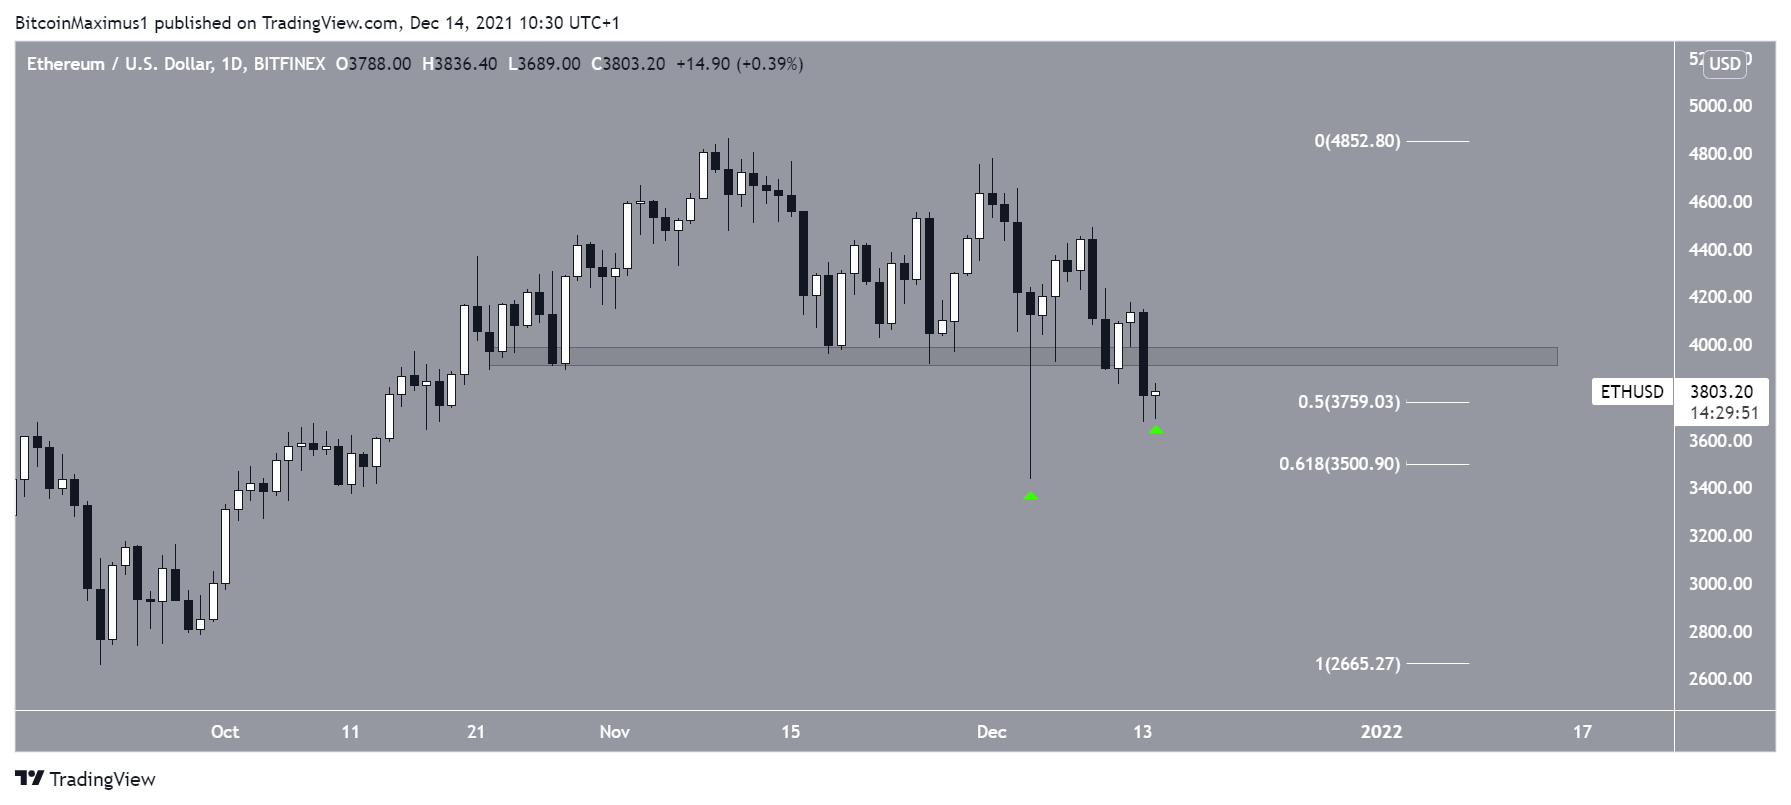
Ethereum (ETH) has also been decreasing since Nov 10, when it reached an all-time high price of $4,864. On Dec 1, it created a lower high and resumed its descent.
So far, it has bounced at both the 0.5 and 0.618 Fib retracement support levels (green icons).
While the bounces and validations of support are considered bullish, ETH has considerable resistance at $3,950. Until it manages to reclaim it, the trend cannot be considered bullish.
XRP
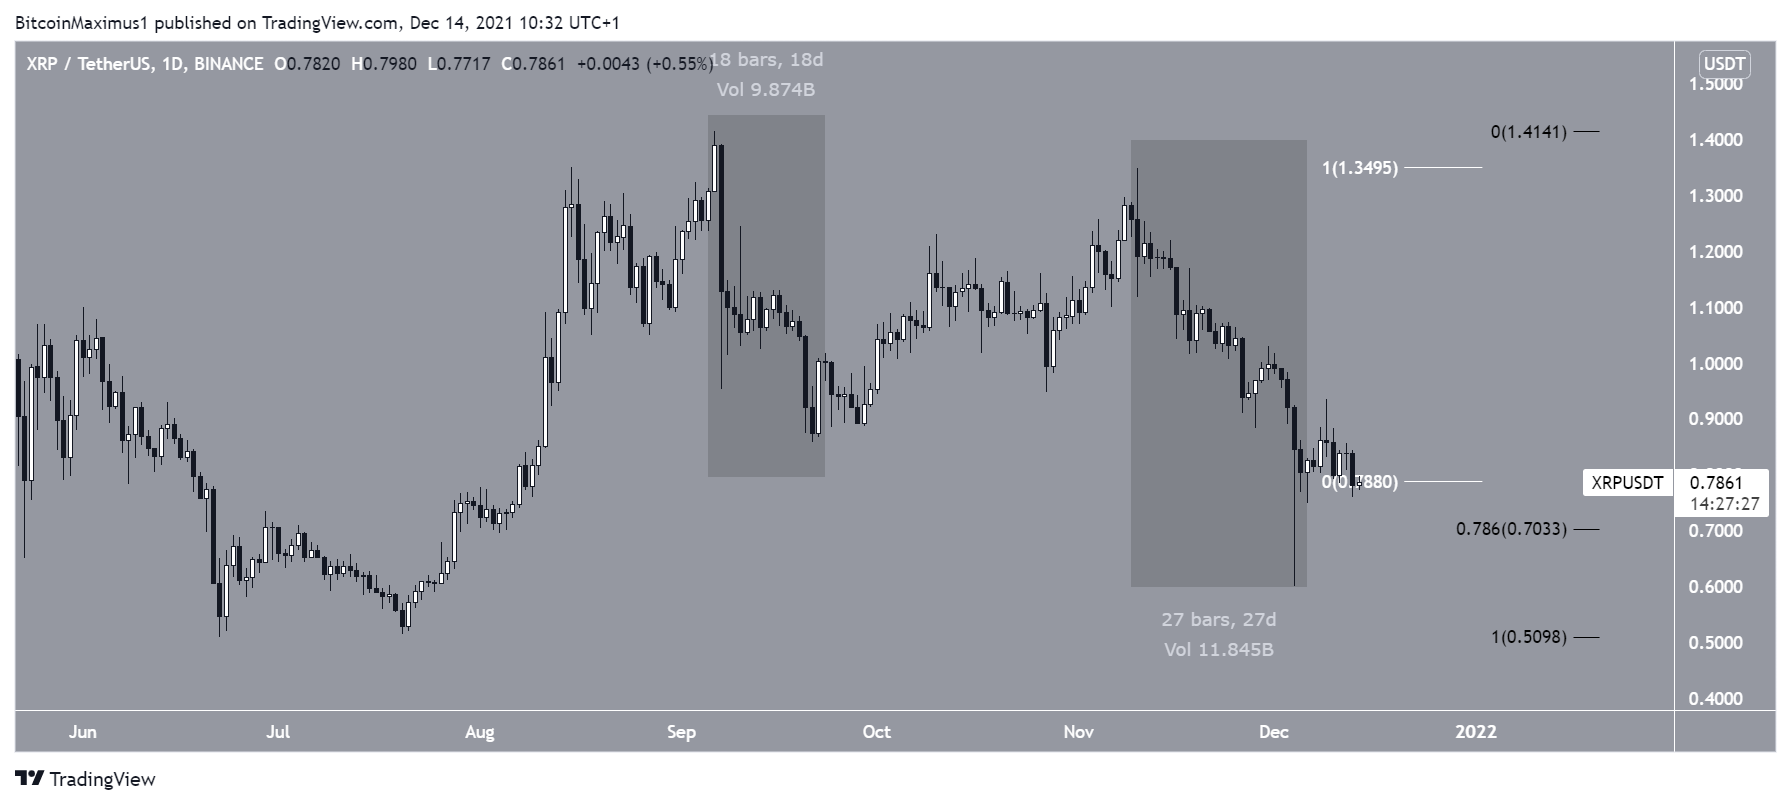
XRP (XRP) has been decreasing since reaching a high of $1.35 on Nov 10. So far, it has reached a low of $0.60, doing so on Dec 4.
Both the Nov 10 and the previous decrease which began on Sept 6 have a 1:1 ratio (white). Furthermore, XRP is trading just above the 0.786 Fib retracement support level (black).
Therefore, according to Fib ratios, it is possible that XRP has reached a low.
EOS
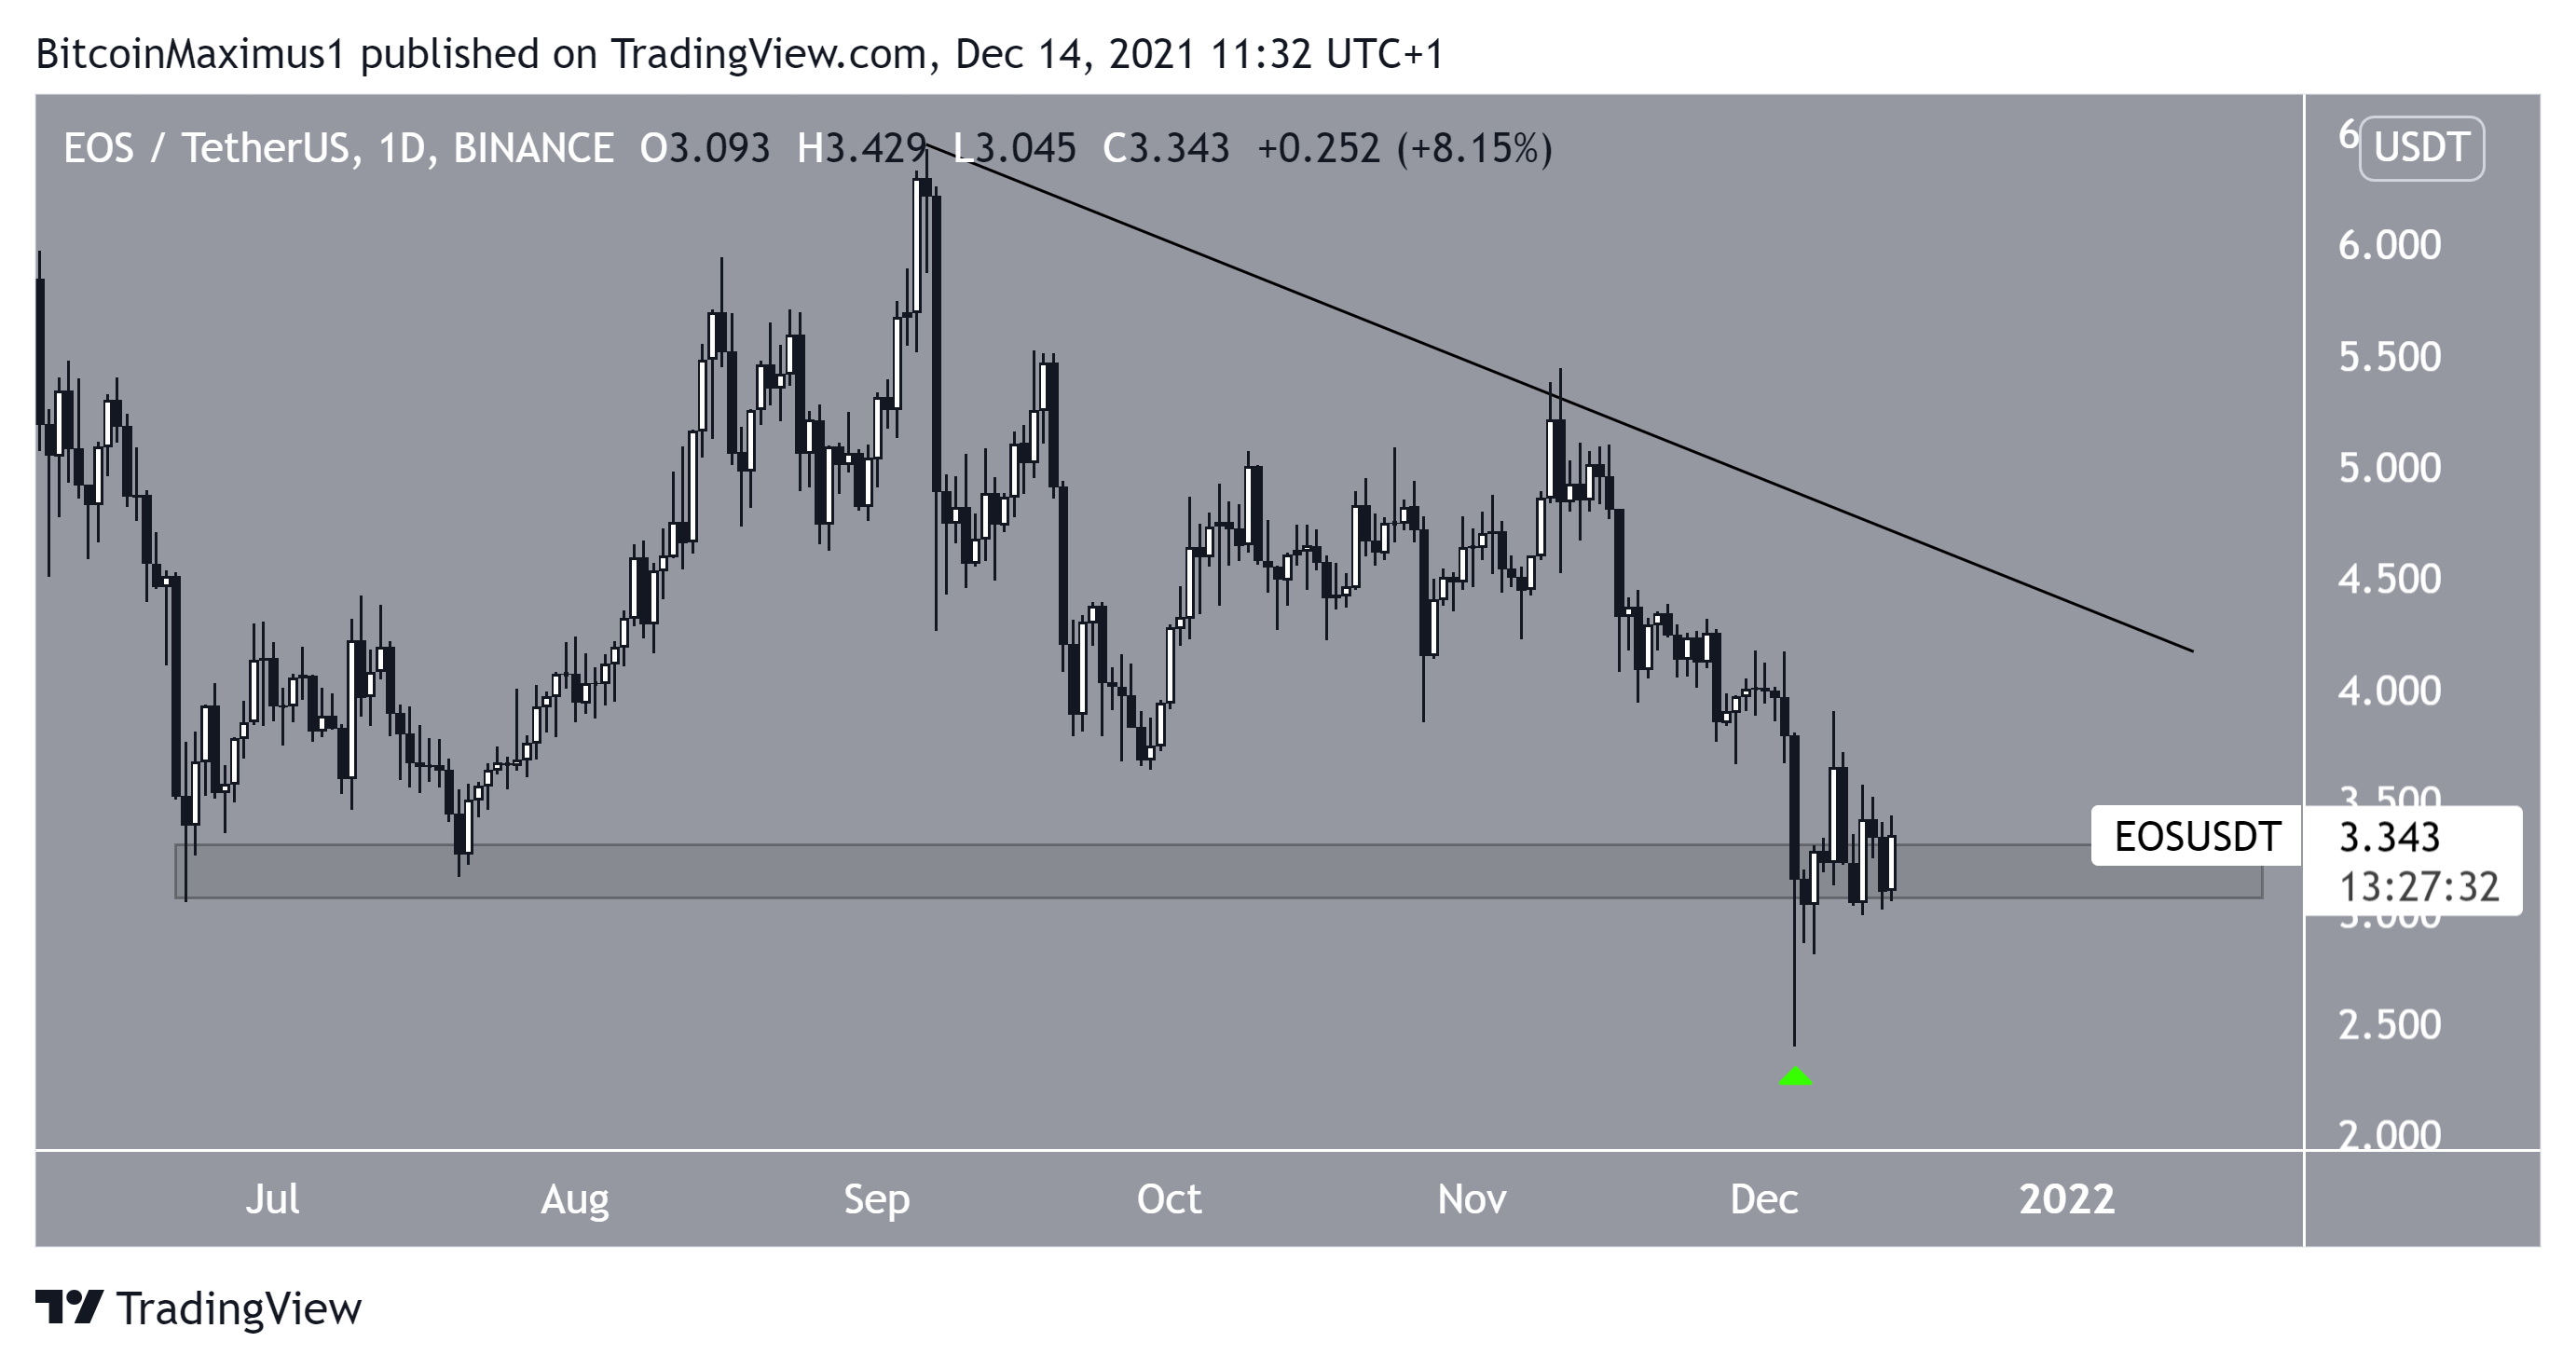
EOS (EOS) has been decreasing alongside a descending resistance line since Sept 6. On Dec 4, it fell to a low of $2.39.
However, it bounced almost immediately afterwards and created a long lower wick, which is considered a sign of buying pressure.
Currently, EOS is attempting to reclaim the $3.20 horizontal area. Doing so would be a very bullish development that would likely lead to an upward movement to the resistance line at $4.
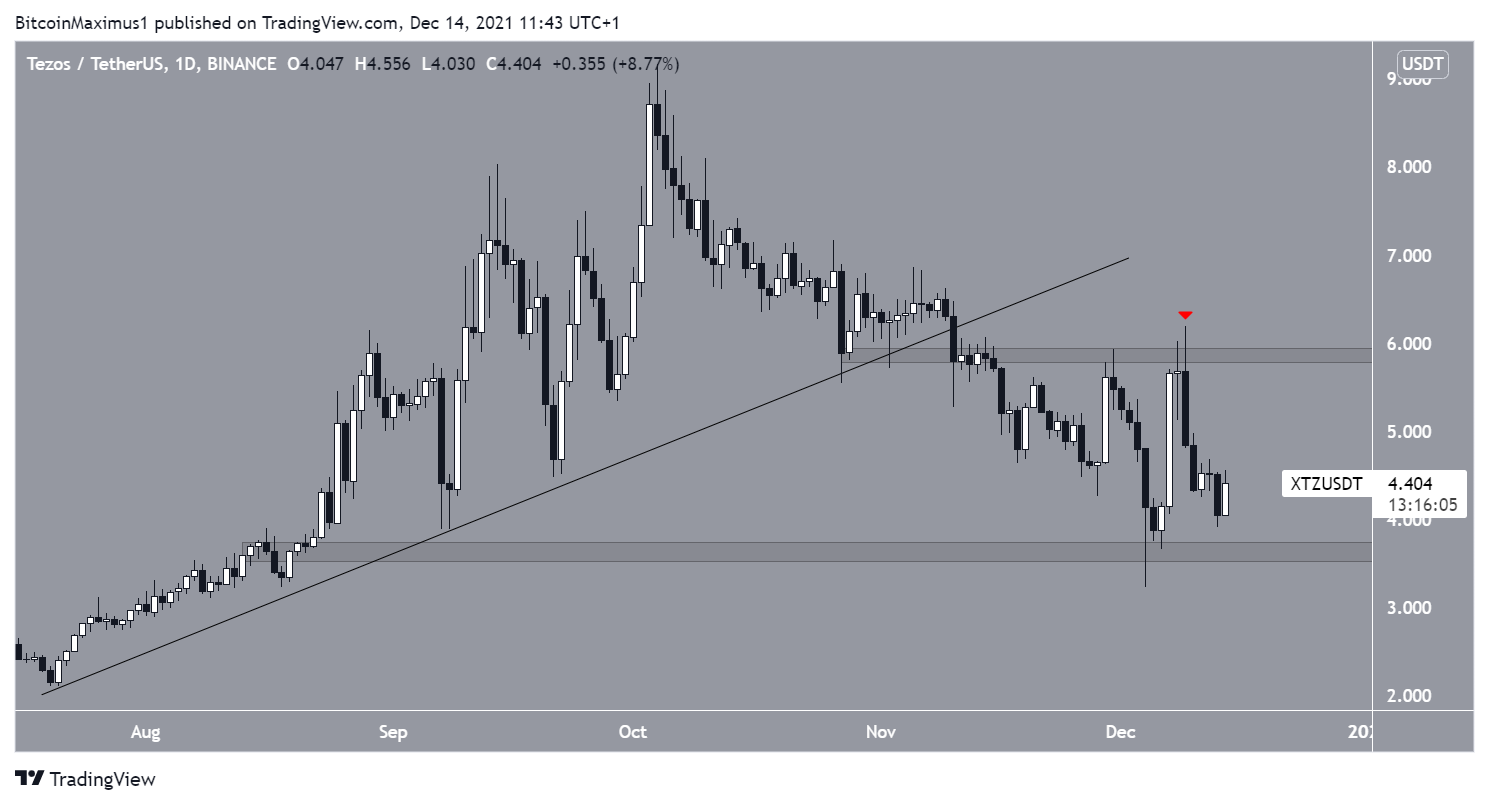
XTZ
Tezos (XTZ) has been falling since Dec 4, when it reached an all-time high price of $9.17. On Nov 10, it broke down from an ascending support line and fell to a low of $3.22 on Dec 4.
While it bounced afterwards, it was rejected by the $5.90 area (red icon), which is now expected to act as resistance.
Therefore, XTZ is now trading in a range between $3.60 and $6.90.
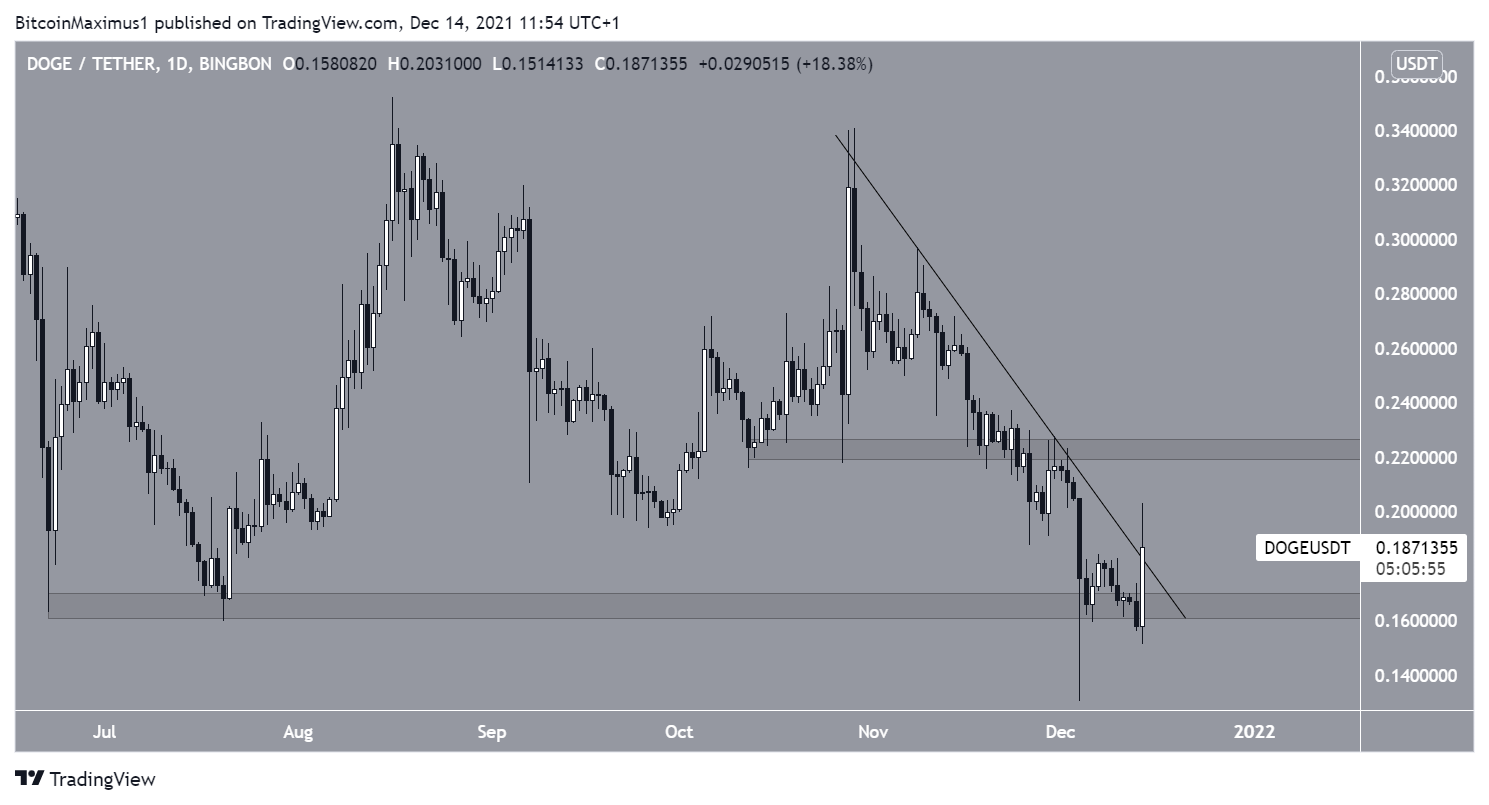
DOGE
Dogecoin (DOGE) has been falling alongside a descending resistance lien since Oct 29. On Dec 4, it fell to a low of $0.13. The low was made just below the $0.165 support area, which has been in place since June.
However, DOGE has reclaimed the area since and is making an attempt at breaking out above the aforementioned descending resistance line. Such reclaims after failed breakdowns are usually followed by a significant movement in the other direction.
If it is successful in doing so, the next resistance would be at $0.226.
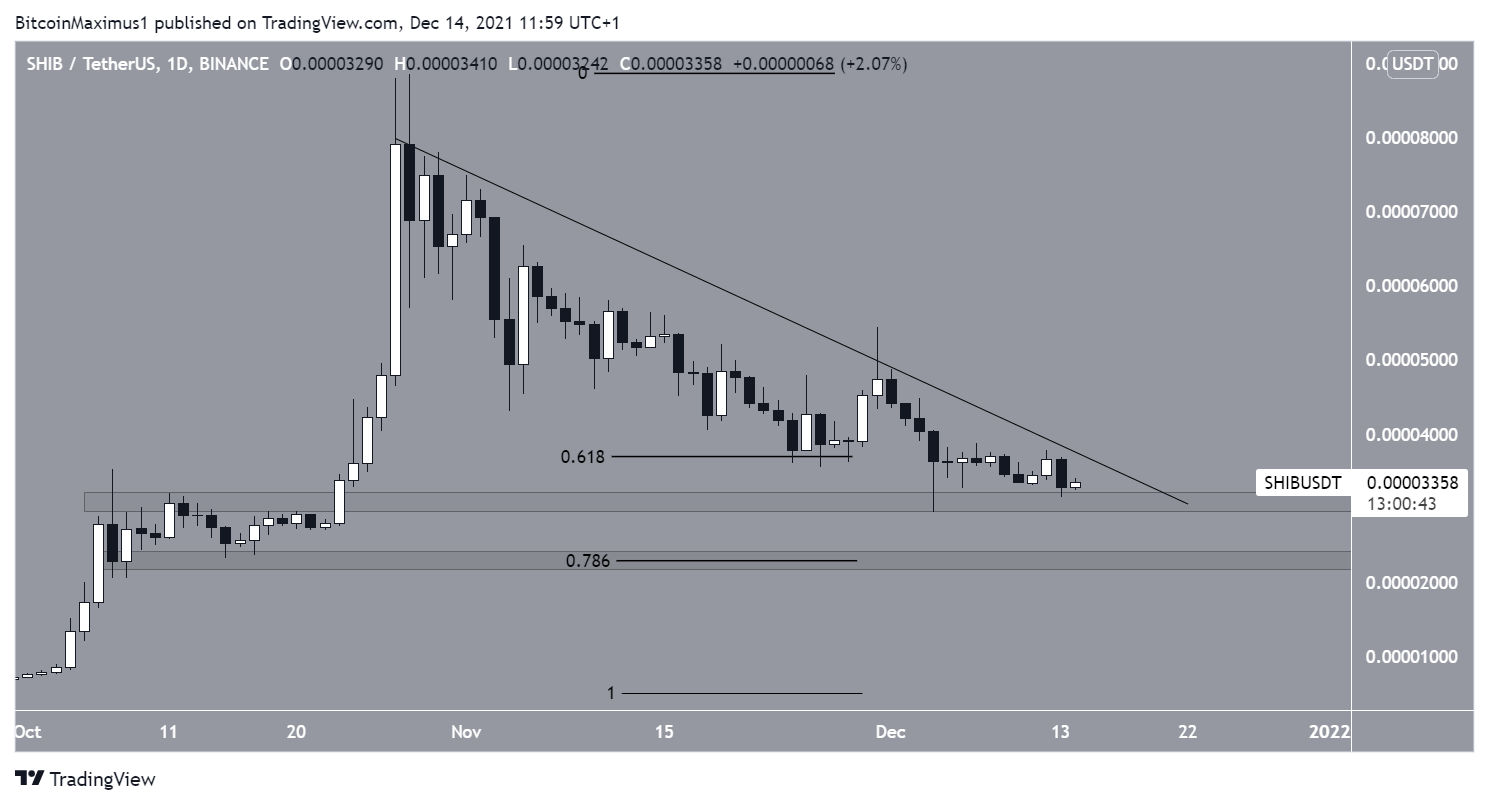
SHIB
SHIBA INU (SHIB) has been falling since Oct 28, when it reached an all-time high price of $0.000088. So far, it has reached a low of $0.000029, doing so on Dec 4.
SHIB is currently trading just above the $0.000031 support area, which previously acted as the all-time high resistance.
This is a strong support level that could initiate a bounce.
However, SHIB is still following a descending resistance line, in place since the aforementioned all-time high price. Until it breaks out, the reversal cannot be confirmed.
For BeInCrypto’s latest Bitcoin (BTC) analysis, click here.
