
The Dogecoin (DOGE) price completed a short-term corrective structure. It could be in the first leg of a downward movement.
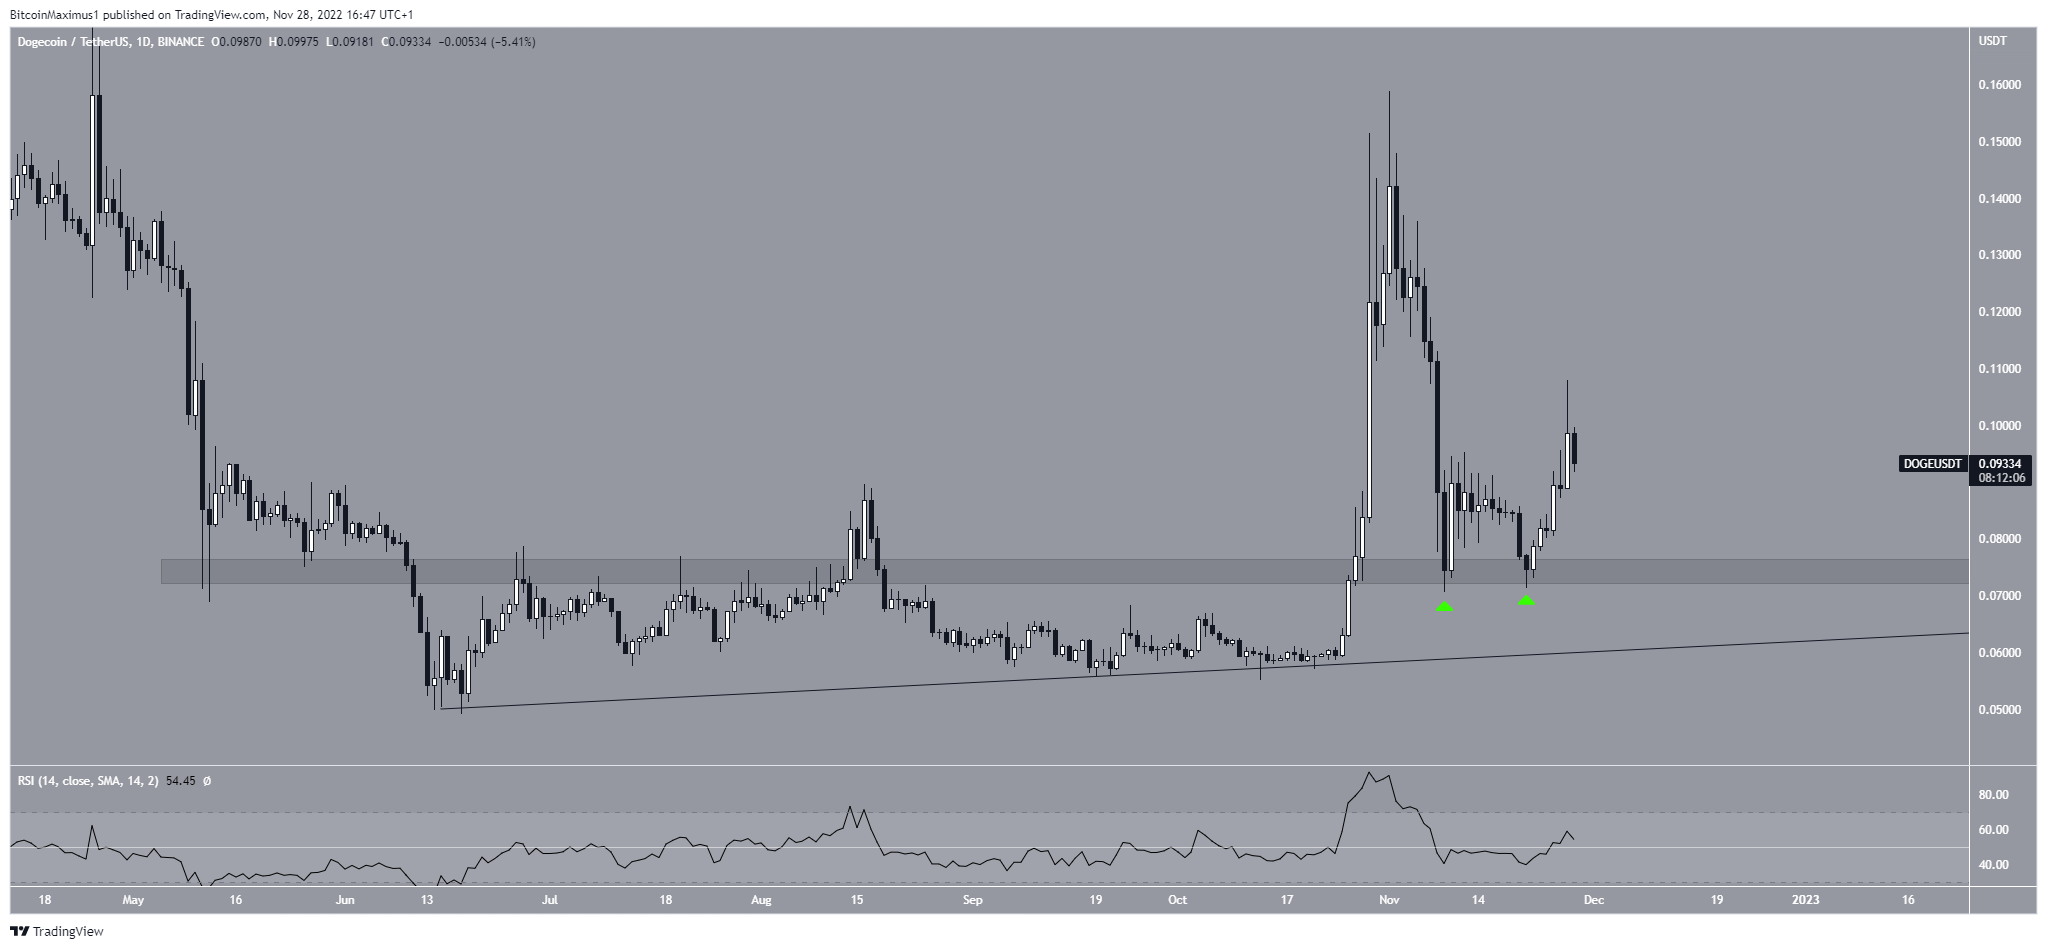
The Dogecoin price has fallen since reaching a high of $0.159 on Nov. 1. The fall was sharp and re-tested the $0.075 support area. Once there, the price of DOGE bounced after creating a double bottom (green icons). Dogecoin reached a high of $0.108 before it was rejected. The price has decreased over the past 24 hours.
Technical indicators do not provide a clear direction for the future movement. While the RSI has moved above 50, it has yet to generate any bullish divergence.
Therefore, the Dogecoin price movements from the daily time frame are unclear and do not help in determining the future price.
Dogecoin Price Prediction: New Lows After Completed Correction
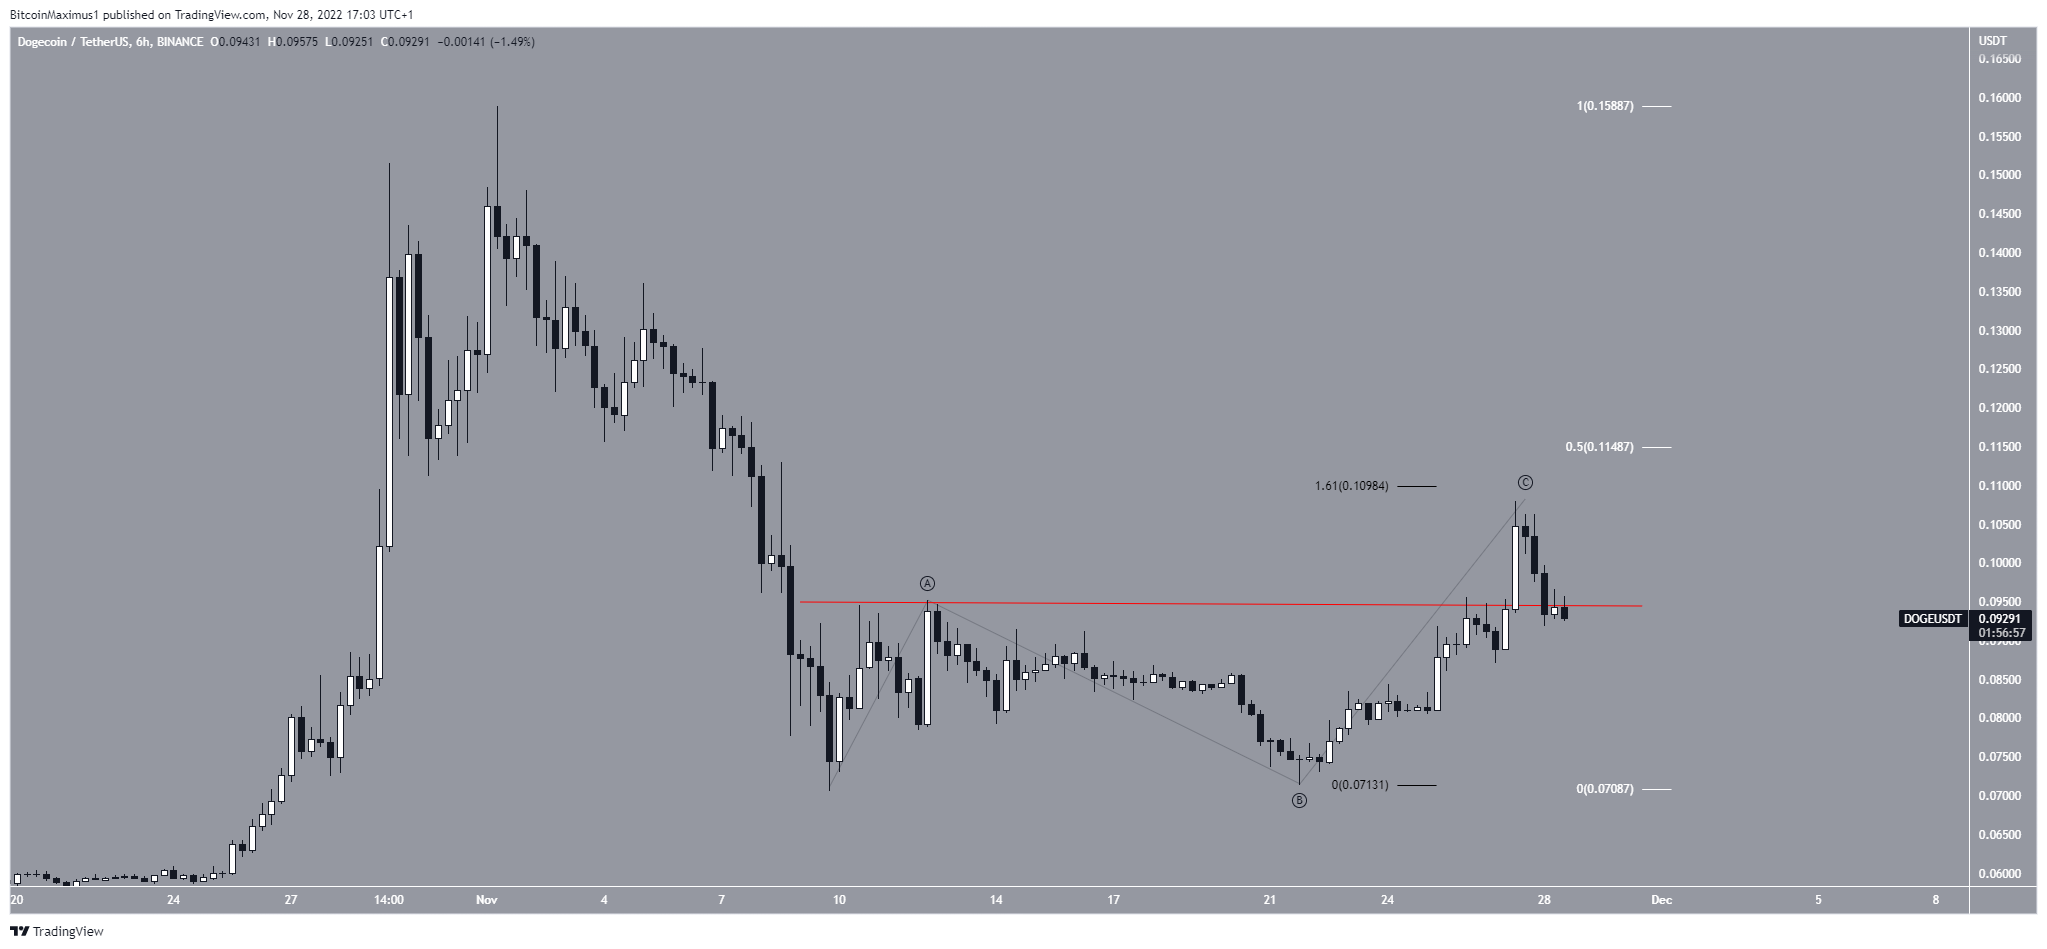
The technical analysis from the two-hour chart shows a completed A-B-C corrective structure. In it, waves A:C had a 1:1.61 ratio (black), supporting the legitimacy of the count. Furthermore, the Dogecoin price reached a high very close to the 0.5 Fib retracement resistance area (black).
The meme coin surged after Elon Musk tweeted an outline of the future plans for the Twitter 2.0. While DOGE is not mentioned in the tweet, users have hypothesized that it could be used for payments.
The overlap between the top of wave A and the current decrease (red line) indicates that the movement is not a new impulse, rather it is a correction. As a result, the Dogecoin prediction is bearish, and a downward movement is expected.
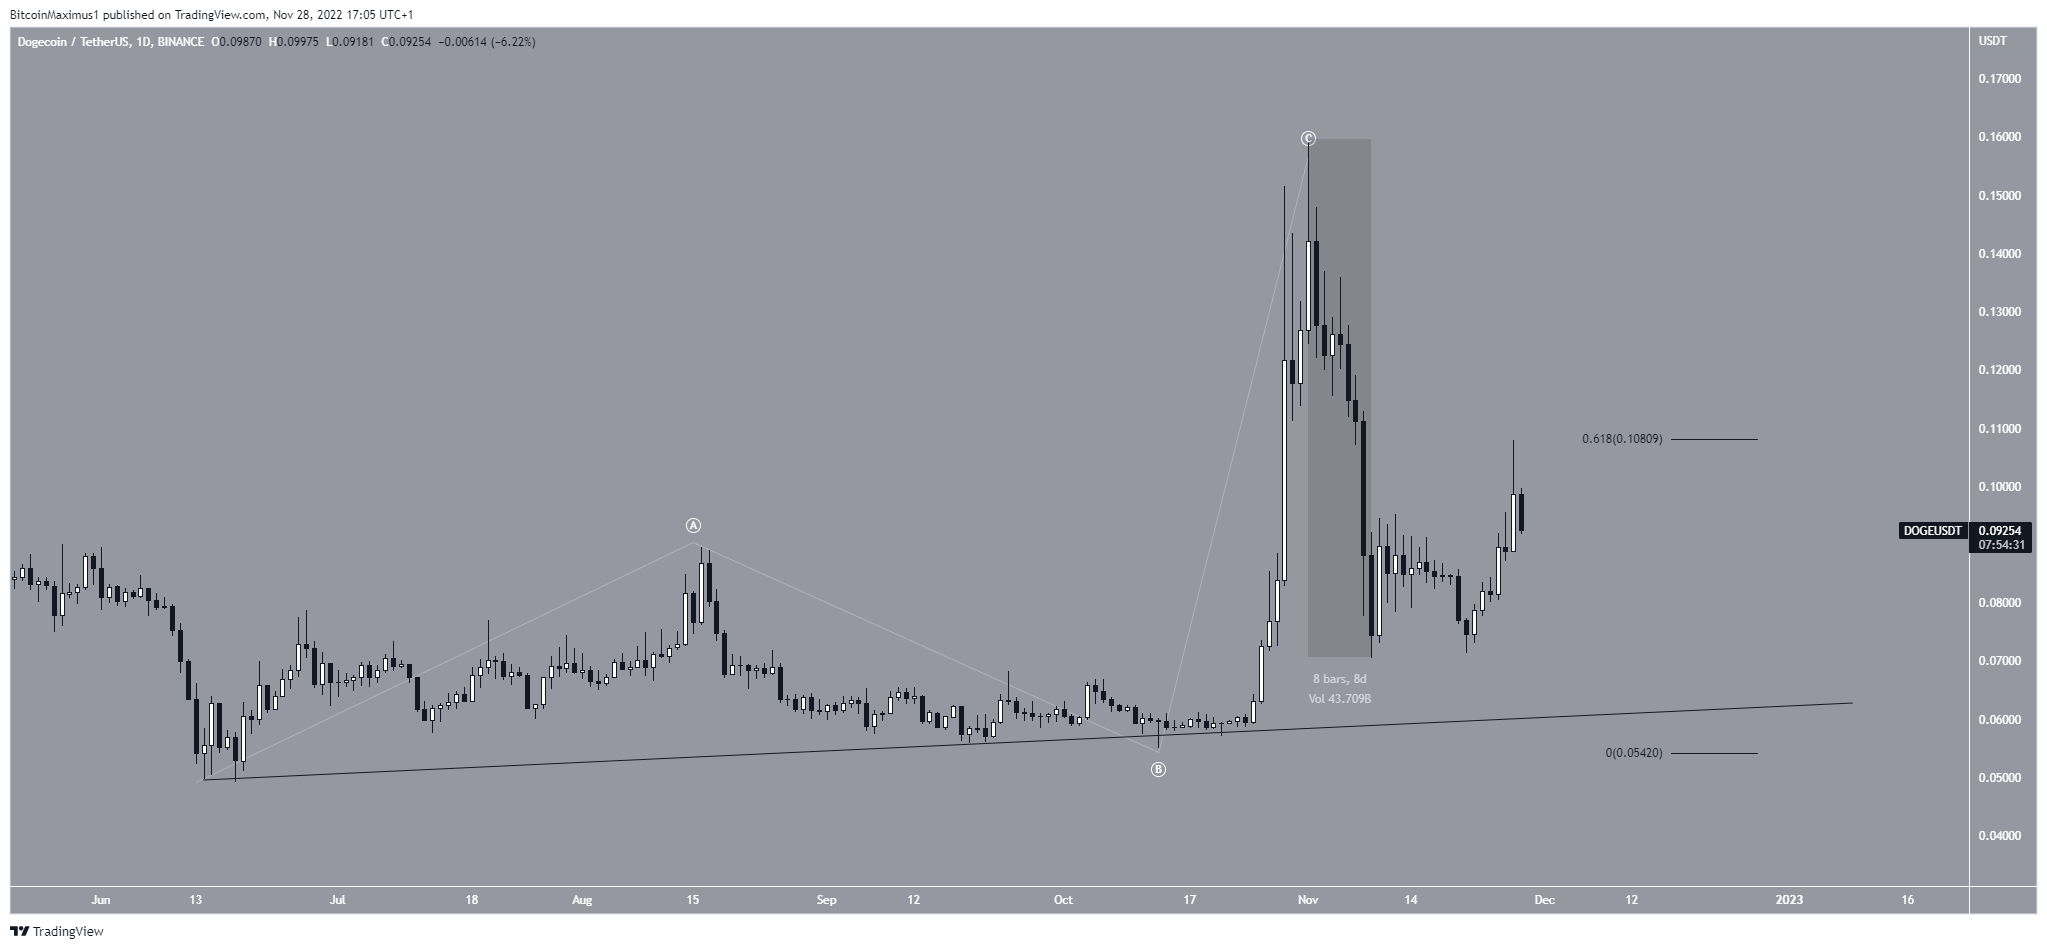
Going back to the daily time frame, the ensuing downward movement would take the DOGE price to at least the $0.054 yearly lows. The target is calculated using the 0.618 length of the initial drop (highlighted). It would cause a breakdown from the ascending support line.
Because the increase since June 15 looks like an A-B-C structure (white), the Dogecoin price may fall to new lows.
For BeInCrypto’s latest crypto market analysis, click here.
Disclaimer: BeInCrypto strives to provide accurate and up-to-date news and information but it will not be responsible for any missing facts or inaccurate information. You comply and understand that you should use any of this information at your own risk. Cryptocurrencies are highly volatile financial assets, so research and make your own financial decisions.
