


Both Dogecoin (DOGE) and Shiba Inu (SHIB) have broken down from their respective patterns which had been in place since the June lows. But, SHIB has shown more strength by managing to hold on above an important support area.
DOGE
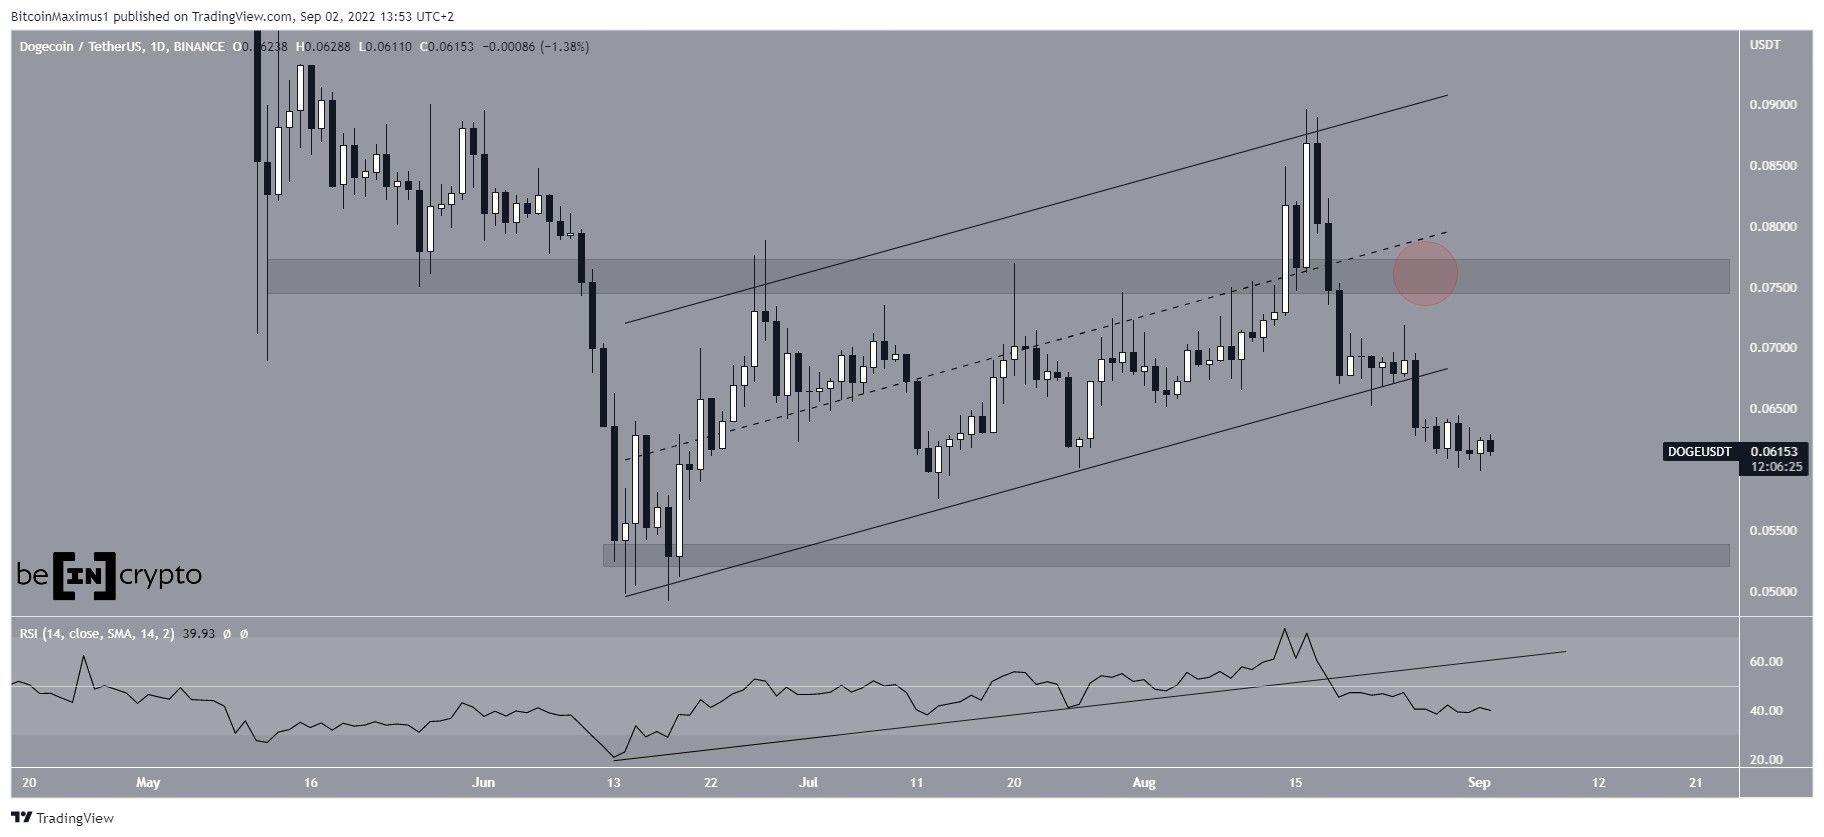
DOGE had been increasing inside an ascending parallel channel since June 14. The upward movement led to a high of $0.089, reaching the resistance line of this channel. However, the price was rejected and has been falling since.
Furthermore, DOGE decreased below the $0.077 area, which was expected to provide support. Now, the area has turned to resistance.
In addition, while the price bounced at the support line of the channel, it failed to reach the $0.077 area (red icon), breaking down after a slight bounce. This is considered a sign of weakness, since DOGE could not even initiate a substantial retracement.
The legitimacy of the breakdown is strengthened by the movement of the daily RSI, which has also broken down from an ascending support line and decreased below 50. Both of these are considered signs of bearish trends.
So, the most likely scenario would have DOGE falling to the $0.053 support and potentially heading even lower.
SHIB
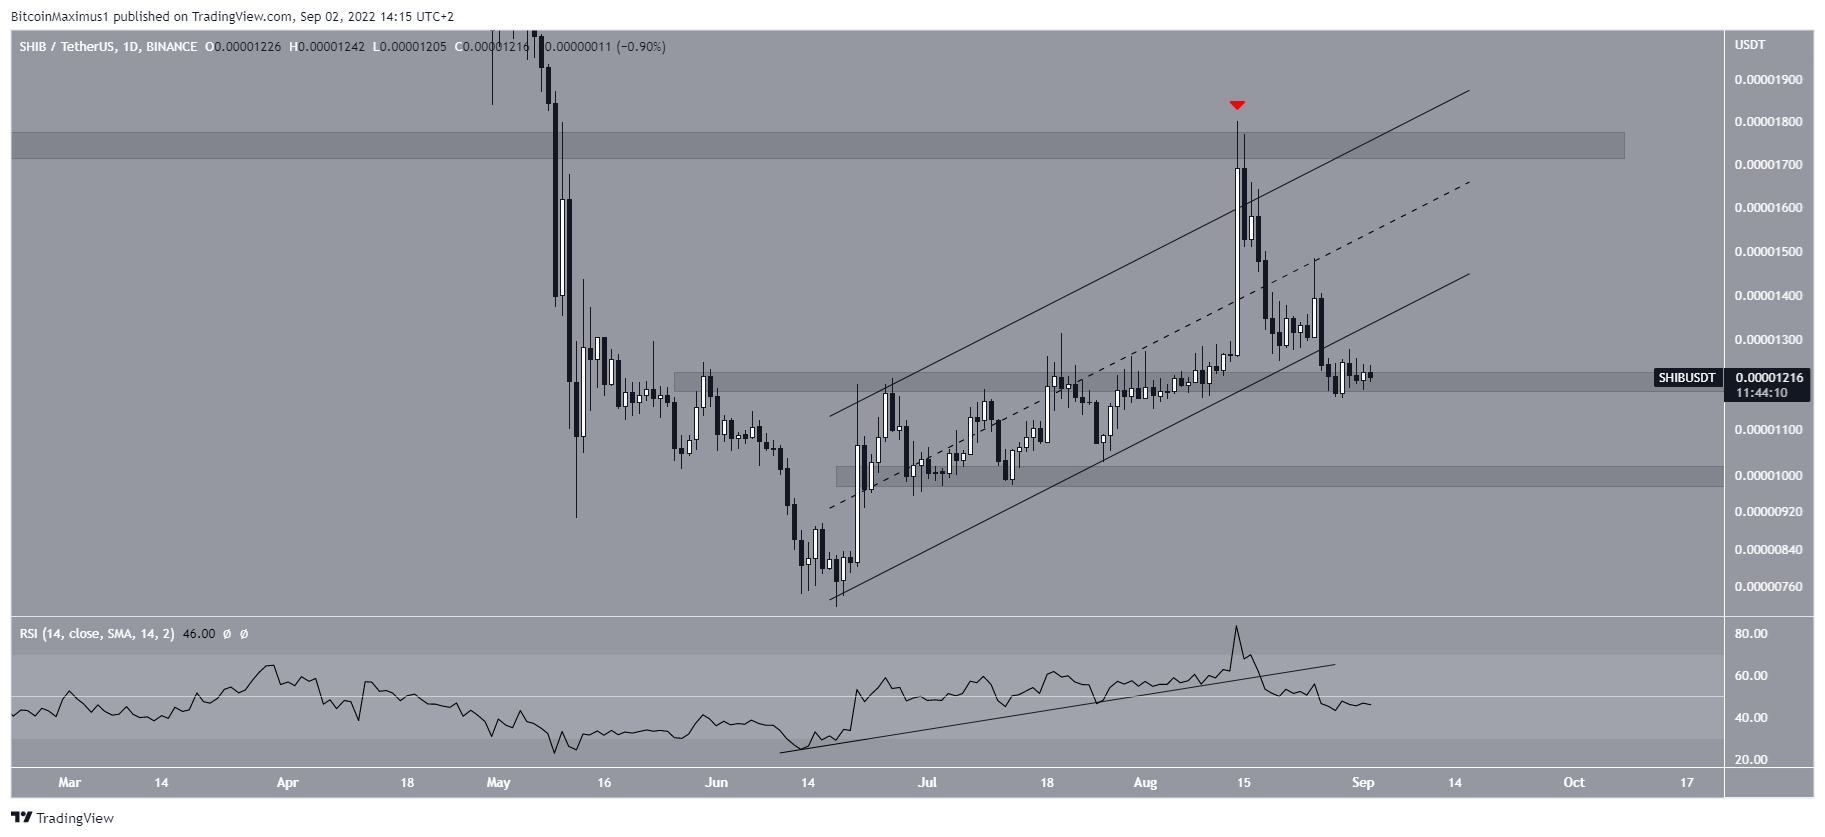
Similar to DOGE, SHIB had been trading inside an ascending parallel channel since June 18. The movement inside the channel led to a high of $0.000018 on Aug 14. This validated both the resistance line of the channel and the $0.0000175 horizontal resistance area (red icon).
However, SHIB has been falling since and broke down from the channel on Aug 26. Currently, SHIB is still trading above the $0.000012 area.
Even though the daily RSI has broken down from an ascending support line and has now decreased below 50. So, this grants legitimacy to the breakdown and suggests that lower prices are in store.
If the downward movement continues, the next closest support area would be at $0.00001.
For Be[in]Crypto’s latest Bitcoin (BTC) analysis, click here


