
Dogecoin has held our attention for quite some time as the “meme cryptocurrency.” Basic Attention Token aims to disrupt the online advertising agency along with the Brave browser.
In this analysis, we compare the short and medium-term movements of DOGE/BTC and BAT/BTC. As well, we assess their technical indicators to determine possible long trade setups. To conclude, we are going to summarize our findings and rate the cryptocurrencies to see which has the better future price potential.
Dogecoin (DOGE) vs. Basic Attention Token (BAT): Price Outlook
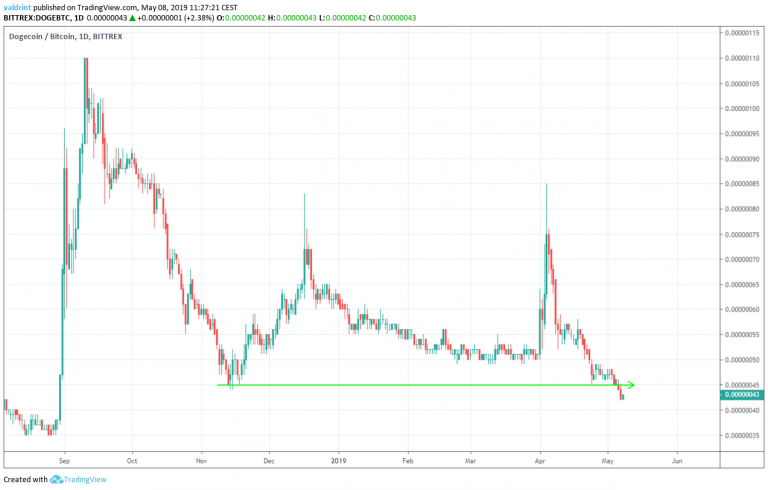
On Sep 2018, the price of DOGE began an upward move which took it to a high of 110 satoshis before the month ended. later that month. A gradual decrease ensued and the price reached a low of 45 satoshis in November.
An attempted recovery brought DOGE to a daily high in Dec of 83 satoshis. Over the next several months, the price dropped again. Lows below 50 satoshis were reached in March and April. Prices spiked at the end of March and then dropped to under 45 satoshis earlier in May.
These lows caused Dogecoin to breakdown from a horizontal support line:
Since December 2017, BAT/BTC has been trading along an ascending support line. It is formed by lows near 1000 satoshis which were experienced around the middle of the month and has been validated several times in Sep 2018 and Feb 2019.
While the direction of the support line differs between BAT and DOGE, neither appear to be trading along a visible resistance line. Thus, as shown in the graph below, BAT does not exhibit a clear long-term trading pattern:
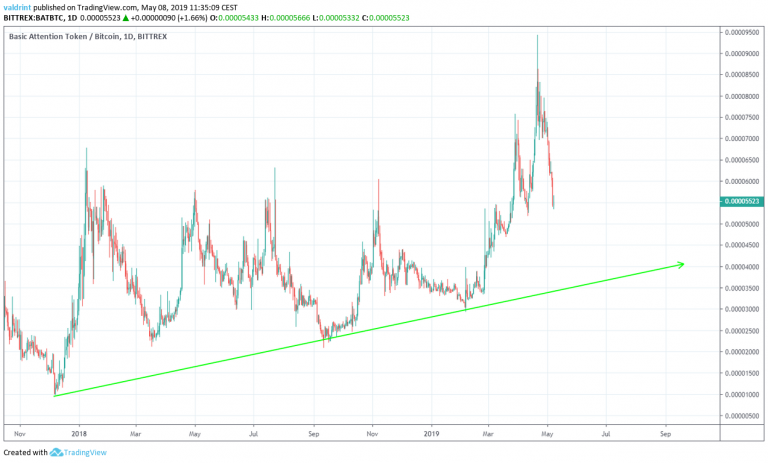
Furthermore, BAT is trading well above the support line and appears ready to drop. Similarly, DOGE has just broken down. If the breakdown is valid, we may see losses for both DOGE and BAT in the near future.
To better assess the possibility of these drops, we must examine shorter-term trading patterns alongside technical indicators.
DOGE Dancing in A Descending Wedge
On Apr 3 the price made a low of 52 satoshis and generated a short-term support line which has been validated several times since.
This support line combined with a resistance line on Apr 7 when DOGE reached a high of 69 satoshis. Since that time, DOGE/USD has been trading within a descending wedge:
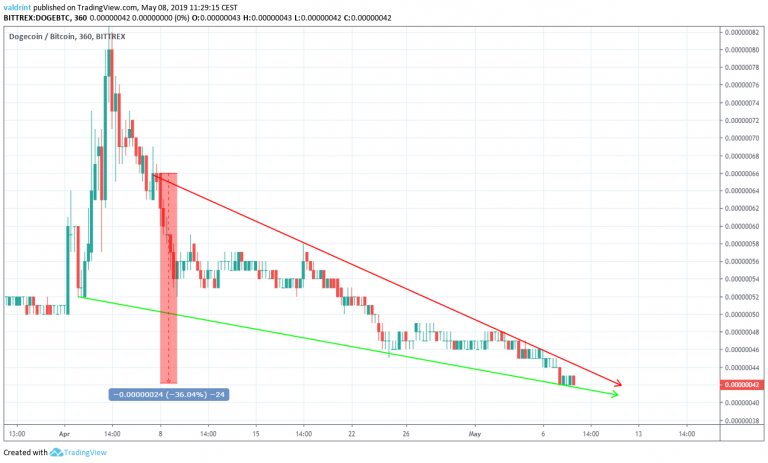
While trading inside the wedge, the price has lost 36% of its value.
Currently, the price is trading near the support line. Furthermore, the descending wedge is a bullish pattern. This suggests that the price may move upward toward the DOGE in the near future.
Nonetheless, such a rise may not lead to a breakout. To better assess the future direction of price, the price of DOGE is analyzed at 6-hour intervals the RSI and the MACD below:
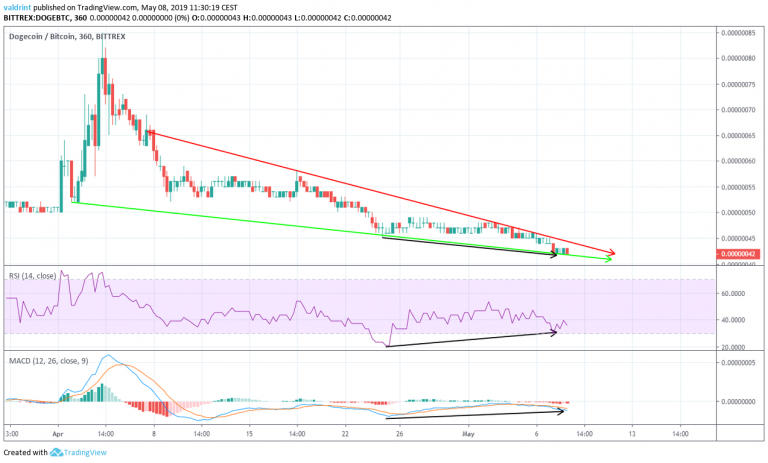
On Apr 25 the price reached a low of 45 satoshis with a lower low of 42 satoshis reached on May 7.
Similarly, the RSI and the MACD made a low on Apr 25. However, they have continued to generate higher values since.
This is known as bullish divergence and often precedes price increases toward the resistance line. Because the resistance and support are close to converging, even small gains in the near future might necessarily lead to a breakout.
Long Trade Setup
Since the price is currently trading close to the support line of the wedge, we are going to analyze two possible trade setups with an average entry of 42 satoshis. This is where the price is trading at the time of writing.
However, there is no visible low which would allow us to place a stop loss. Therefore, we will place the stop loss at 39 satoshis We will do this for reasons:
- The value of 39 satoshis is well below the support line of the wedge
- We believe the 40 satoshi level will provide psychological support.
This is a stop-loss of 7%.
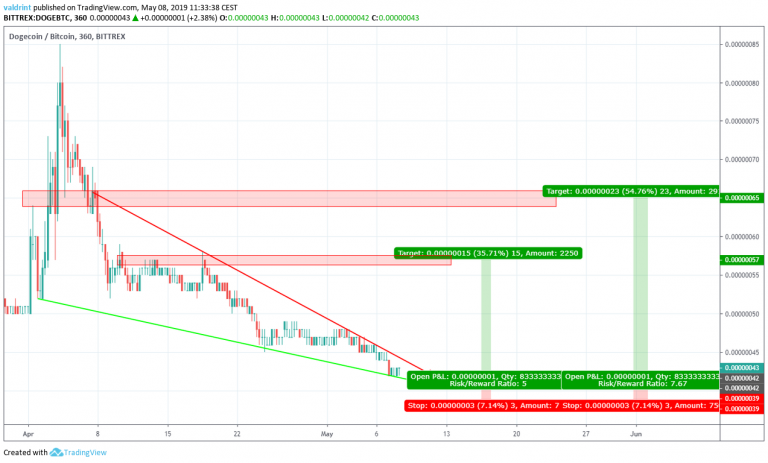
Our first target is 57 satoshis. It is created by the highs of Apr 10-20. Combined with the stop presented earlier this would present a 5:1 risk to reward ratio.
A breakout from the wedge is needed to reach the target.
The second target would be 65 satoshis. Combined with our stop loss, this would present a 7.6:1 risk to reward ratio. A breakout from the wedge would be required in order for the price to reach the target.
Based on our analysis of technical indicators, this is likely.
Now, let’s take a look at BAT.
BAT Vs. Descending Resistance
Since reaching highs of 9400 satoshis on Apr 20, the price has been following a steep resistance line and decreased by 43%.
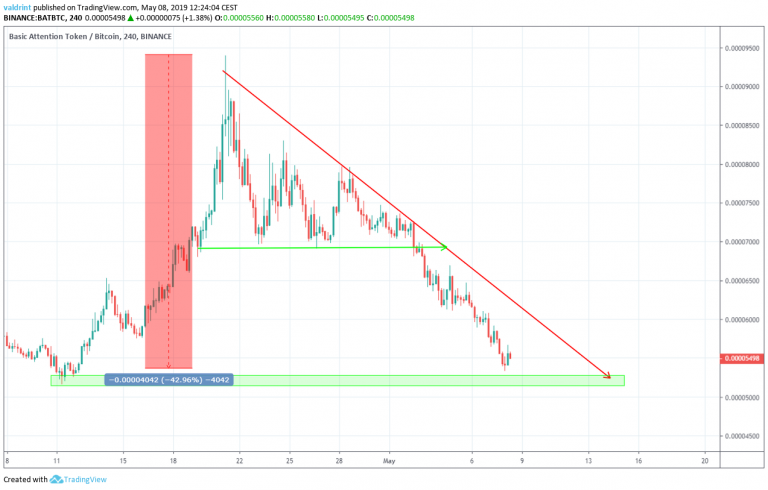
This resistance line was part of a descending triangle until May 3 when the price of BAT broke down from the trading pattern. Since that time, we have steady price losses.
At the current time, no apparent support lines have emerged. However, there is a support area near 5200 satoshis. We believe that BAT will likely reach this area in the near future.
Nonetheless, BAT may move toward the resistance line first. While it does not appear that breakout is likely, it remains possible.
To better asses, whether BAT will rise toward a breakout or fall toward the support are, we now analyze price at four-hour intervals alongside the 50-,100-, 150- and 200-period moving averages (MA) below:
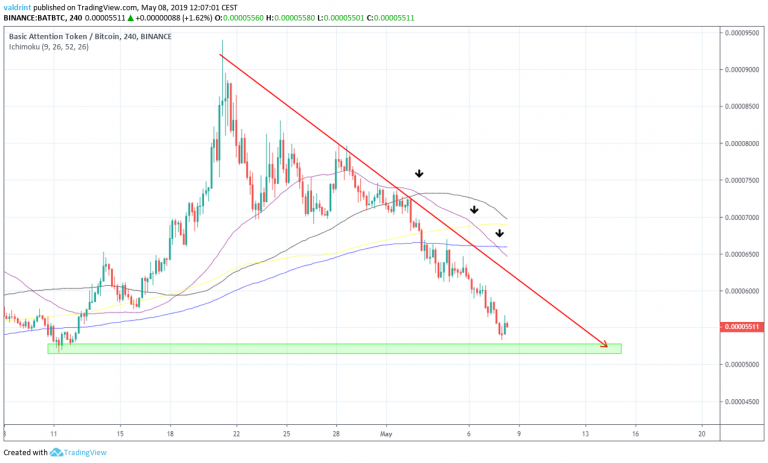
We can see that several bearish crosses have occurred between the aforementioned moving averages. Furthermore, the price has made several unsuccessful attempts at a breakout and is trading below all the MAs.
This indicates that the price likely does not have enough power to move above the resistance. While price may increase in the short-term to validate resistance, price should drop almost immediately thereafter. Additionally, such an increase may not precede the forthcoming drop.
We do not see any current trade setups that offer an acceptable risk to reward ratio.
Conclusion
To conclude, both DOGE and BAT are trading inside decreasing short-term patterns. However, their long-term prospects are different.
The price of DOGE is trading inside a descending wedge and has developed significant bullish divergence. This allows us to create a long trade setup.
On the other hand, the price of BAT recently made several unsuccessful attempts at a breakout above the resistance line and moving averages. Furthermore, numerous bearish crosses have occurred between the moving averages, and there is no visible trade setup.
Therefore, we believe that Dogecoin faces better prospects in the future.
A summary is presented in the table below:
DOGE
BAT
WINNER
Outlook
Rapidly decreasing descending resistance line
Tie
Patterns & Indicators
Bullish divergence developing inside a descending wedge
Bearish cross between several moving averages
DOGE
Do you think DOGE and BAT are good investments in the long-term? Let us know your thoughts in the comments below!
Disclaimer: This article is not trading advice and should not be construed as such. Always consult a trained financial professional before investing in cryptocurrencies, as the market is particularly volatile.
SHARE
