


Dogecoin (DOGE) has been moving upwards since Feb 24 and seems to have broken out from its descending wedge pattern.
DOGE has been falling since reaching an all-time high on May 8, 2021. Since Sept 7 of the same year, it has been decreasing inside a descending wedge. The descending wedge is considered a bullish pattern, meaning that an eventual breakout from it would be the most likely scenario.
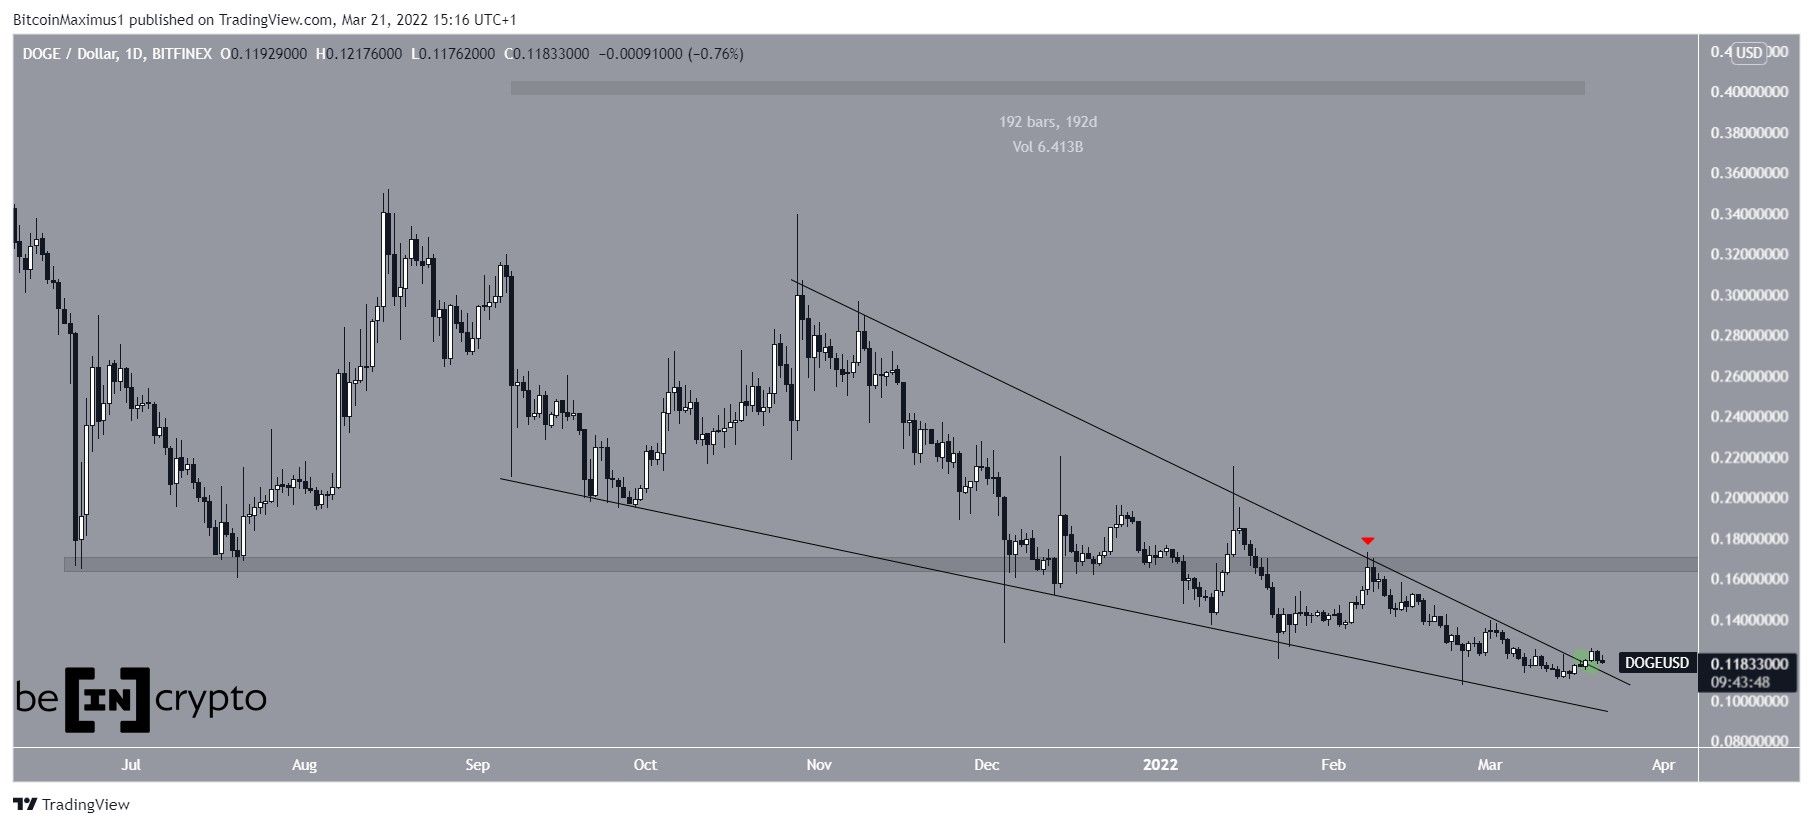
It is possible that the price broke out from the wedge (green circle) on March 19. However, the exact slope of the resistance line is not confirmed due to several long upper wicks. This in turn casts doubt on the validity of the breakout, since it is possible that the price is still trading below this line.
If the upward movement continues, the closest resistance area would be at $0.166. This had acted as support since July 2021 prior to the breakdown on Jan 2022. Afterwards, DOGE validated it as resistance (red icon) on Feb 7.
Bullish indicators
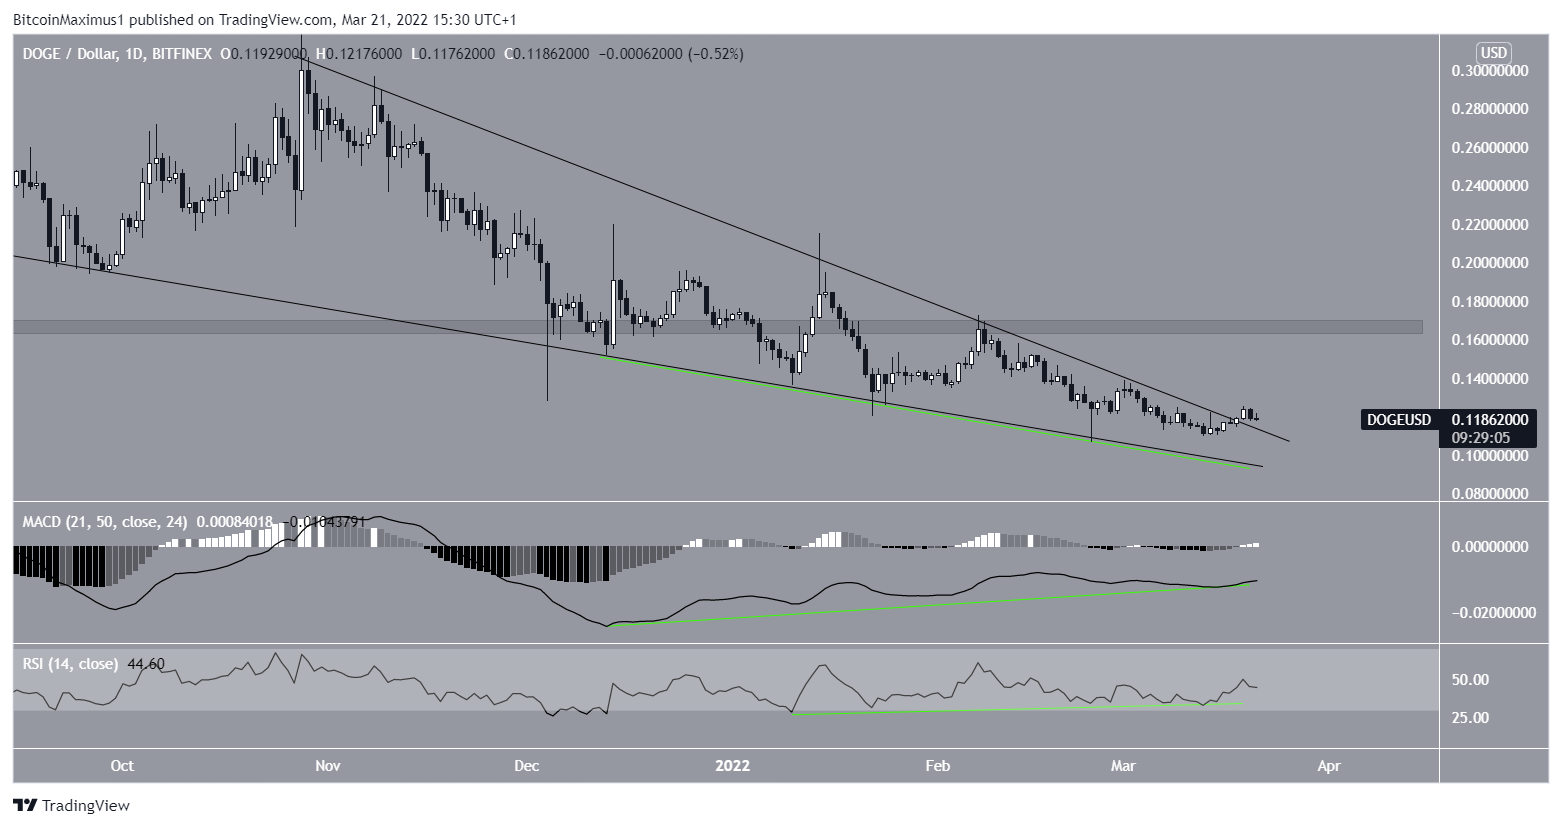
Technical indicators in the daily time-frame support the ongoing breakout. This is visible in the readings from both the MACD and RSI, which have generated considerable bullish divergences.
Such divergences usually precede bullish trend reversals.
Therefore, they support the possibility that DOGE has broken out from the wedge and will continue to increase.
However, the MACD is still negative and the RSI is below 50. Movements above these levels would be required in order for the trend to be confirmed as bullish.
Most likely, an increase above $0.166 would be required for this to occur.
DOGE wave count analysis
Cryptocurrency trader @Mesawine1 tweeted a chart of DOGE, stating that the correction is not yet complete. He outlined the $0.07 area as the first horizontal support level.
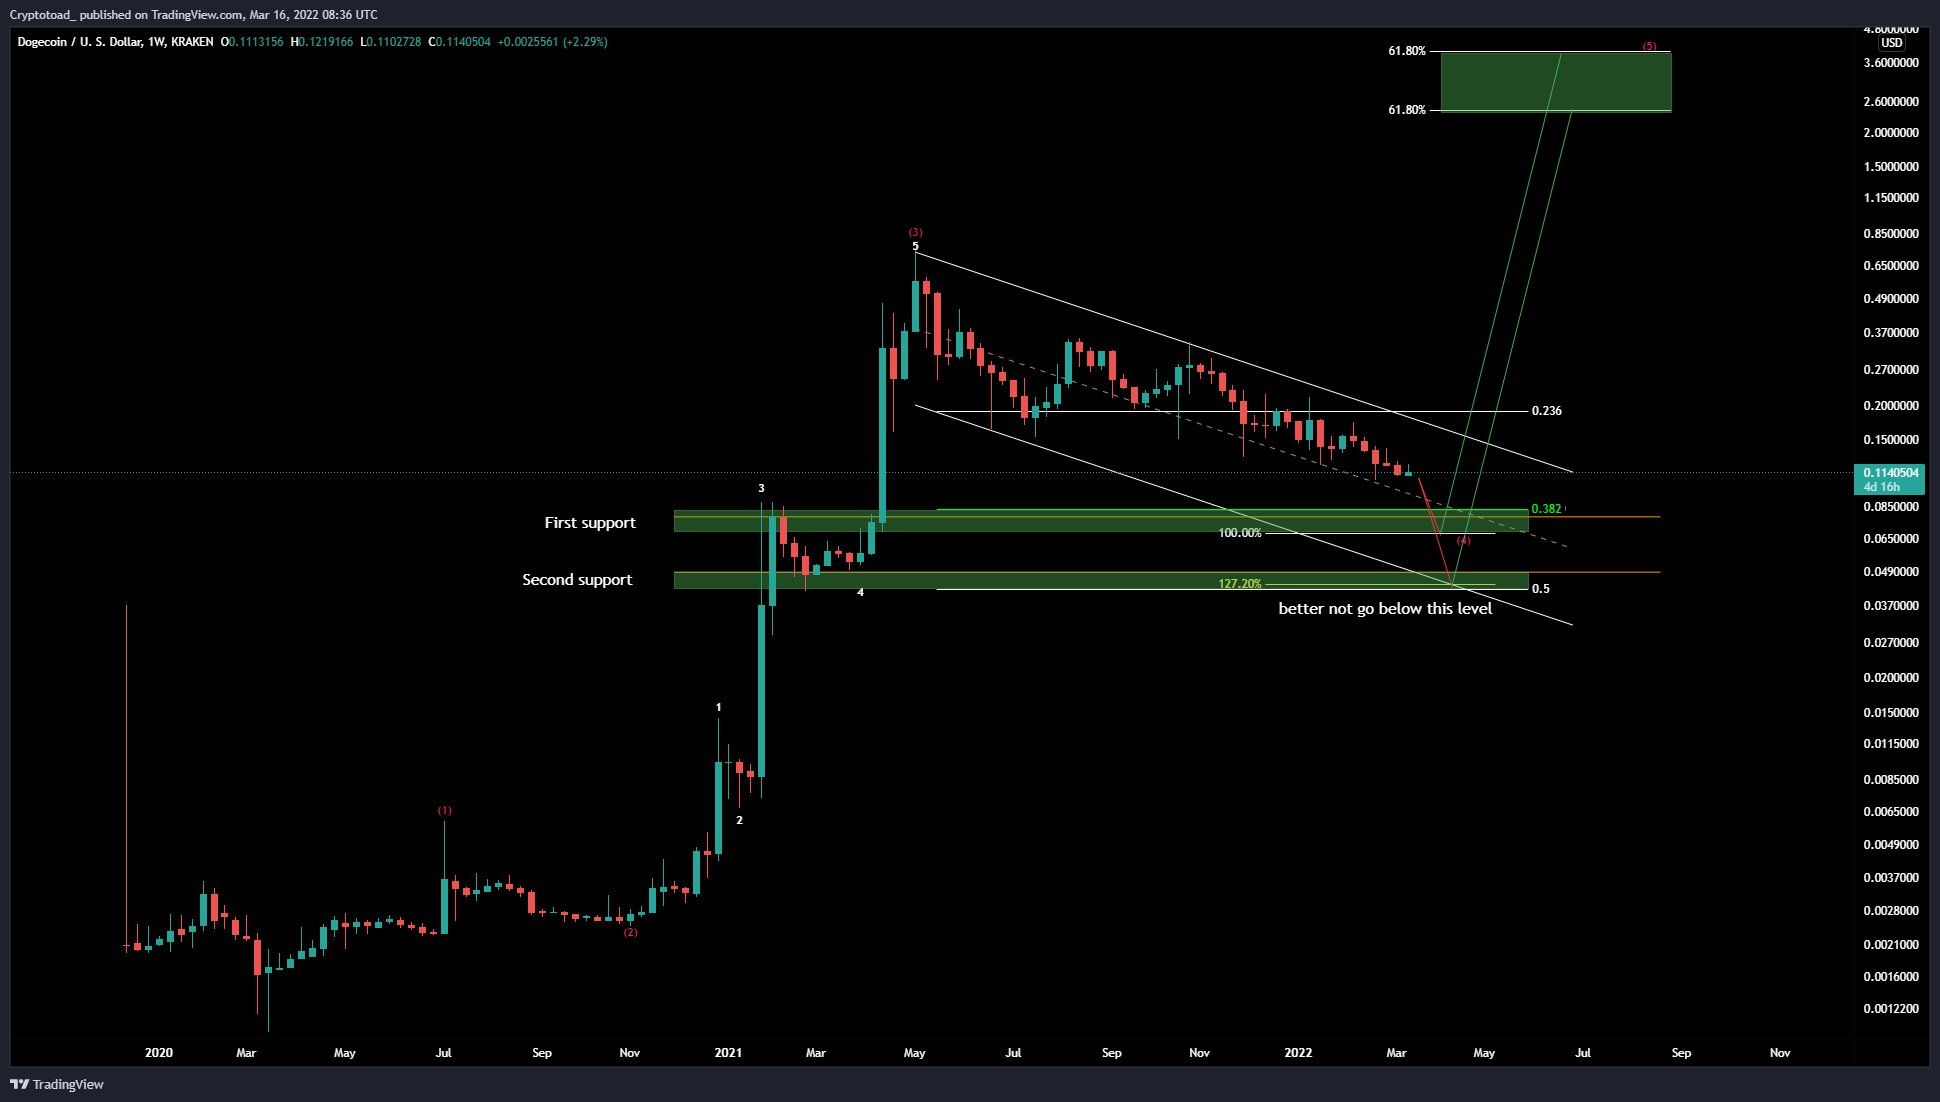
Despite the lack of support below the current price, there is a potential count that indicates the correction is complete.
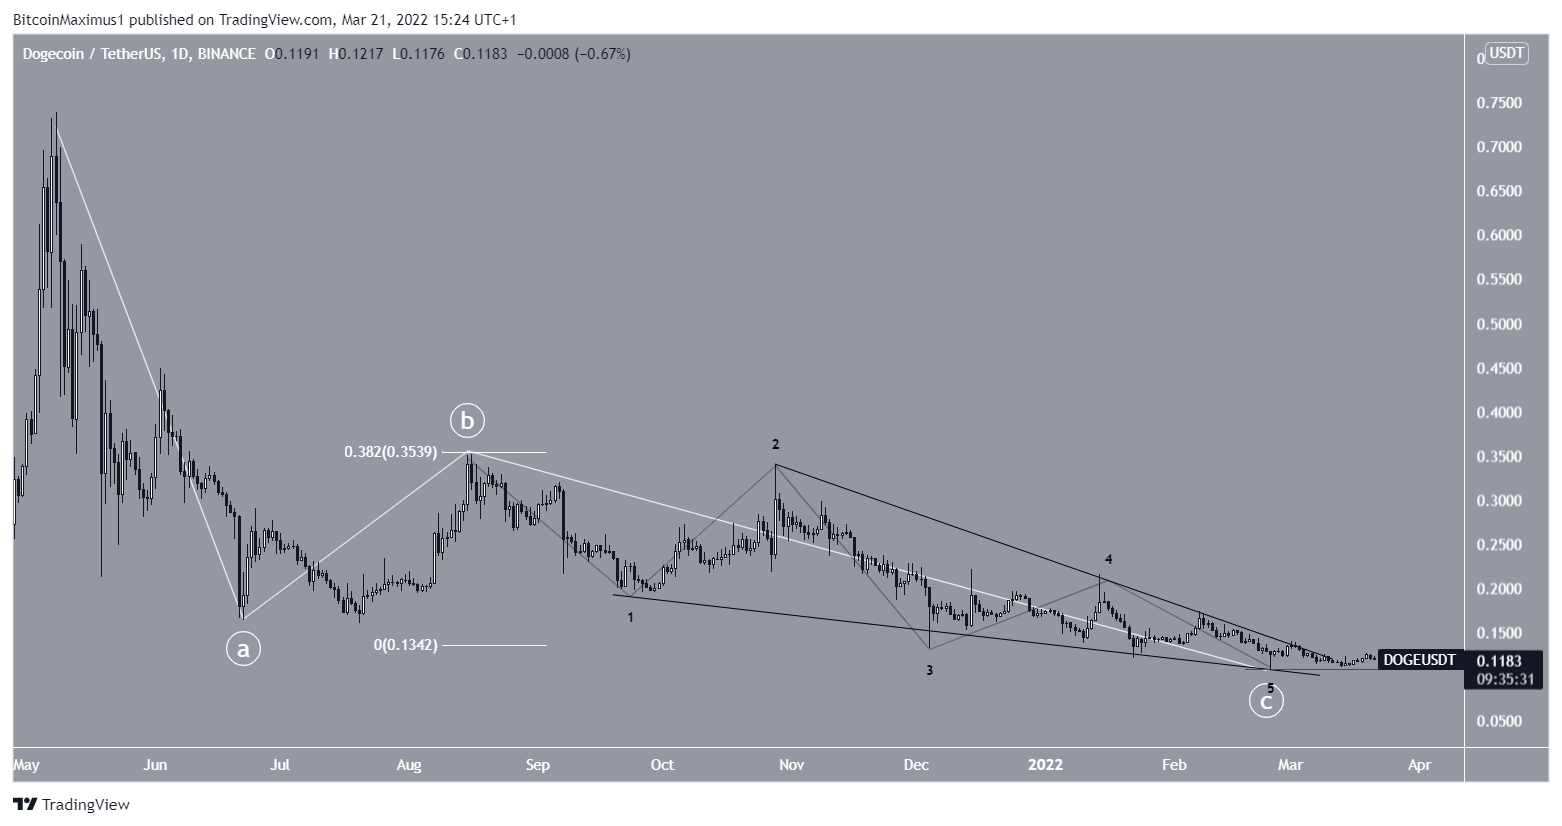
In it, DOGE has just completed the C wave of an A-B-C corrective structure (white). Wave C took the shape of an ending diagonal (black), as evident by the descending wedge shape. Such formations are usually retraced completely in a very short time, so a rapid upward movement would be expected to follow.
However, if the Feb 24 low (red line) does not hold, then a decrease towards the outlined $0.007 support area would be expected.
For BeInCrypto’s latest Bitcoin (BTC) analysis, click here


