
The Dogecoin (DOGE) price has been decreasing since it was rejected by a Fib retracement level on Nov. 25.
Despite the sharp drop, it has maintained its bullish structure and is likely to soon begin an upward move.
Doge Breakout From Wedge
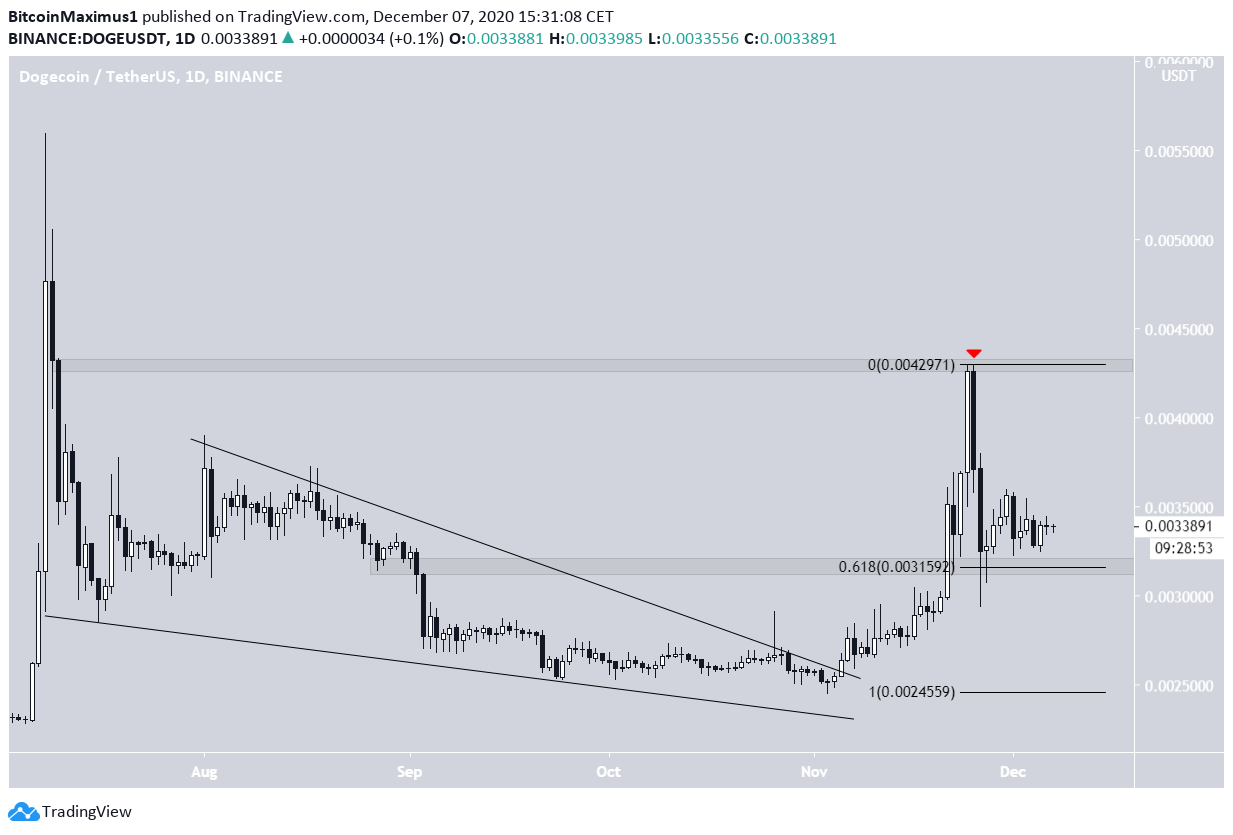
On Nov.5, the DOGE price broke out from a descending wedge and proceeded to rally over the next three weeks, reaching a high of $0.00429 on Nov. 25, an increase of 70% from the breakout level.
However, it declined considerably over the next two days and is now trading just slightly above the 0.618 Fib retracement level at $0.00315. The closest major resistance area is at $0.00429.
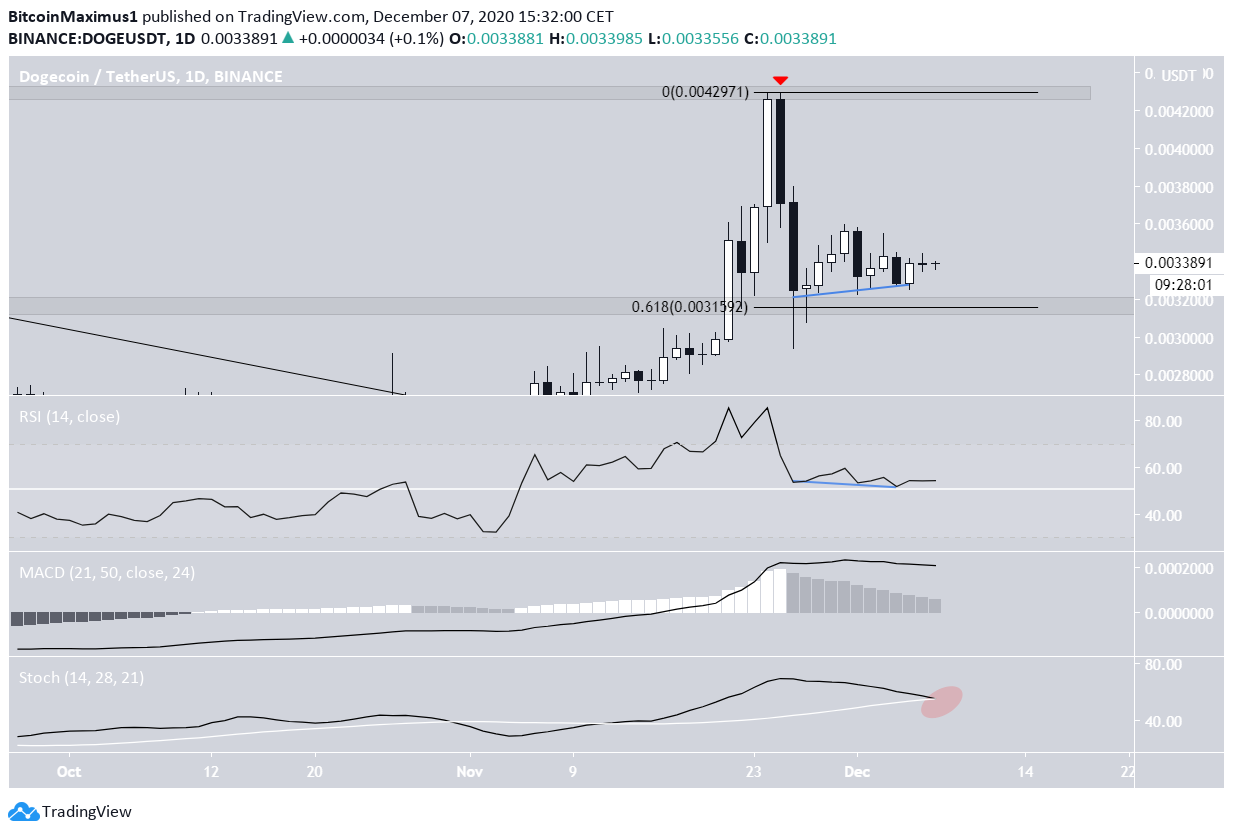
Technical indicators on the daily time-frame are sending mixed signals. While the RSI has generated hidden bullish divergence and is above 50, both the MACD and the Stochastic Oscillator are decreasing. The latter is, in fact, very close to making a bearish cross.
However, as long as the price is trading above the 0.618 Fib retracement level at $0.00315, DOGE will likely continue moving upwards.
Short-Term Movement
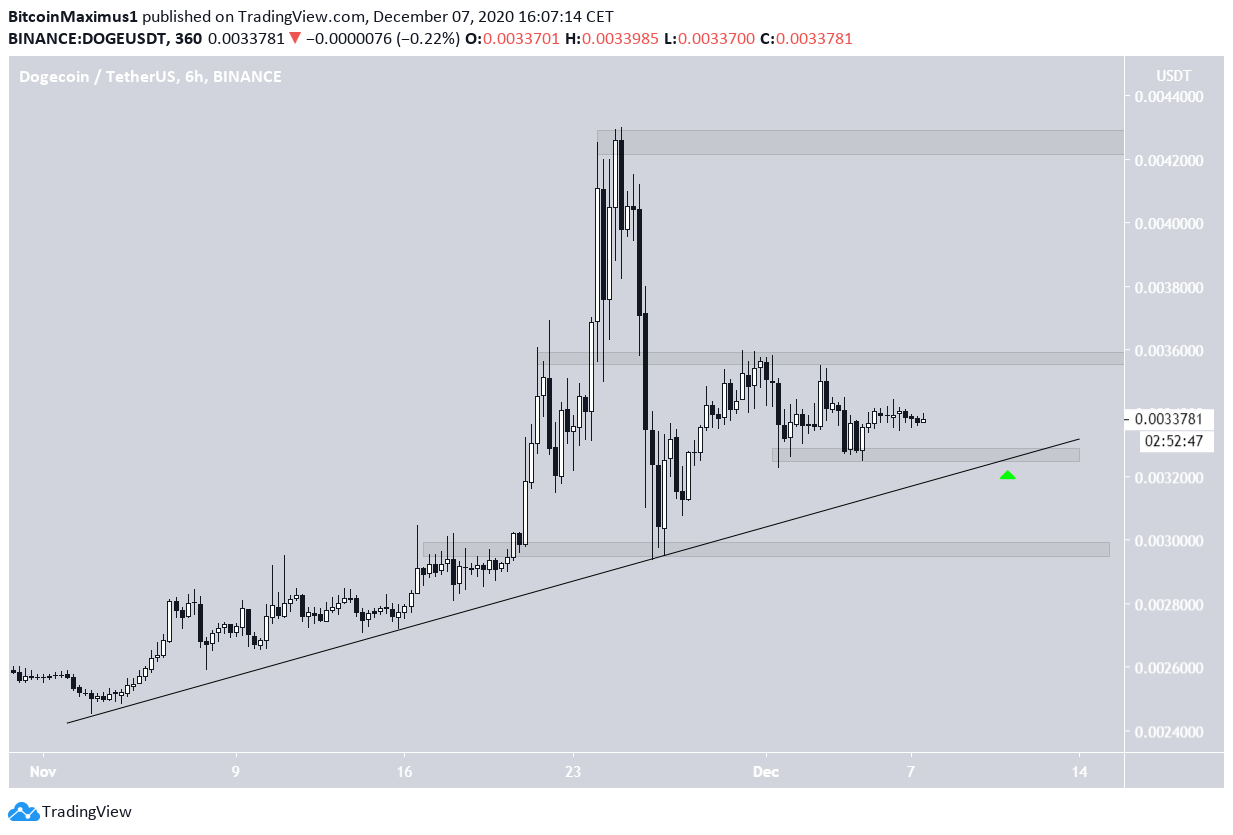
The shorter-term six-hour chart shows that the DOGE price has been following an ascending support line since it broke out from the wedge on Nov. 5. The line has been validated sufficient times and currently coincides with the $0.0032 minor support area.
A bounce at the confluence of this support line/area would take DOGE towards the next closest resistance area at $0.0036 and afterward, possibly $0.0042.
A breakdown from the support line, which currently seems unlikely, would probably take it towards the next support area at $0.0030.
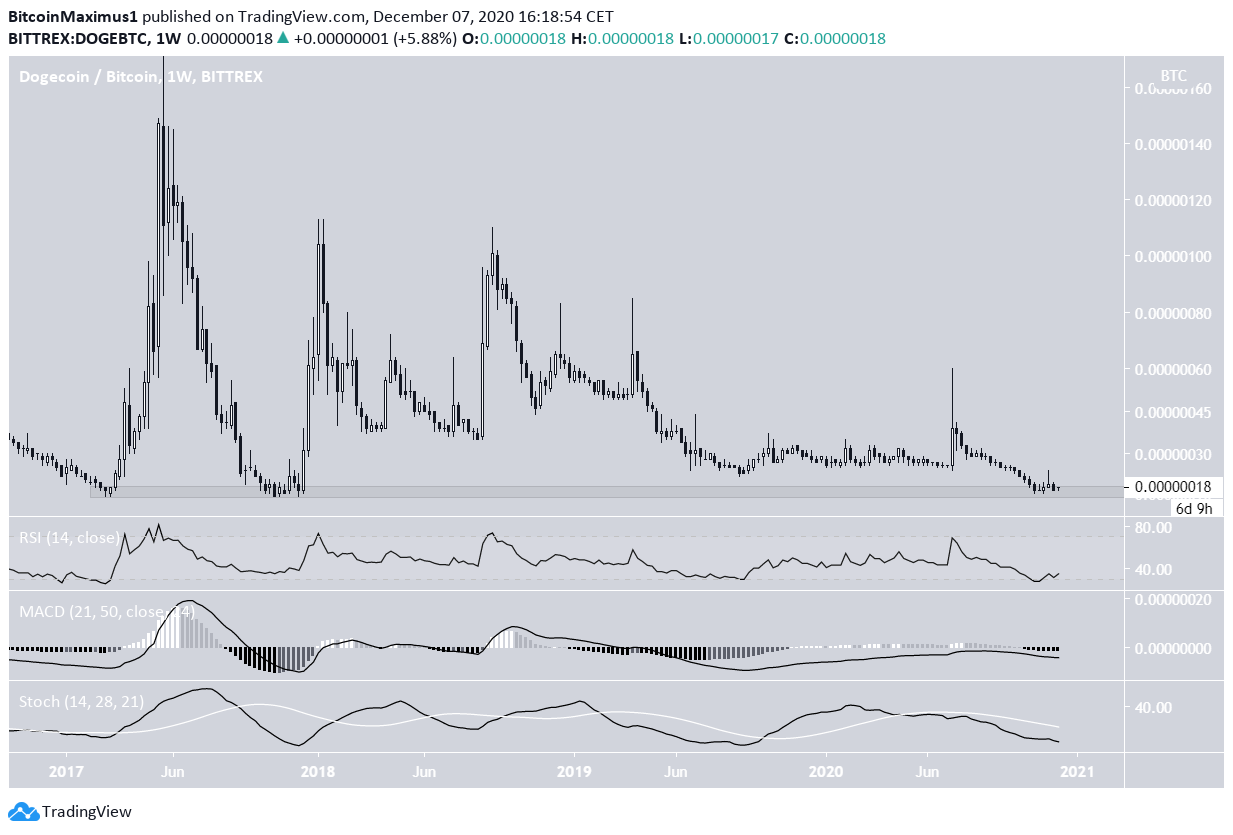
DOGE/BTC
Cryptocurrency trader @CryptoDonAlt outlined a DOGE chart, stating that the price has reached an important support level that is ideal for long-term accumulation.
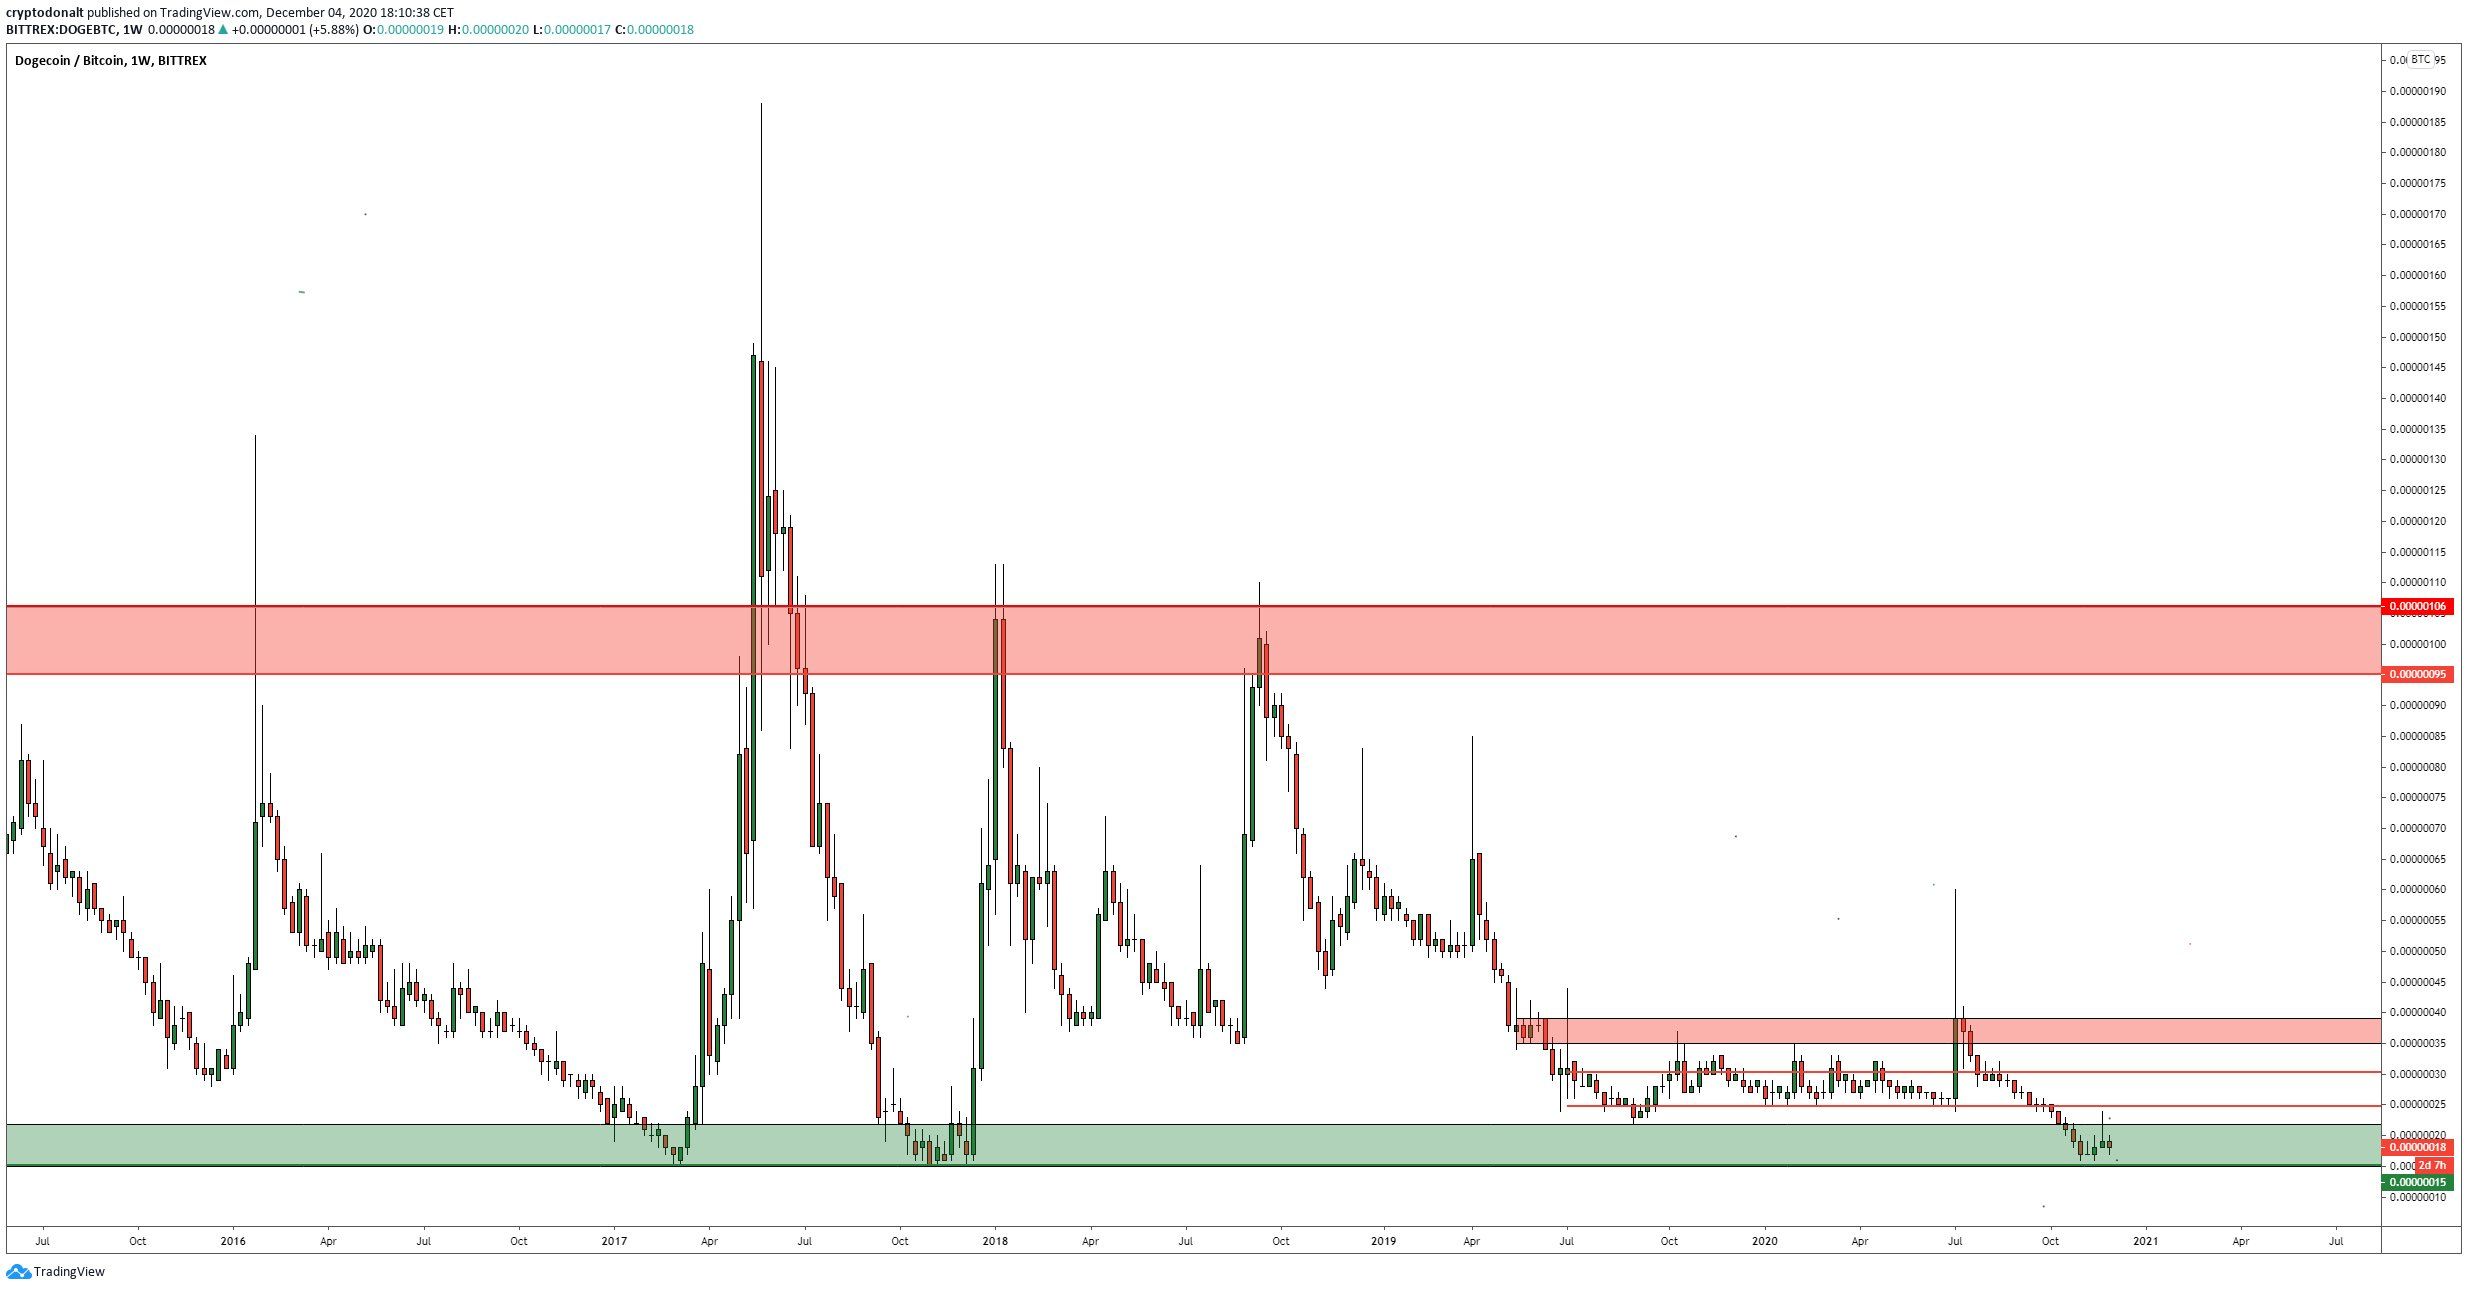
The support level is at 17 satoshis and has been acting as the all-time low. DOGE reached it twice in 2017, beginning rapid upward movements on each successive rally.
While there are no clear bullish reversal signs yet, history suggests that a similar move might occur this time around.
As long as it does not reach a weekly close below 17 satoshis, the most likely move would be upward, fitting with the corresponding DOGE/USD movement.
Conclusion
To conclude, as long as the DOGE price is trading above its ascending support line, it should rally and reach $0.036, and possibly $0.042.
While the DOGE/BTC pair has not given any clear bullish reversal signs, it is trading very close to its all-time low levels.
For BeInCrypto’s previous Bitcoin analysis, click here!
Disclaimer: Cryptocurrency trading carries a high level of risk and may not be suitable for all investors. The views expressed in this article do not reflect those of BeInCrypto.
