

The Dogecoin (DOGE) price has broken out from and reached a close above a long-term resistance level which had been in place since 2019.
As long as it’s trading above, DOGE should continue moving upwards towards the resistance levels outlined below.
Long-Term Levels
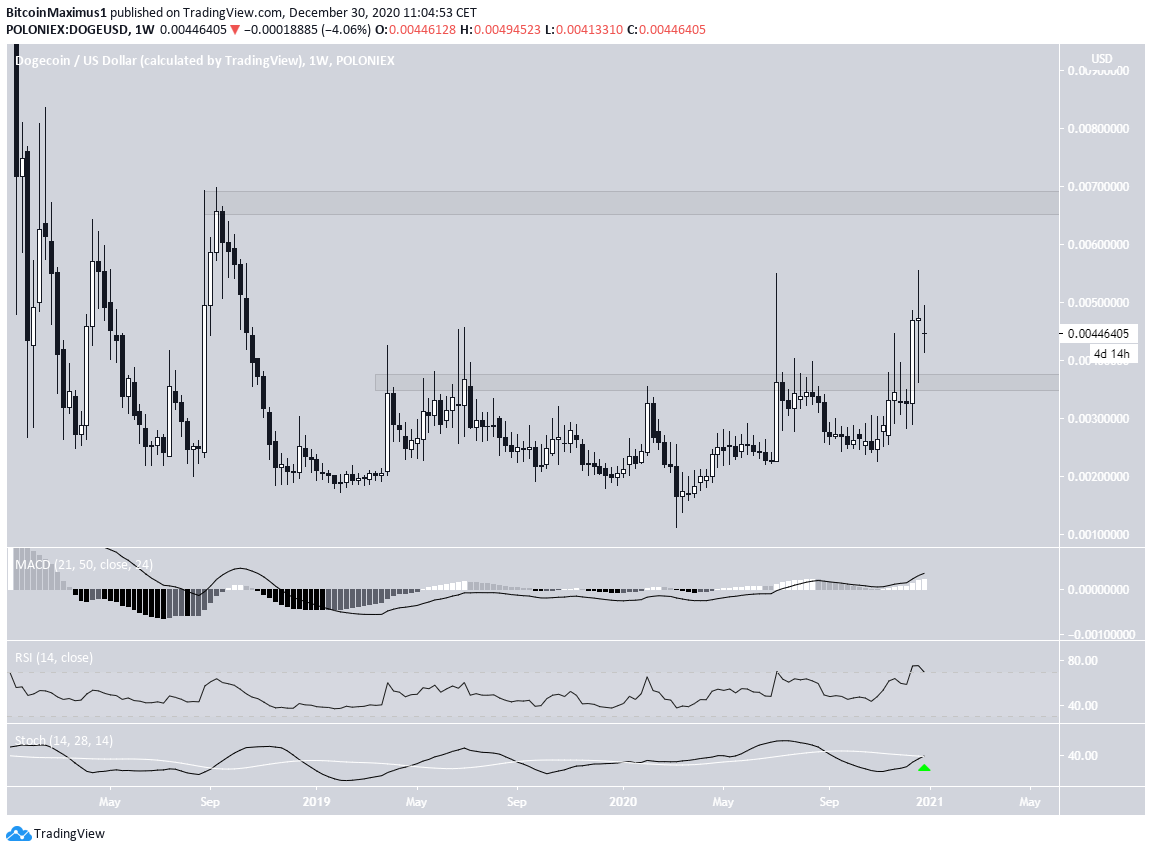
The weekly chart shows that DOGE has broken out and reached a close above the $0.0036 resistance area, something it had not done since the beginning of 2019. Afterwards, it validated this level as support.
The next resistance area, created by the highs of Aug 2018, is at $0.0068.
Technical indicators are bullish and support the possibility that DOGE will rally and reach the area.
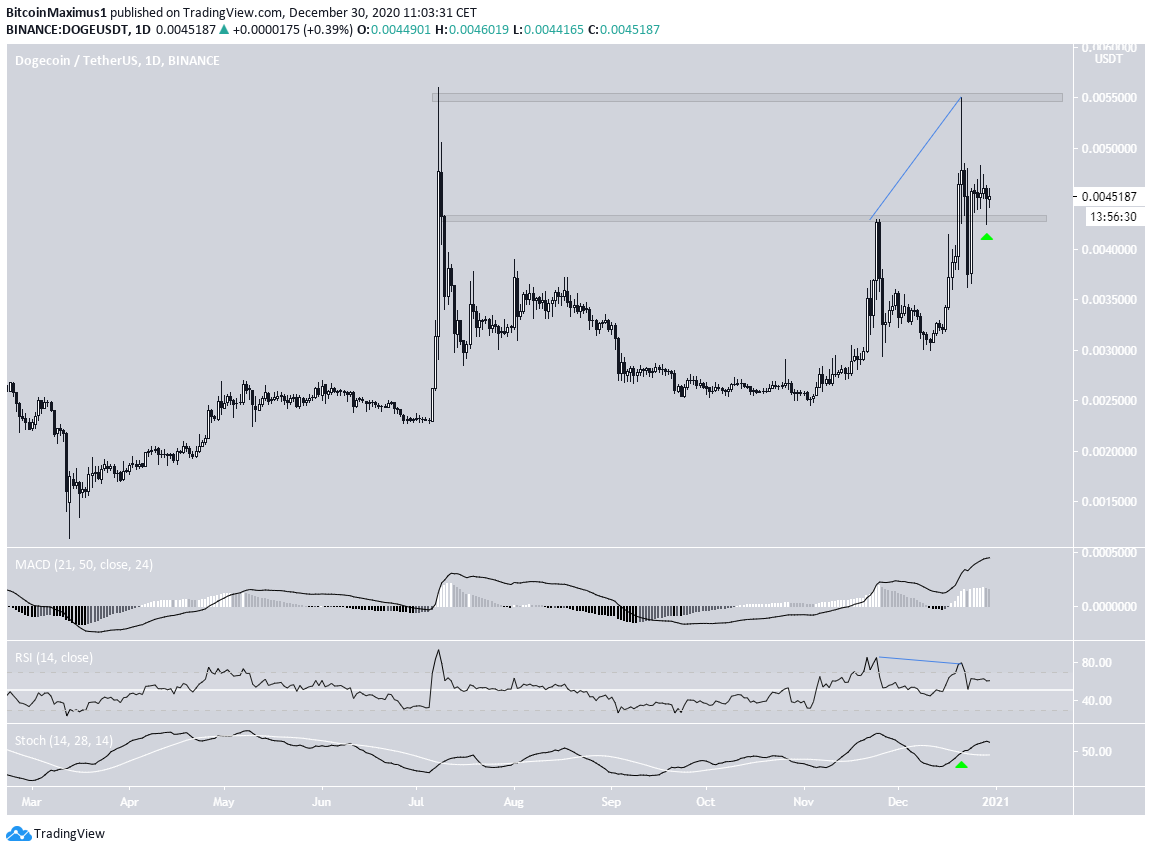
The daily chart shows minor support and resistance levels at $0.0043 and $0.0055, respectively. At the current time, the price was in the process of reclaiming the former. As long as it’s trading above this level, it should continue increasing.
Despite a considerable bearish divergence in the RSI, the MACD and the Stochastic Oscillator are still bullish. Furthermore, a decline has already occurred as a result of the divergence.
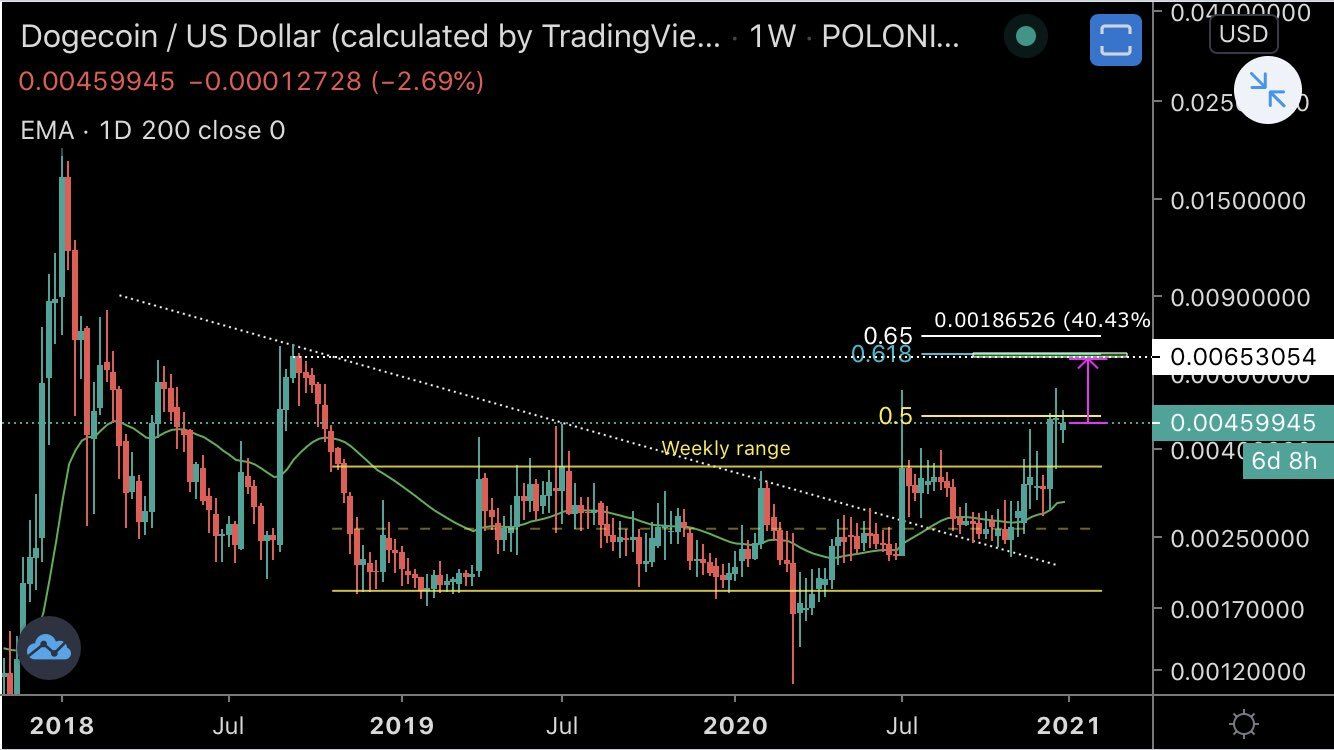
Cryptocurrency trader @Mesawine1 outlined a DOGE chart, stating that the price could increase by another 40% to $0.0065.
The resistance area coincides with the long-term level we have outlined, and both the daily and weekly indicators support this upward movement.
Future Movement
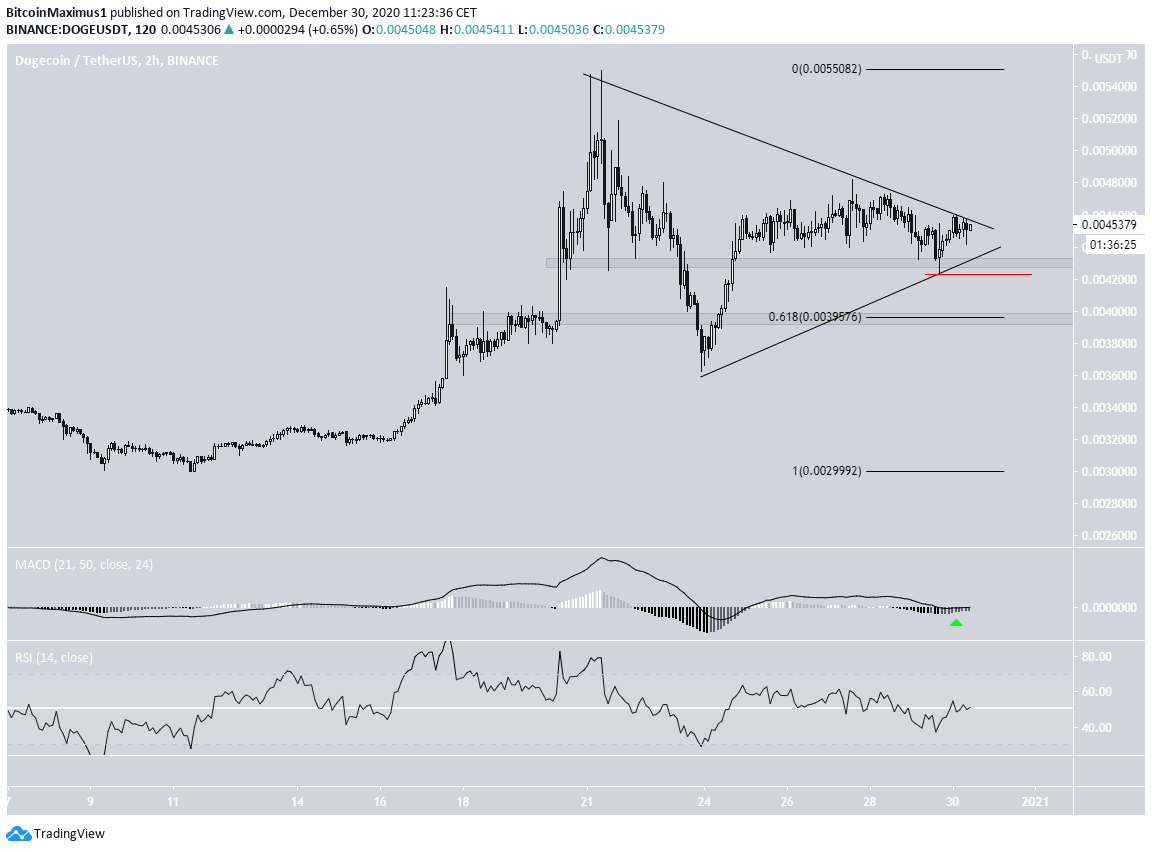
A look at the lower time-frame two-hour chart shows that DOGE is possibly trading inside a symmetrical triangle. Since the triangle is taking place after an upward move, a breakout is likely. The MACD readings also support this idea.
While DOGE initially fell below the $0.004 minor support area, which is the 0.618 Fib retracement level, it reclaimed it shortly afterwards.
A decline below the most recent low of $0.0042 (red line) would invalidate the triangle and suggest that DOGE will revisit the $0.004 level once more before possibly moving higher.
DOGE/BTC
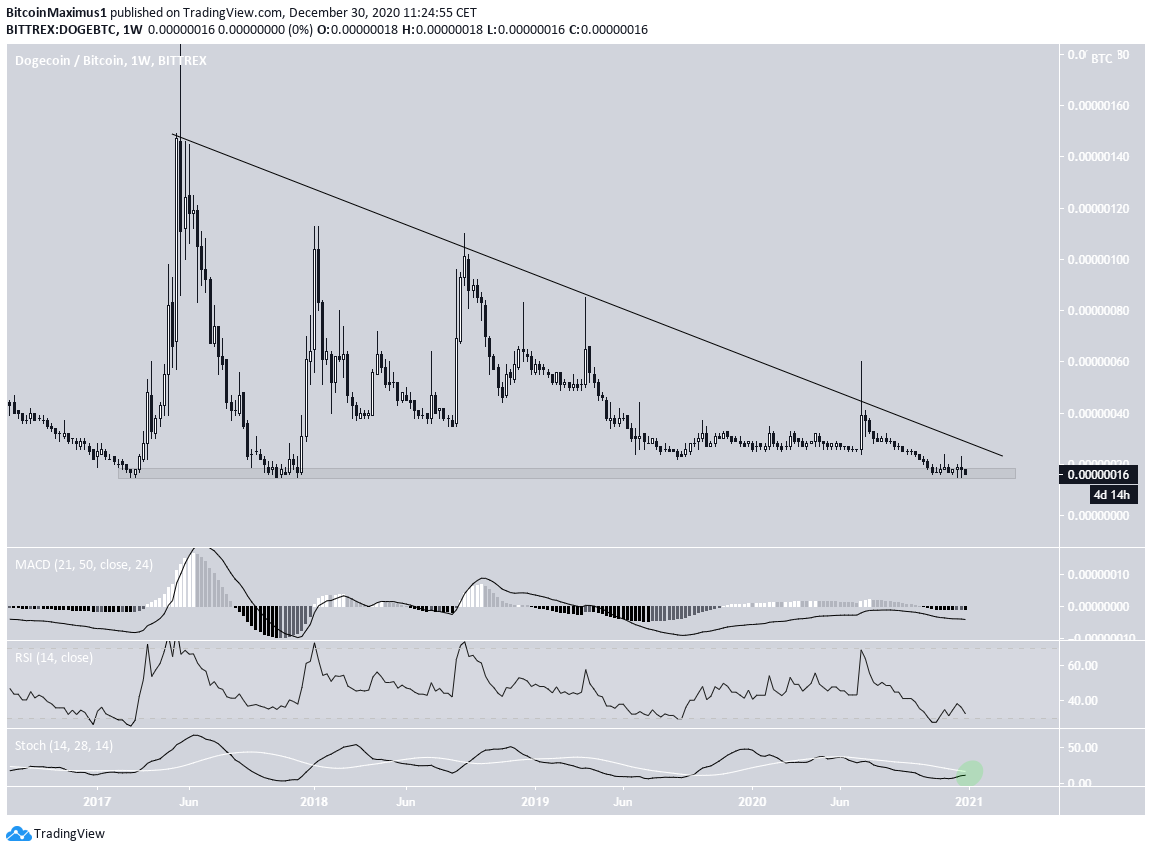
The DOGE/BTC chart shows that DOGE is trading inside the 16 satoshi support area, which has held since Feb 2017. It’s also following a descending resistance line, though, the slope is not entirely clear due to numerous long upper wicks.
Despite being at such a strong support level, there are no bullish reversal signs yet. The bullish trend would be confirmed by a bullish cross in the Stochastic Oscillator and a price increase above this descending resistance line.
Conversely, a weekly close below 16 satoshis would likely cause DOGE to move down into bearish price discovery.
Conclusion
To conclude, DOGE/USD is likely to break out from its current pattern and move towards $0.0055 and possibly $0.0068. While DOGE/BTC is trading inside long-term support, it has yet to show any bullish reversal signs.
For BeInCrypto’s latest Bitcoin (BTC) analysis, click here!
Disclaimer: Cryptocurrency trading carries a high level of risk and may not be suitable for all investors. The views expressed in this article do not reflect those of BeInCrypto.
Disclaimer
In line with the Trust Project guidelines, this price analysis article is for informational purposes only and should not be considered financial or investment advice. BeInCrypto is committed to accurate, unbiased reporting, but market conditions are subject to change without notice. Always conduct your own research and consult with a professional before making any financial decisions. Please note that our Terms and Conditions, Privacy Policy, and Disclaimers have been updated.
