


Between Mar 12 and Mar 13, 2019, a rapid price increase took Dogecoin (DOGE) to a high of $0.0021. A gradual drop followed. Prices subsequently rose to higher heights.
DOGE is currently trading at values reached after the Mar 12-13 spike. Here is the price outlook for the period from Mar 13 to Mar 18:
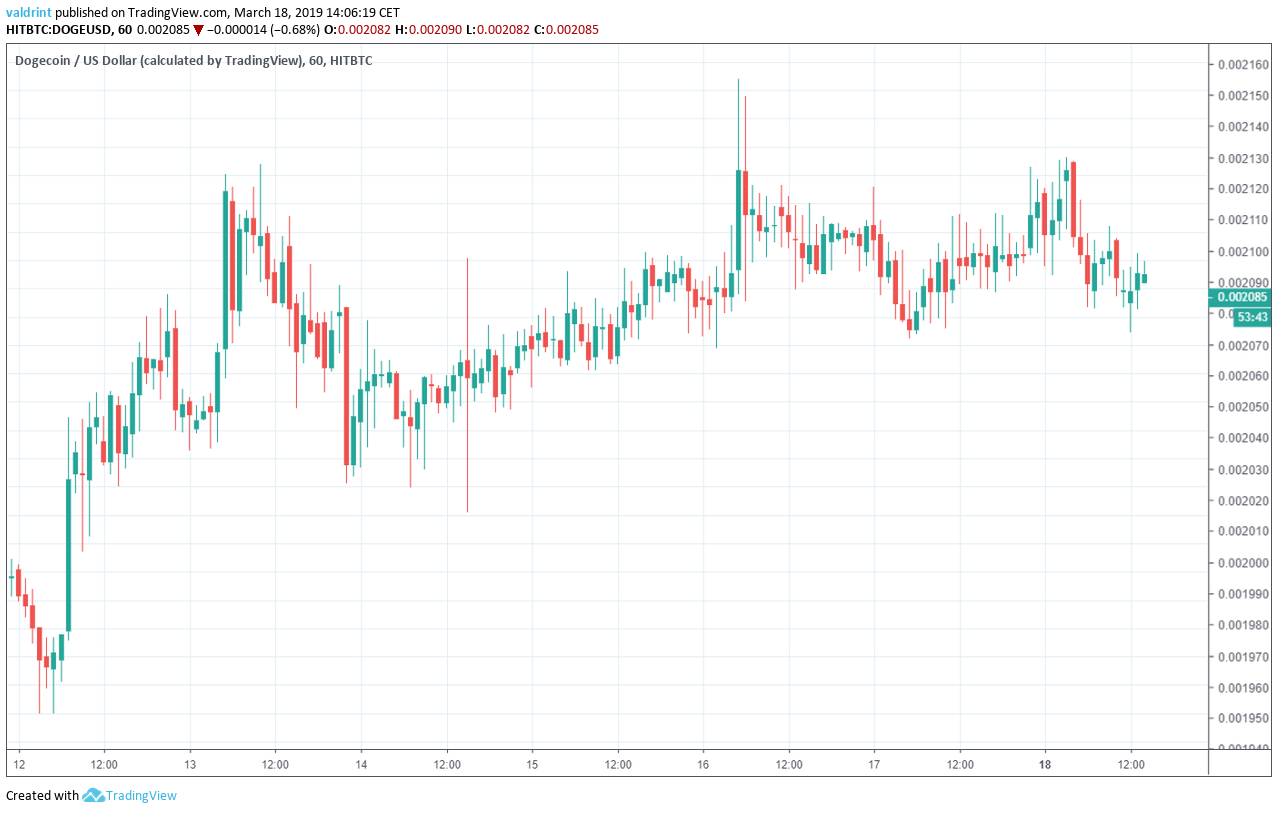
In our Mar 13 price analysis, we predicted that the price of DOGE would drop before subsequent rises. The next day prices fell to the support line. Two days later, a price spike brought prices to highs of over $0.0215.
Read Our March 13 Analysis of Dogecoin (DOGE) By Clicking Here
Today’s analysis suggests that price may continue increasing slightly before an eventual breakdown in the near future.
March 18 Highlights For Dogecoin (DOGE)
- DOGE is trading inside an ascending triangle.
- There is bearish divergence developing in the RSI
- There is resistance near $0.00213.
- There is support near $0.00206 and $0.00196.
Tracing Resistance
The price of Dogecoin on Hitbtc is analyzed at one-hour intervals from Mar 12 to Mar 18.
The price reached a $0.00212 high on Mar 13. A downward move ensued. The price has reached the same level twice since. Tracing these highs gives us a horizontal resistance line.
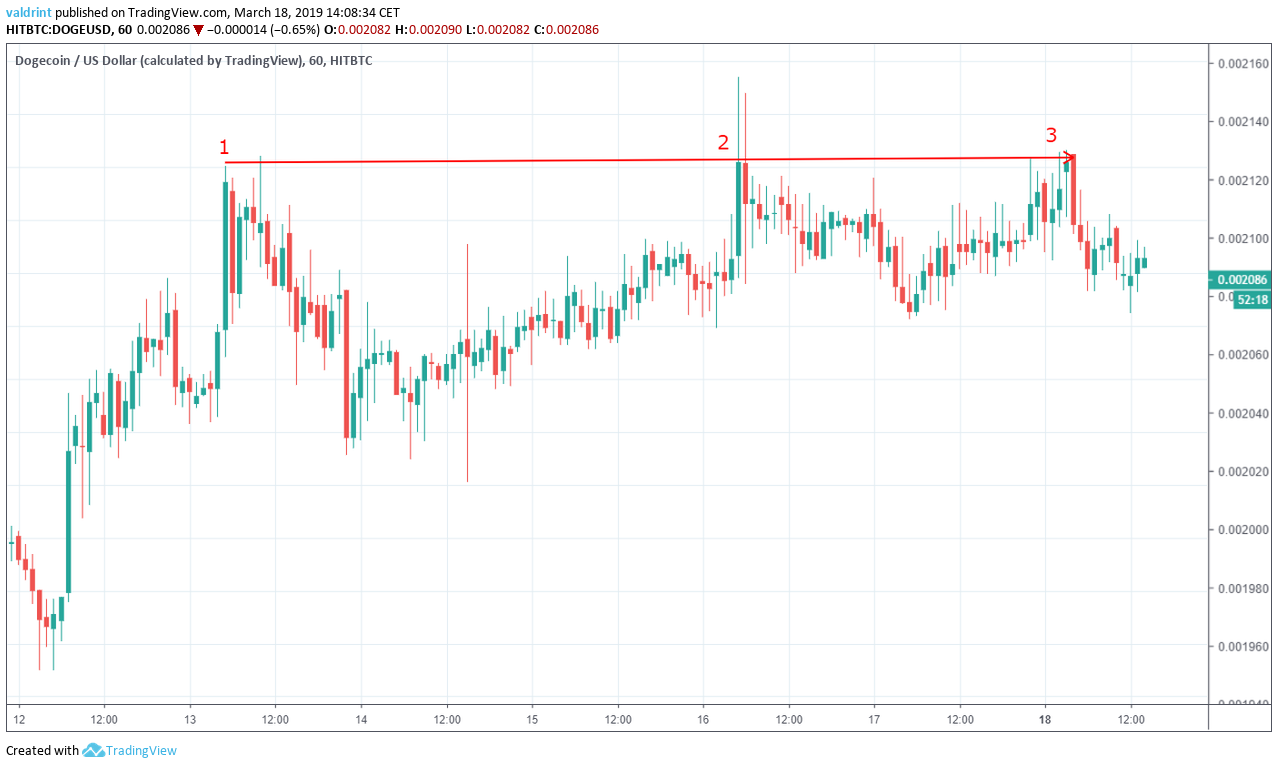
The resistance line acts as a ceiling to price—theoretically tracing the upper limits of the price for a given period. Unless a breakout occurs, it is unlikely that the price will move above this level. Wick breakouts such as the $0.002154 on Mar 16 can be considered insignificant because they were not supported by sustained gains above the line.
It is unlikely that the price moves above this line unless a breakout occurs. The resistance line alone is not sufficient in predicting whether a breakout will occur.
Ascending Triangle
The price reached a Mar 13 low of $0.002011. A gradual upward move ensued. The price has continued to make successive higher lows since.m
Tracing these lows gives us an ascending support line.
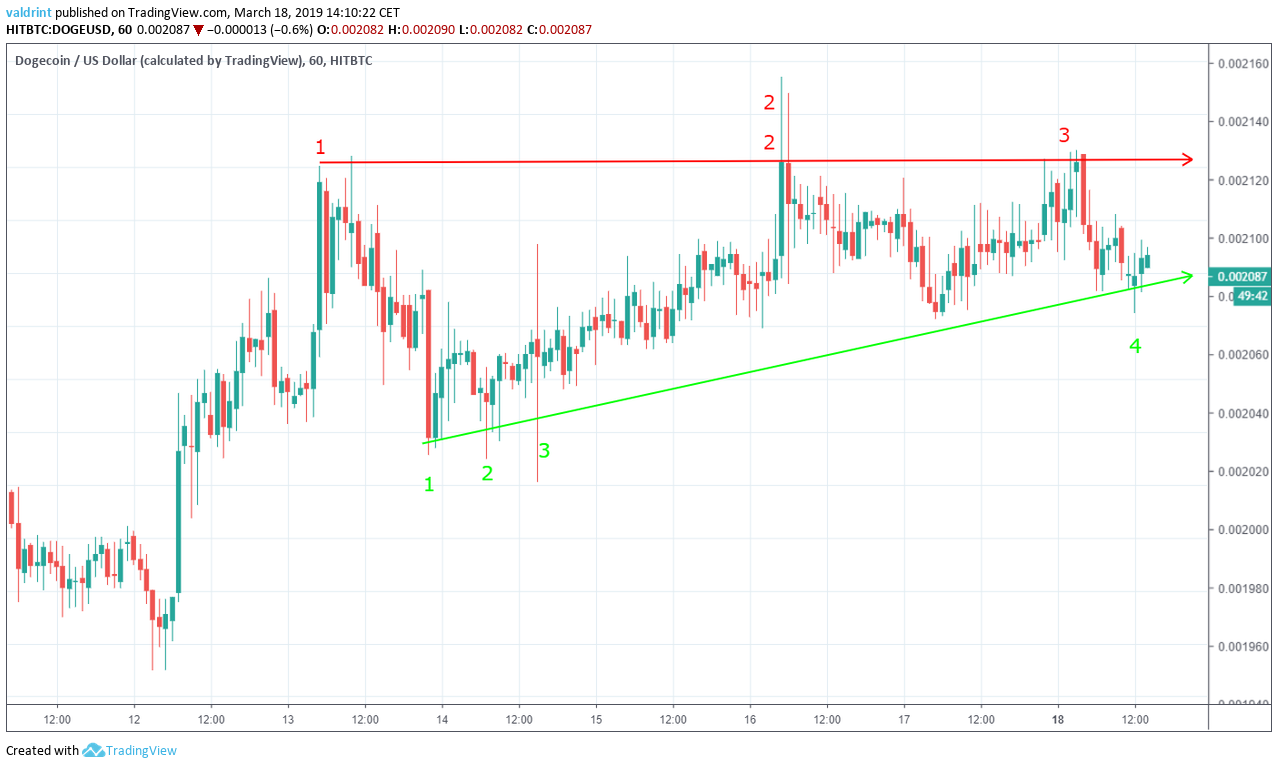
The support line can act as a floor to price similarly to the way resistance acts as a ceiling. It theoretically traces the lower limits of the price over a period of time. It also serves to gauge the rate of the price increase.
Price has increased at the same rate as predicted by the line.
The resistance and support lines combine to create an ascending triangle, which is a bullish pattern, making price increases more likely.
It is likely that the price moves inside the confines of the triangle until a breakdown or breakout occurs.
Bearish Divergence
The moving average convergence divergence (MACD) is a trend indicator that shows the relationship between two moving averages (long and short-term) and the price. It is used to measure the strength of a move.
Combined with simple moving averages (SMA), MACD can be used as a trigger for buy and sell signals. Signals are triggered whenever the MACD line is above 0 and the price is above the 21 (red) and 50-period (green) SMAs.
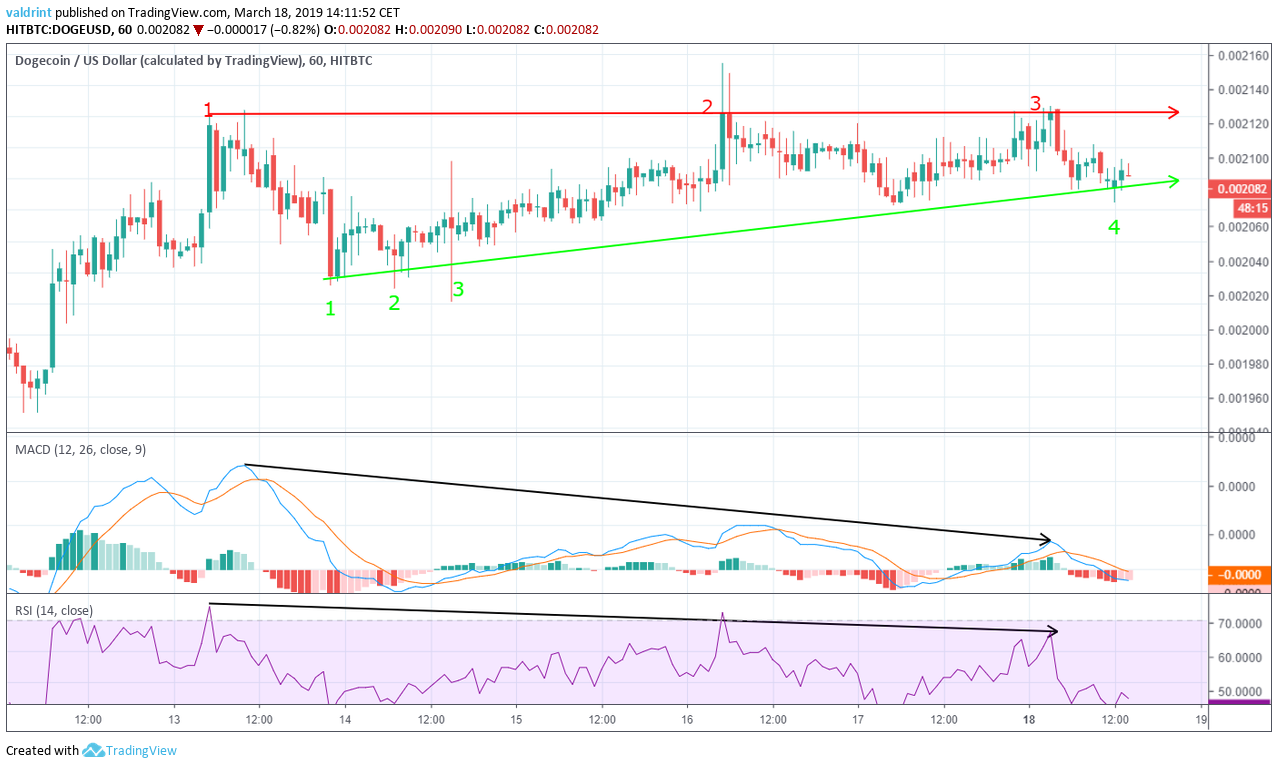
On Mar 13, the price reached a high of $0.00212. It reached the same or a higher level in Mar 16 and Mar 18.
During the same interval, the MACD and RSI reached a high on Mar 13. However, the two subsequent highs were lower.
This is called bearish divergence and often precedes drops in price.
It is especially effective if bearish divergence occurs in a bearish pattern. In the case of DOGE the opposite has occurred—the ascending triangle is a bullish pattern. However, the level of divergence is quite significant and is present in both these indicators.
The indicators provide a conclusion which contradicts the pattern. The level of divergence and the fact that both indicators predict the same thing makes us believe that the price of DOGE will eventually break down from the triangle. However, both options are possible.
Reversal Areas
The price of Dogecoin on Hitbtc is analyzed at two-hour intervals from Jan 10 to Mar 13 in order to better visualize possible reversal areas.
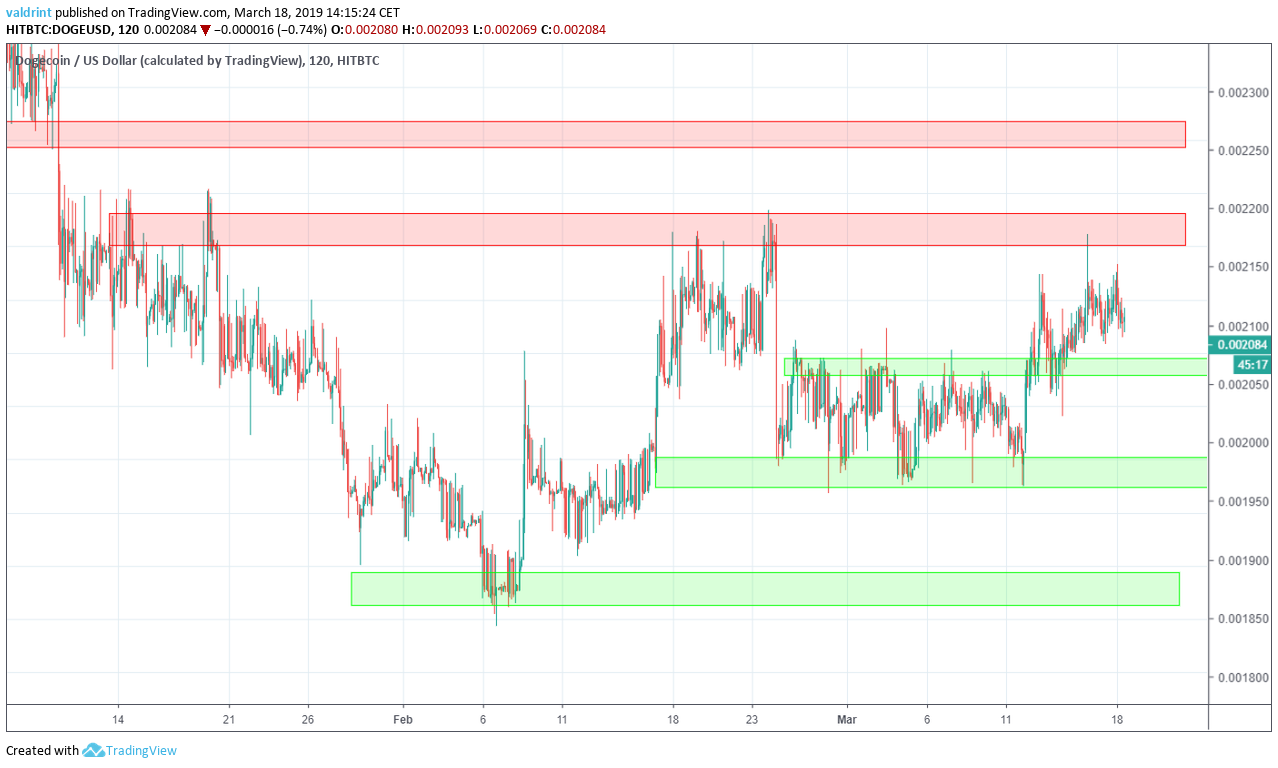
Resistance and support areas are formed when the price reaches a certain level several times. They can act as a ceiling/floor that prevents the price from moving further in that direction.
The first resistance area is found near $0.00218. If the price breaks out from the triangle, this is a likely place for a reversal and a possible future resistance line.
The closest support area is found near $0.00206, followed by the second one at $0.00196. If the price breaks down from the triangle, it is likely that the price will reach the first area. Based on previous movements, it is unlikely that the price will reach the second area.
Summary of Analysis
Based on this analysis, it is likely that the price of DOGE trades inside the confines of the ascending triangle until a point of convergence. Afterwards, we believe that the price will drop and create a new support level, before eventually breaking out of the resistance. If the price does not break out above resistance, this prediction will be partly validated. If it drops below the support line, it will be fully validated.
Do you think the price of DOGE will break out from the triangle? Let us know your thoughts in the comments below.
Disclaimer: This article is not trading advice and should not be construed as such. Always consult a trained financial professional before investing in cryptocurrencies, as the market is particularly volatile.


