
On Apr 1, 2019, the price of Dogecoin (DOGE) began an upward move. It reached a high of $0.0041 on Apr 4. It has been gradually decreasing since.
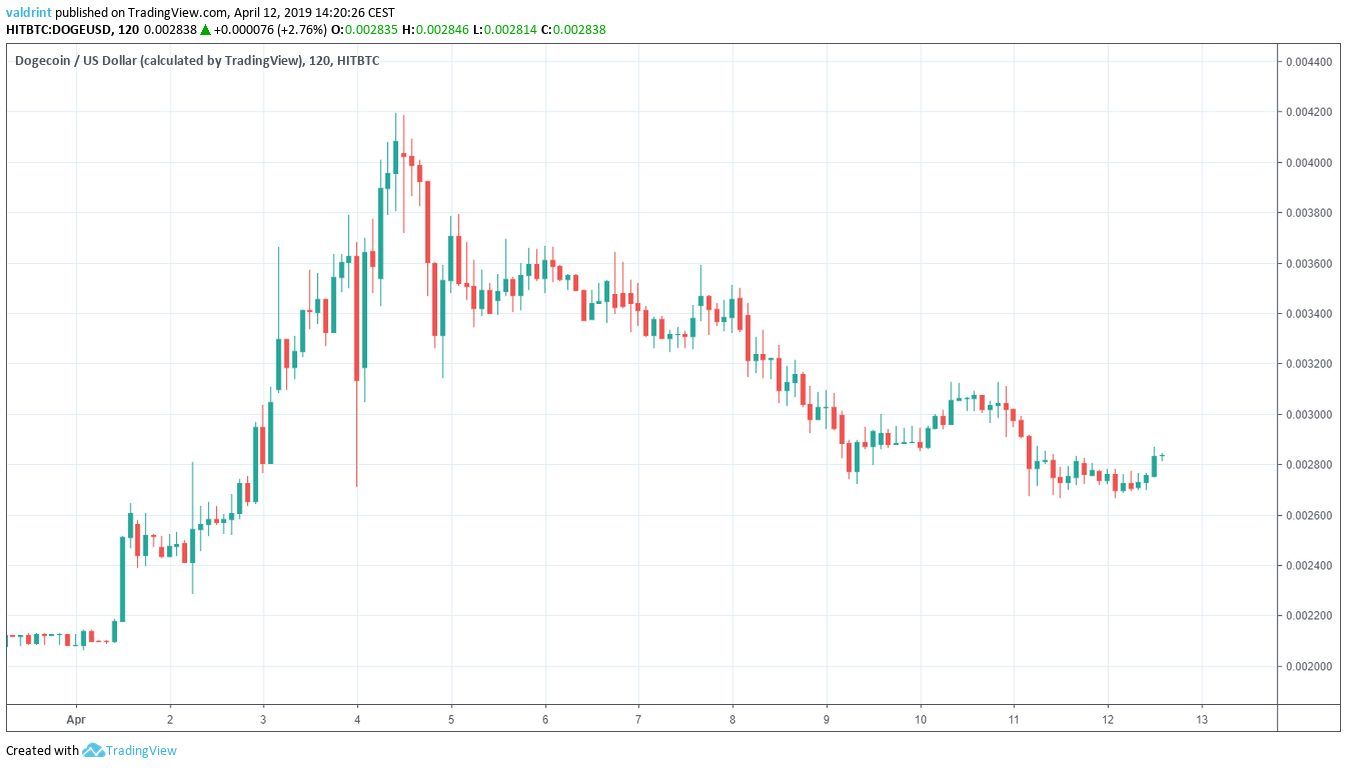
What will happen next?
Let’s find out!
Dogecoin (DOGE): Key Trends And Highlights For April 12, 2019
- The price of DOGE/USD began an uptrend on Apr 1.
- Dogecoin reached a high on Apr 4
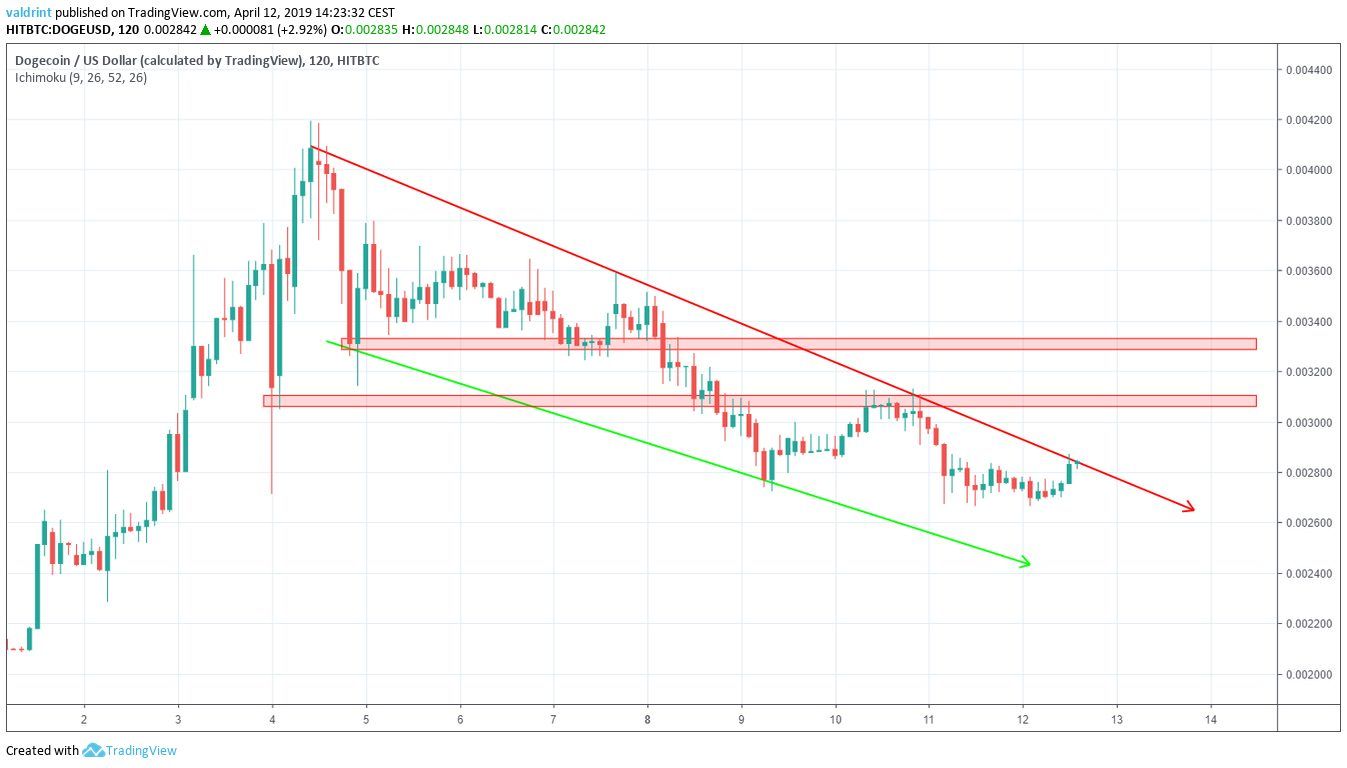
- It has been on a downtrend since and is trading inside a descending wedge.
- A breakout appeas likely.
- There is resistance near $0.0036 and $0.0030.
Descending Wedge
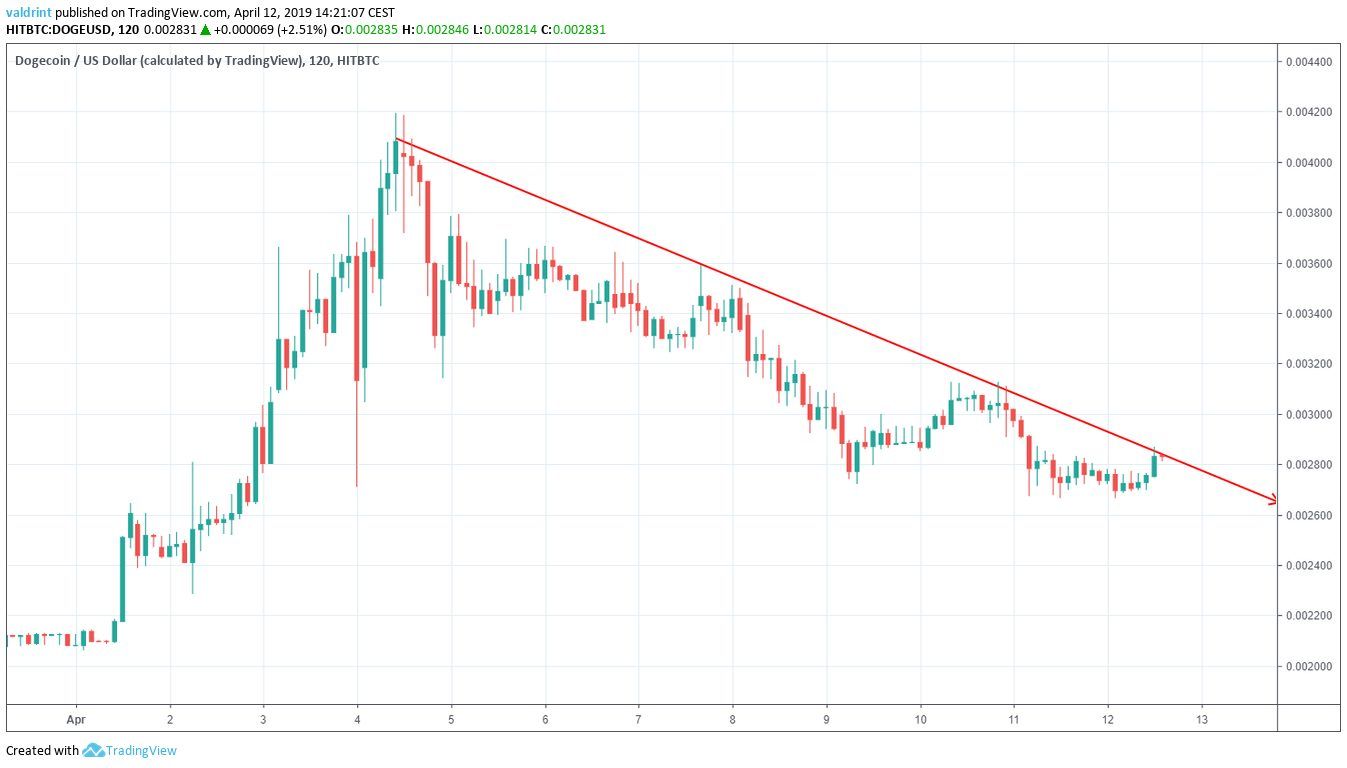
On Apr 4, the price made a low of $0.0041. Since then, several market cycles have been completed with each high being lower than the previous one.
Tracing these highs gives us a descending resistance line:
On Apr 4, the price made a low of $0.0031. A gradual increase was followed by a decrease. The price made a lower low on Apr 9.
Tracing these lows gives us a descending support line.
The support and resistance lines combine to create a descending wedge:
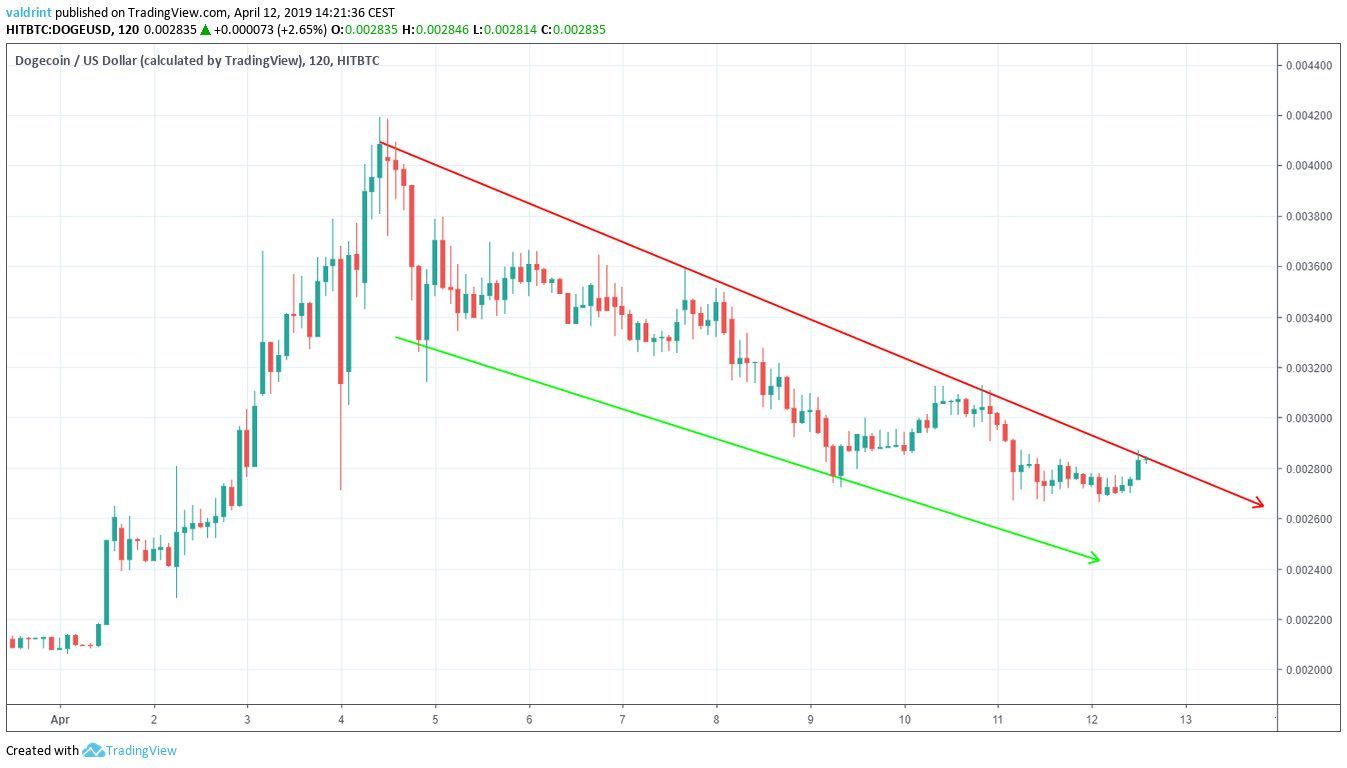
This is a bullish pattern. It suggests price increases and a possible breakout.
Depending on the slope of the resistance line, the price is either breaking out or has already broken out from the descending wedge.
In order to confirm the breakout, we need to look at some technical indicators.
Moving Averages
We begin with MACD and RSI.
The moving average convergence divergence (MACD) is a trend indicator that shows the relationship between two moving averages (long and short-term) and the price. It is used to measure the strength of a move.
Combining MACD and RSI bullish/bearish divergence with support/resistance essentially predicts price fluctuations.
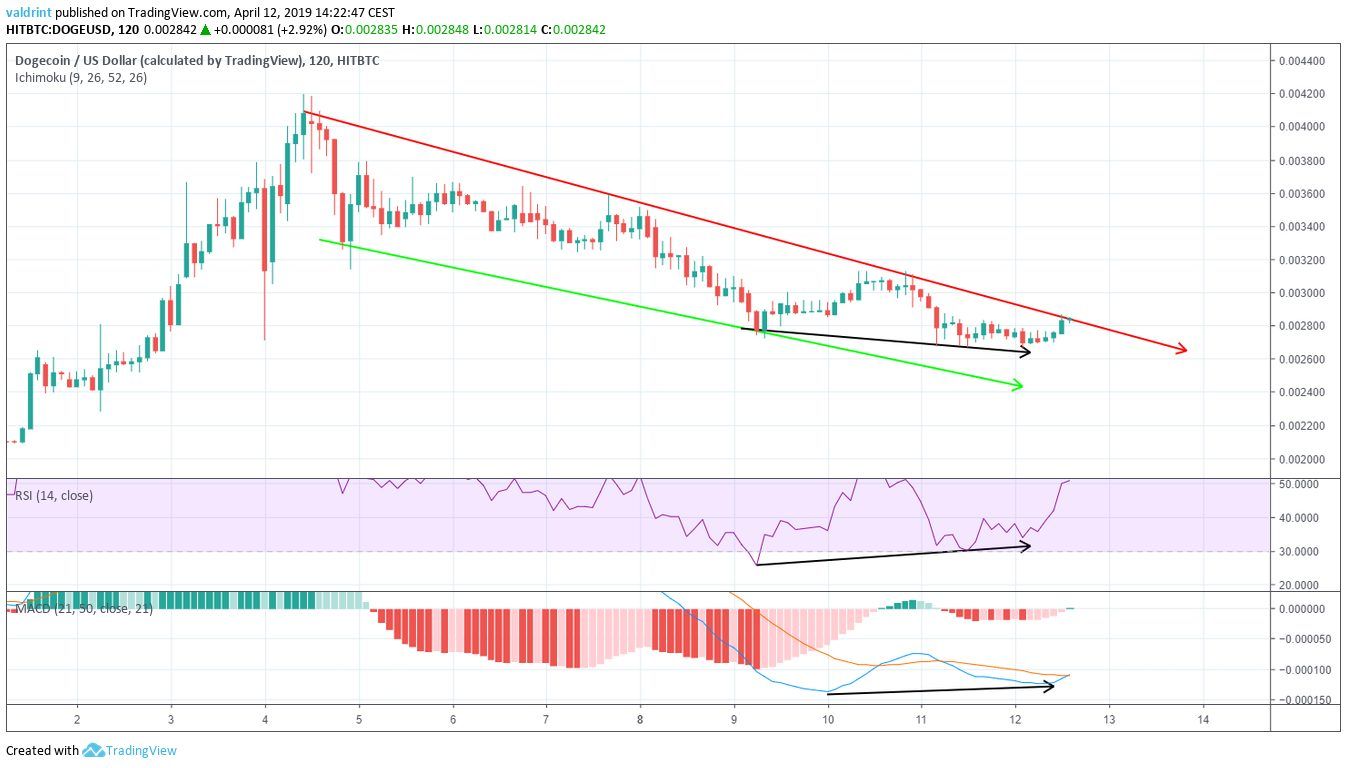 On Apr 9, the price made a low of $0.00272. On Apr 11, it made a lower low of $0.00266.
Similarly, the RSI and the MACD reached the first low on Apr 9. However, they have proceeded to generate higher values.
This is known as bullish divergence and often precedes price increases.
Using these indicators, we believe that a breakout is going to occur in the near future if it has not already begun. Price increases are expected. They could be rapid and significant.
However, a false breakout might occur, in which cases prices would drop back below resistance shortly after breaking out.
Possible Reversal
To determine future areas of reversal, we incorporate resistance areas into the analysis.
The closest resistance area is found near $0.0030. The second one is found near $0.0036. If the price were to break out from the wedge, it would provide a likely reversal area. We believe that the price will reach at least one of these areas, and most likely both of them if the breakout proves to be valid.
Summary of Analysis
Based on our analysis, the price of DOGE is likely to increase towards the resistance areas outlined above.
Do you think Dogecoin will initiate an upward move? Let us know your thoughts in the comments below!
For long-term price predictions of DOGE/USD, click on the green button below:
Disclaimer: This article is not trading advice and should not be construed as such. Always consult a trained financial professional before investing in cryptocurrencies, as the market is particularly volatile.
