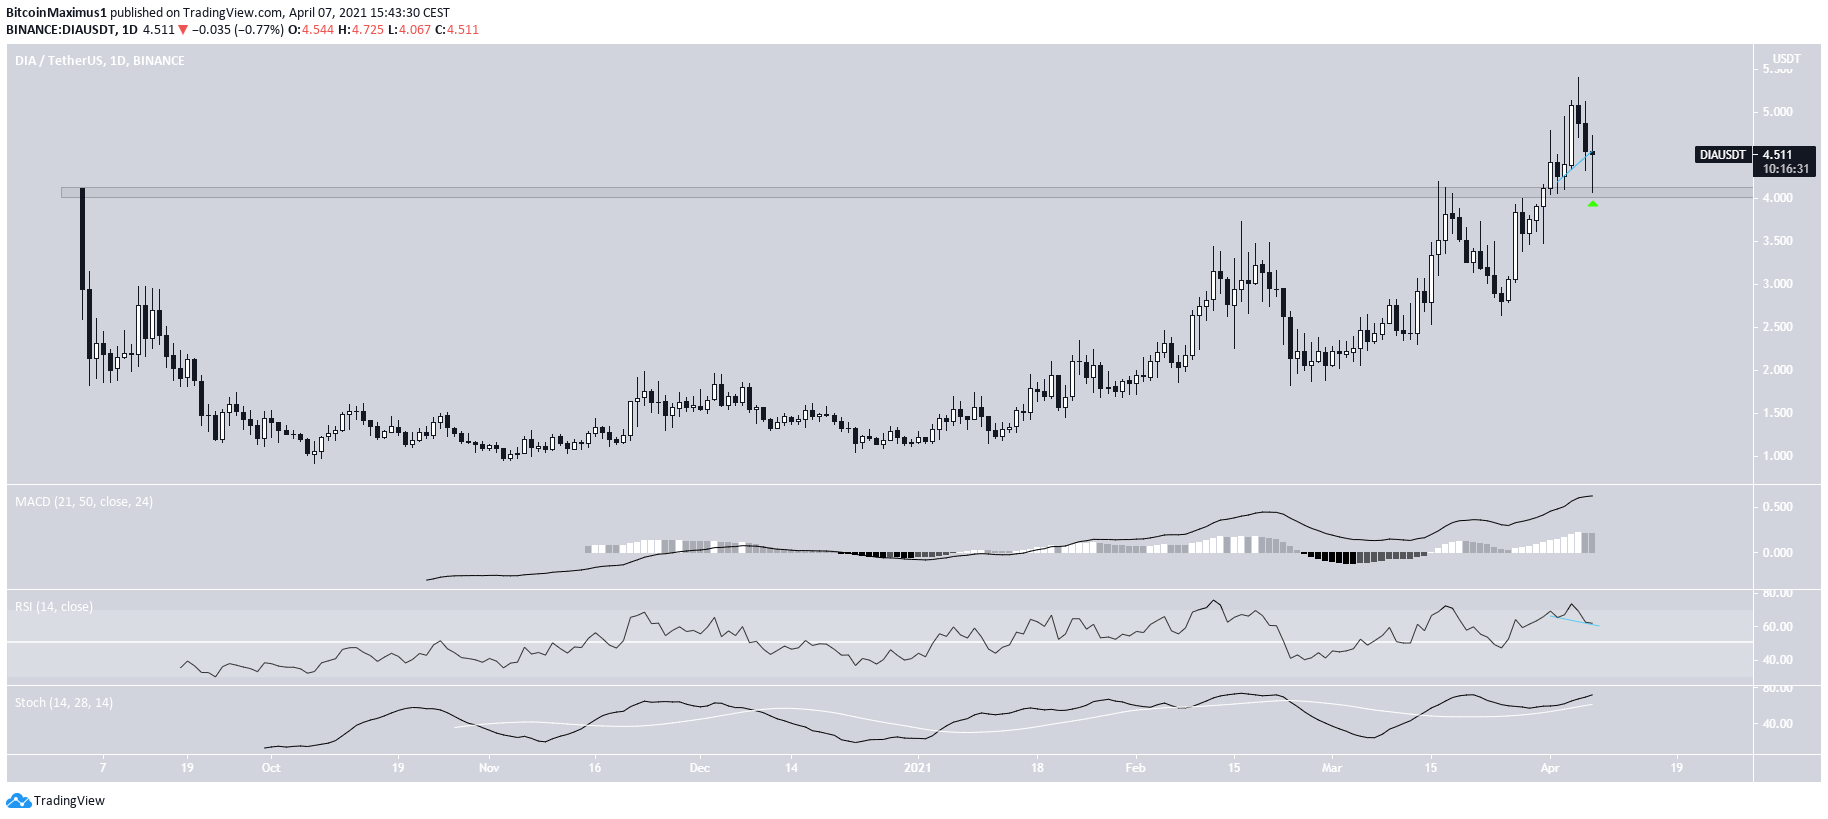
DIA (DIA) has been decreasing since reaching an all-time high on April 5. However, it has bounced on the previous all-time high resistance.
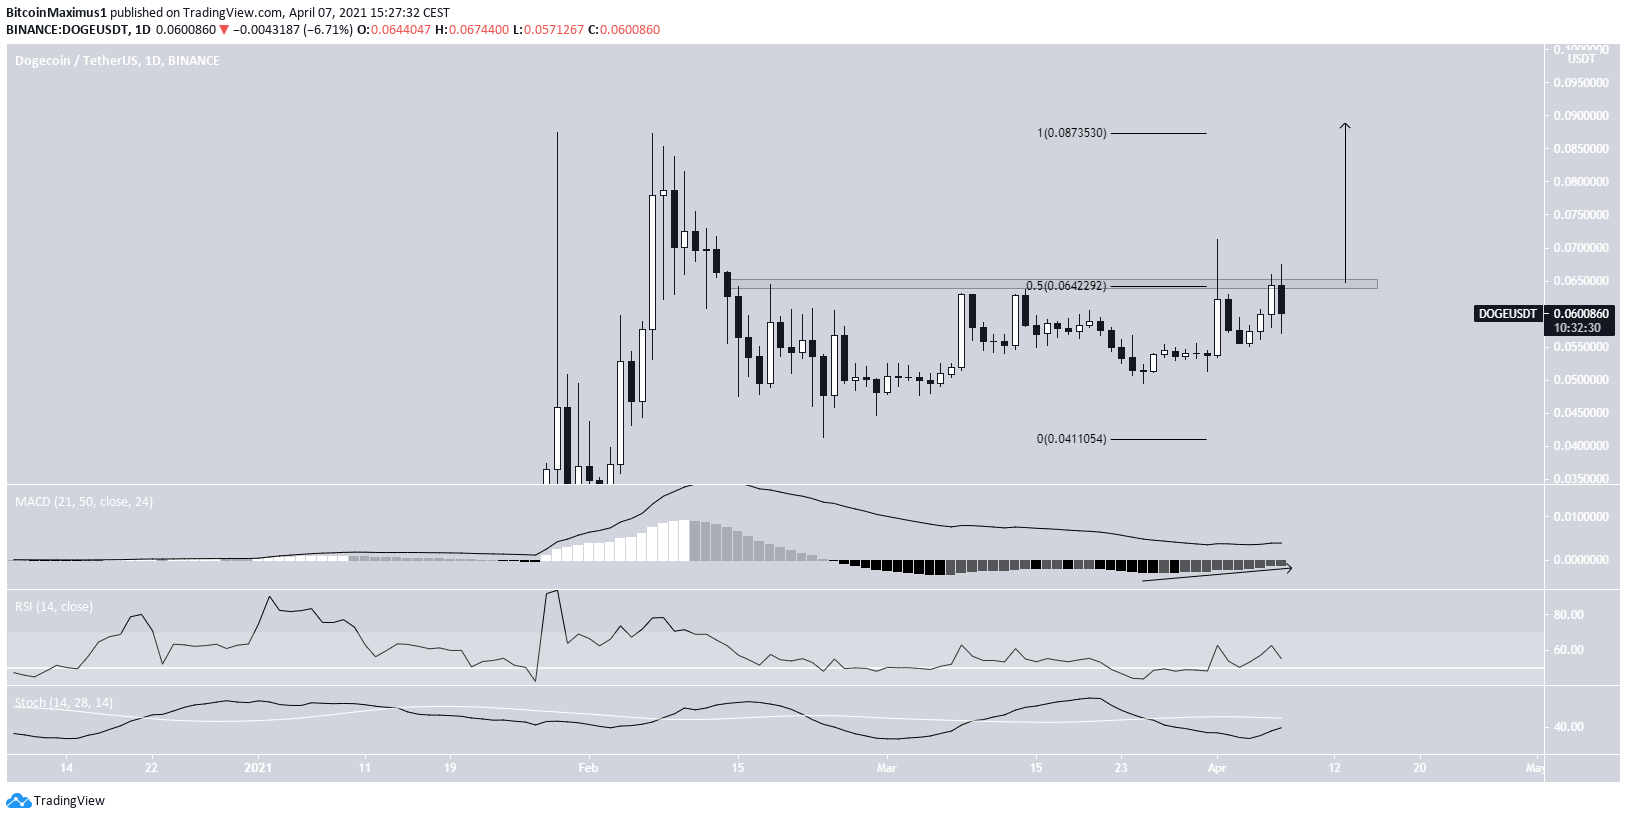
Dogecoin (DOGE) is trading inside an ascending triangle, from which a breakout is expected.
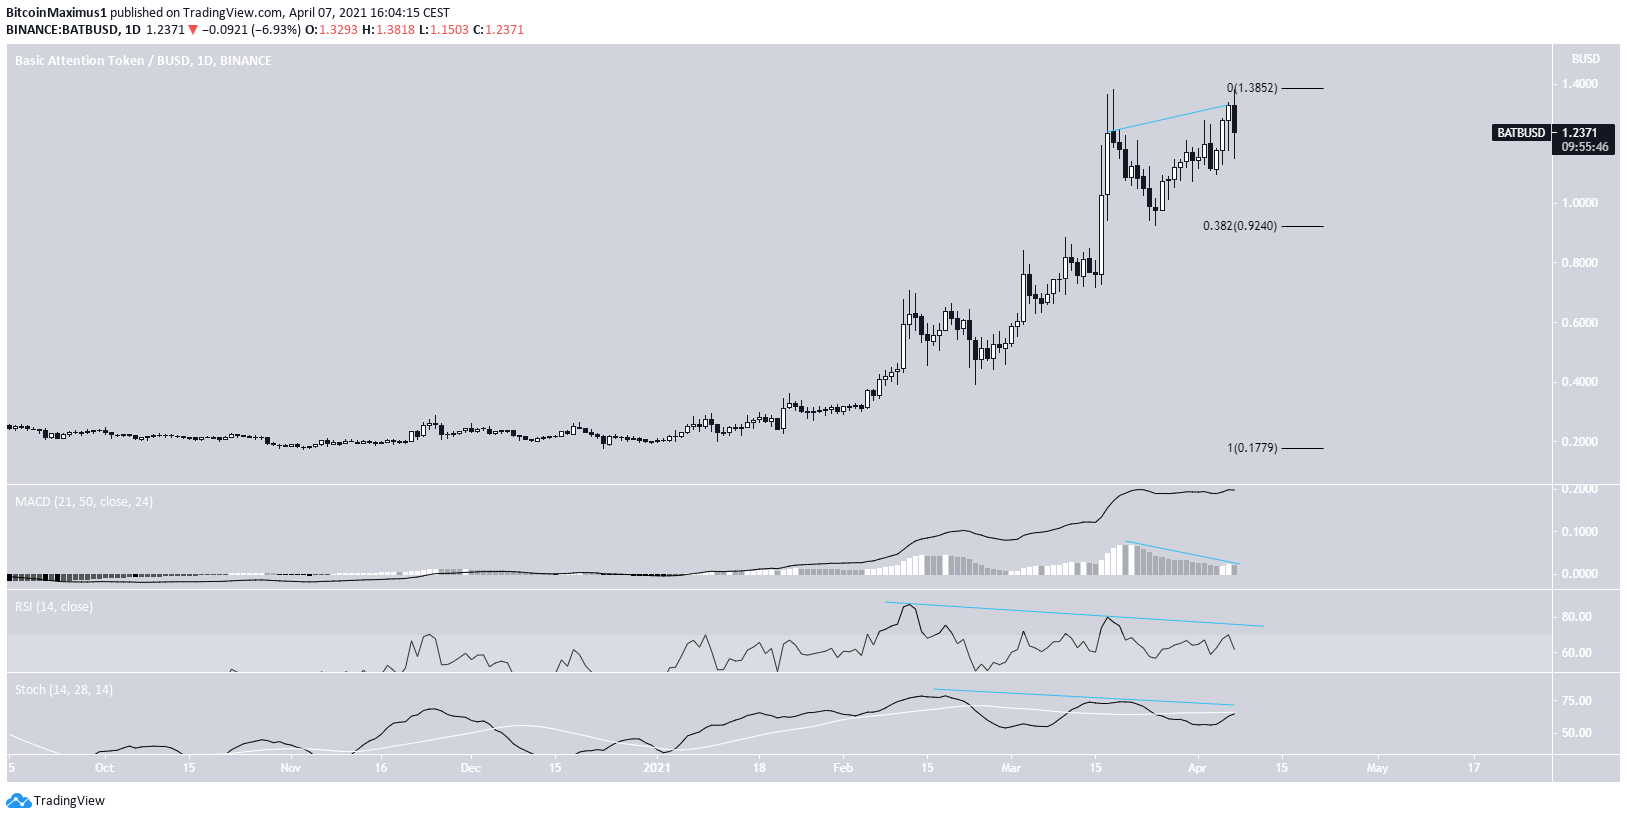
Basic Attention Token (BAT) has potentially created a double top pattern.
DIA (DIA)
DIA has been decreasing since April 5, when it reached an all-time high price of $5.40.
However, the drop took it to the $4.05 area, which previously acted as support. DIA bounced as soon as it reached it and is creating a long lower wick.
This is seen as a sign of bullish pressure.
Also, technical indicators are bullish. Both the MACD & Stochastic oscillator are increasing. Besides, the RSI has generated hidden bullish divergence.
Therefore, a new all-time high for DIA is expected.
Highlights
- DIA reached a new all-time high on April 5.
- It is re-testing the $4.05 level.
Dogecoin (DOGE)
DOGE has been moving downwards since reaching a high of $0.086 on Feb. 17. The decrease continued until Feb. 23, when DOGE began to bounce.
Afterward, the ensuing upward movement took it to the $0.064 resistance area. Besides being a horizontal resistance level, it is also the 0.5 Fib retracement of the previous decrease.
The movement since the bounce resembles an ascending triangle, which is considered a bullish pattern.
So far, DOGE has made four unsuccessful breakout attempts. Despite this, technical indicators are bullish.
The MACD has given a bullish reversal signal, the RSI has crossed above 50, and the Stochastic oscillator is very close to making a bullish cross.
A breakout that travels the entire height of the pattern would take it all the way to the all-time high resistance at $0.087.
Highlights
- DOGE is facing resistance at $0.064.
- It is trading inside an ascending triangle.
Basic Attention Token (BAT)
BAT has been increasing since March 25. The increase took it to a new all-time high price of $1.38 on April 7.
However, BAT dropped almost immediately afterward.
This has created what looks like a double top, which is considered a bearish reversal pattern.
Also, the RSI, MACD & Stochastic oscillator have generated bearish divergence.
Therefore, the most likely scenario would have BAT dropping towards the closest support at $0.92.
Highlights
- BAT has created a double top pattern.
- Technical indicators are showing weakness.
For BeInCrypto’s latest bitcoin (BTC) analysis, click here.
Disclaimer
In line with the Trust Project guidelines, this price analysis article is for informational purposes only and should not be considered financial or investment advice. BeInCrypto is committed to accurate, unbiased reporting, but market conditions are subject to change without notice. Always conduct your own research and consult with a professional before making any financial decisions. Please note that our Terms and Conditions, Privacy Policy, and Disclaimers have been updated.


