


The Dogecoin (DOGE) price has broken out from a long-term resistance level and validated it as support afterwards.
DOGE should continue increasing and break out from the resistance area outlined in the article.
Similarly, DOGE/BTC has reached a crucial long-term support area from which a bounce is likely.
Breakout and Retest
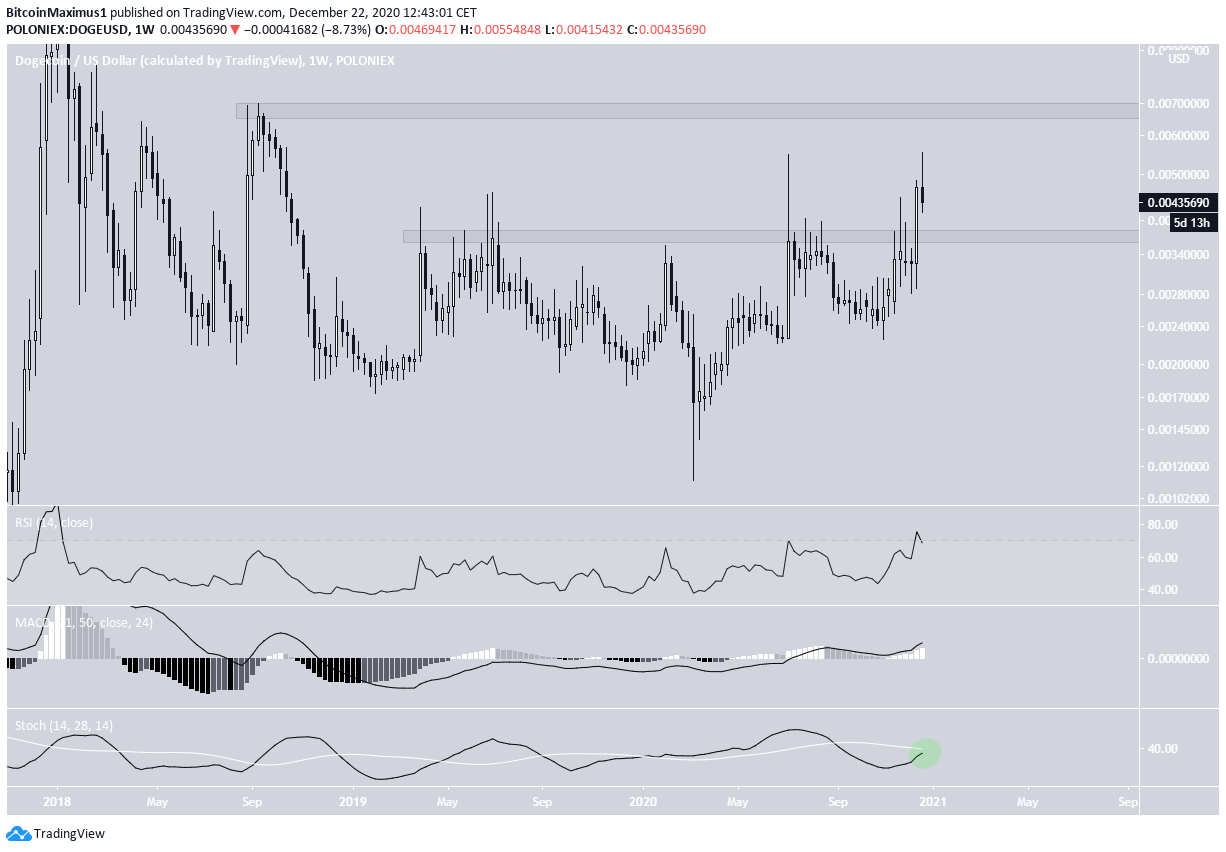
The weekly chart shows that DOGE has been moving upwards since March. While it initially struggled to move above the $0.0035 resistance area, it successfully broke out during the week of Dec 14 – 21. It also reached its highest weekly close since Oct 2018.
Technical indicators are bullish since all three of the RSI, MACD, and Stochastic Oscillators are increasing. The latter is very close to forming a bullish cross.
If the upward move continues, the next resistance area is at $0.0068.
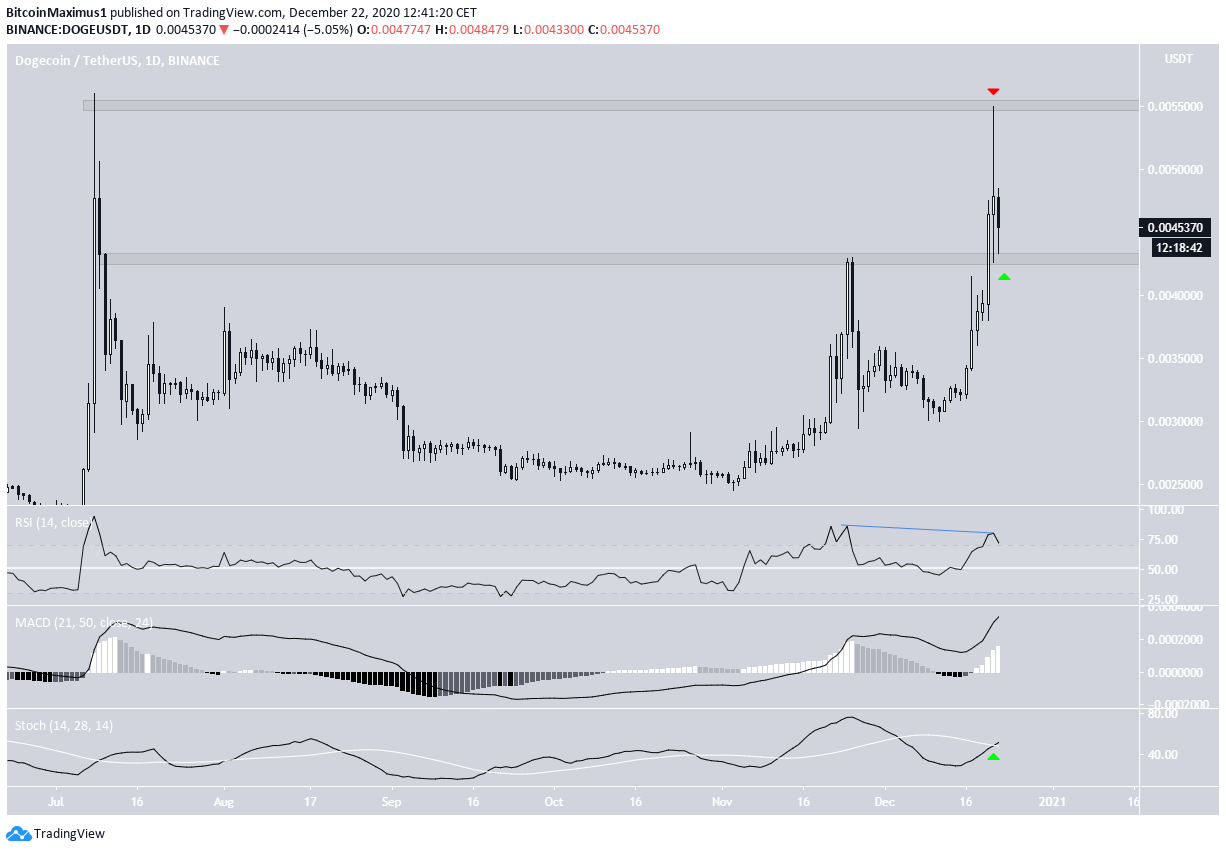
The daily chart provides a similar outlook.
DOGE has broken out from and validated the $0.0043 area. However, the long upper wick from yesterday simultaneously validated the $0.0055 area as resistance.
Technical indicators are similarly bullish, despite the bearish divergence in the RSI. The MACD is increasing, and the Stochastic Oscillator has almost made a bullish cross.
Therefore, it’s likely to attempt another breakout above the $0.0055 resistance area before possibly moving higher to $0.0068.
DOGE/BTC
Cryptocurrency trader @CryptoMichNL outlined a DOGE chart, stating that it has reached a crucial support level where a bounce is likely.
Targets for the bounce include 69, 91, and 109 satoshis.
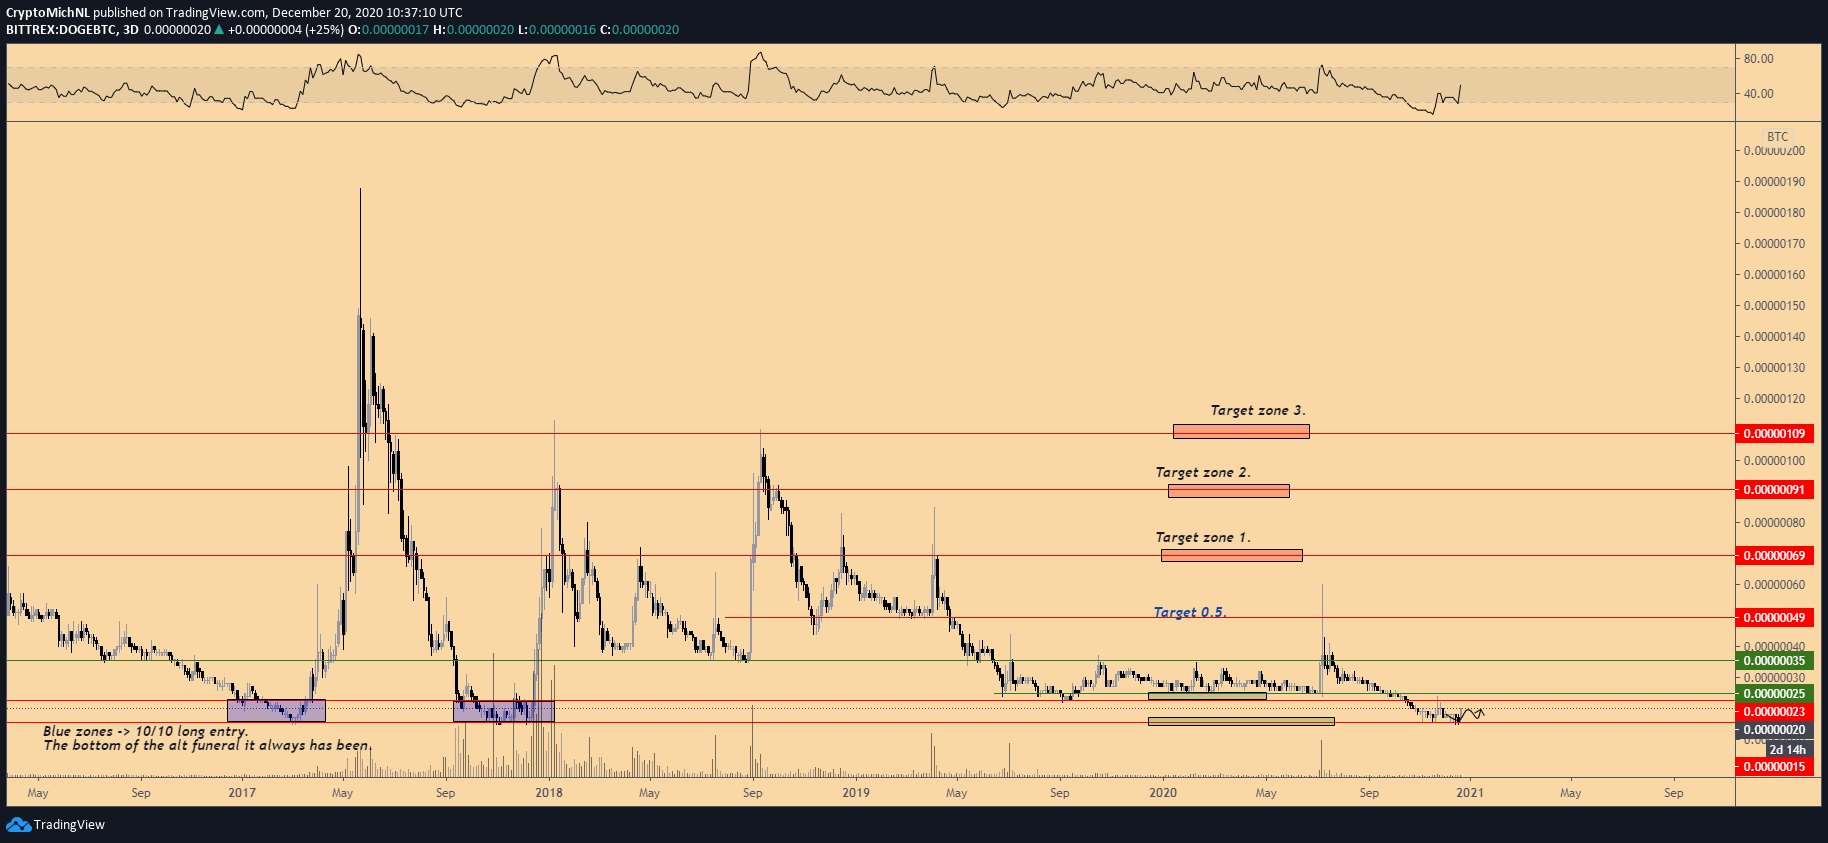
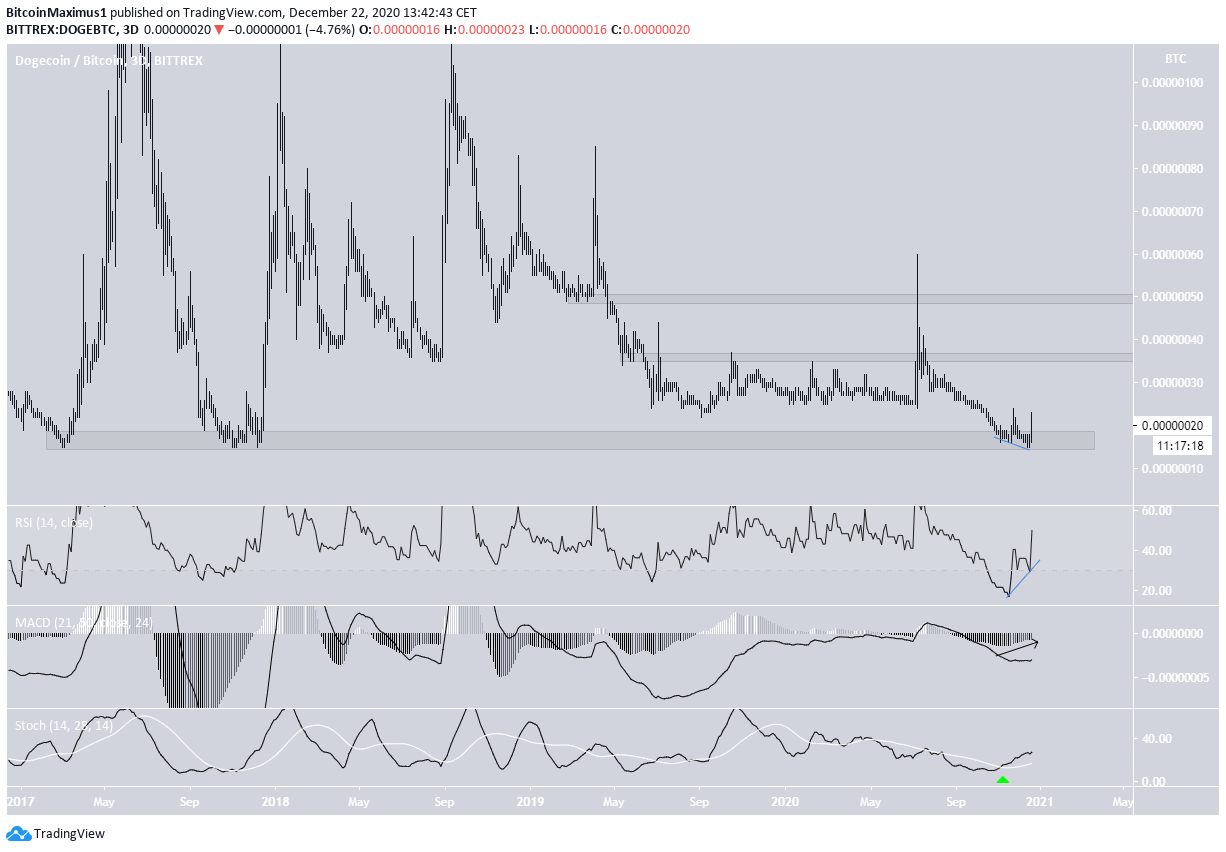
The support is at 17 satoshis and has been in place since the beginning of 2017. DOGE has been trading inside this over the past two months, forming significant bullish divergence up to the three-day RSI.
Furthermore, the MACD shows a bullish reversal sign, and the Stochastic Oscillator has just made a bullish cross.
Therefore, DOGE should continue rallying towards the next closest resistance areas at 35 satoshis and possibly 50 satoshis.
Conclusion
To conclude, DOGE could make another attempt to break out above the $0.0055 resistance area and, if successful, move towards $0.0068.
DOGE/BTC is also likely to bounce from the current support area and move towards 35 and possibly 50 satoshis.
For BeInCrypto’s latest Bitcoin (BTC) analysis, click here!
Disclaimer: Cryptocurrency trading carries a high level of risk and may not be suitable for all investors. The views expressed in this article do not reflect those of BeInCrypto.


