
Dogecoin (DOGE) broke out above the $0.265 horizontal area on Aug. 11 and is currently in the process of validating it as support.
While it is likely that DOGE is in a corrective structure, another higher high would be likely before a potential long-term drop.
DOGE reclaims horizontal level
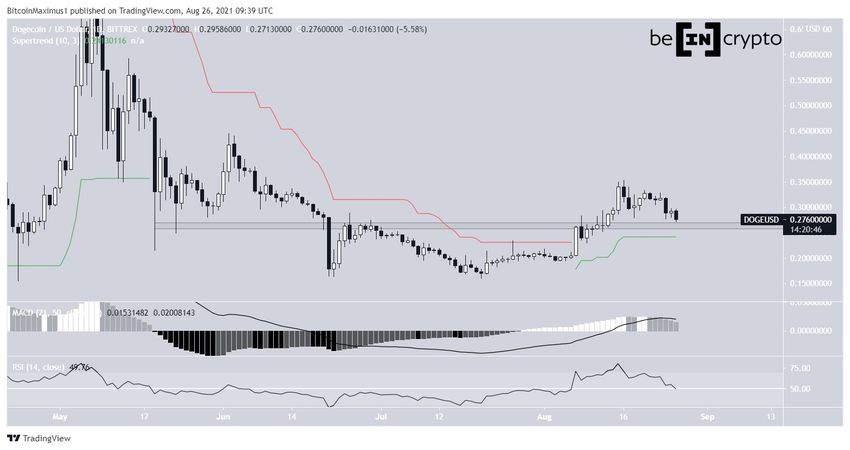
DOGE initiated an upward movement on June 22 and created a higher low on July 20. On Aug. 11, it managed to break out above the $0.265 horizontal resistance area and proceeded to reach a high of $0.352 on Aug. 16.
It has been decreasing since, potentially returning to validate the $0.265 area as support. The area also coincides with the Supertrend support line (green line).
However, both the MACD and RSI are decreasing, and the latter is close to falling below 50.
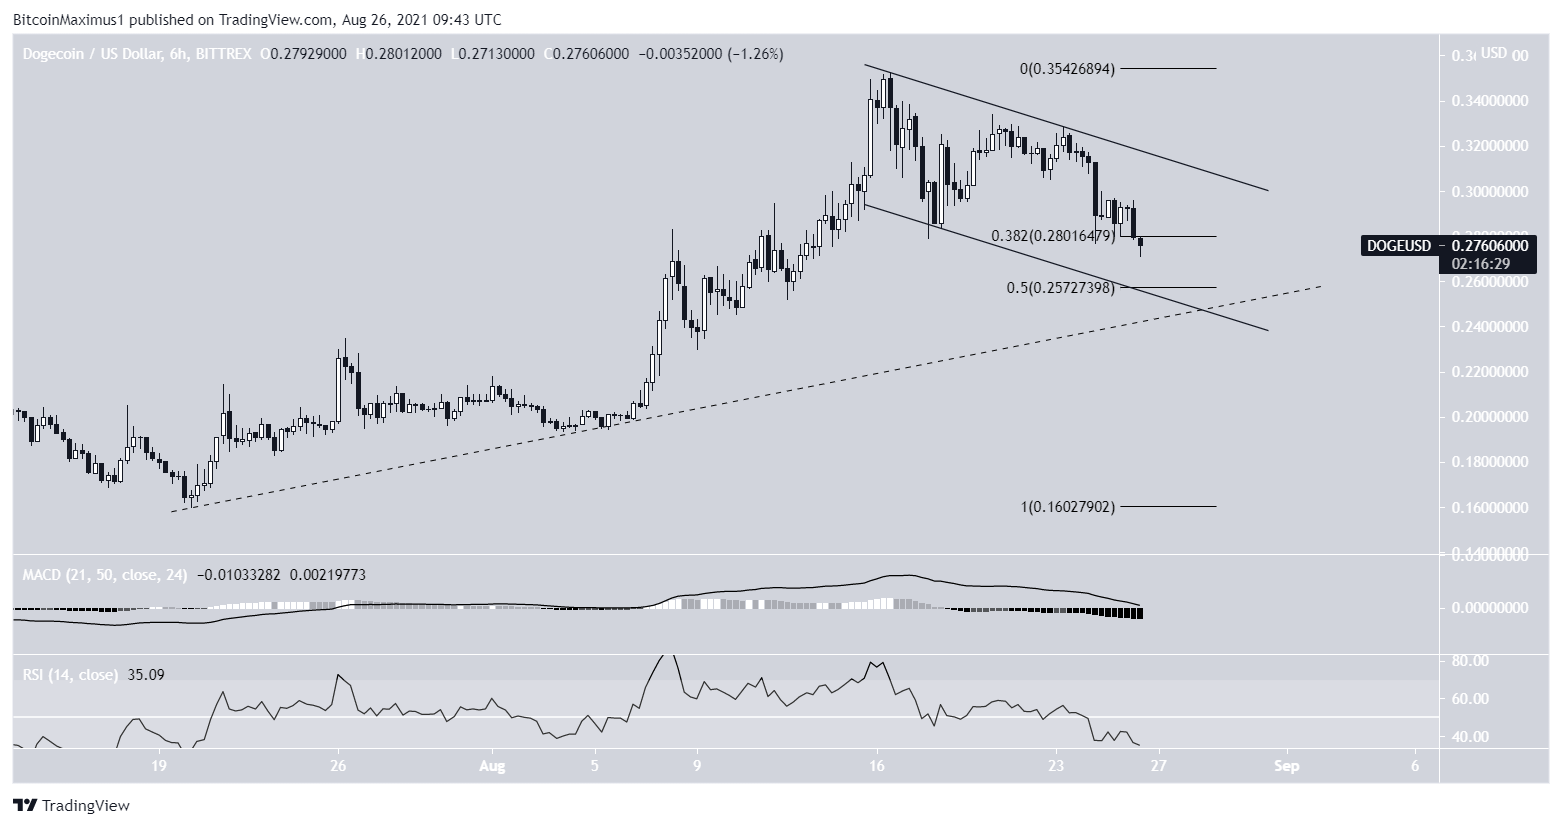
The shorter-term six-hour chart supports the possibility that DOGE will drop towards the $0.265 area.
The token is potentially following an ascending support line (dashed), which coincides with the previously outlined area. In addition to this, there is another confluence of support levels created by the 0.5 Fib retracement support area and the support line of a descending parallel channel.
Finally, both the MACD and RSI are bearish, indicating that there is more downside to come.
Wave count
Cryptocurrency trader @TheTradingHubb outlined a DOGE chart, stating that the token is completing a long-term B wave before another sharp drop.
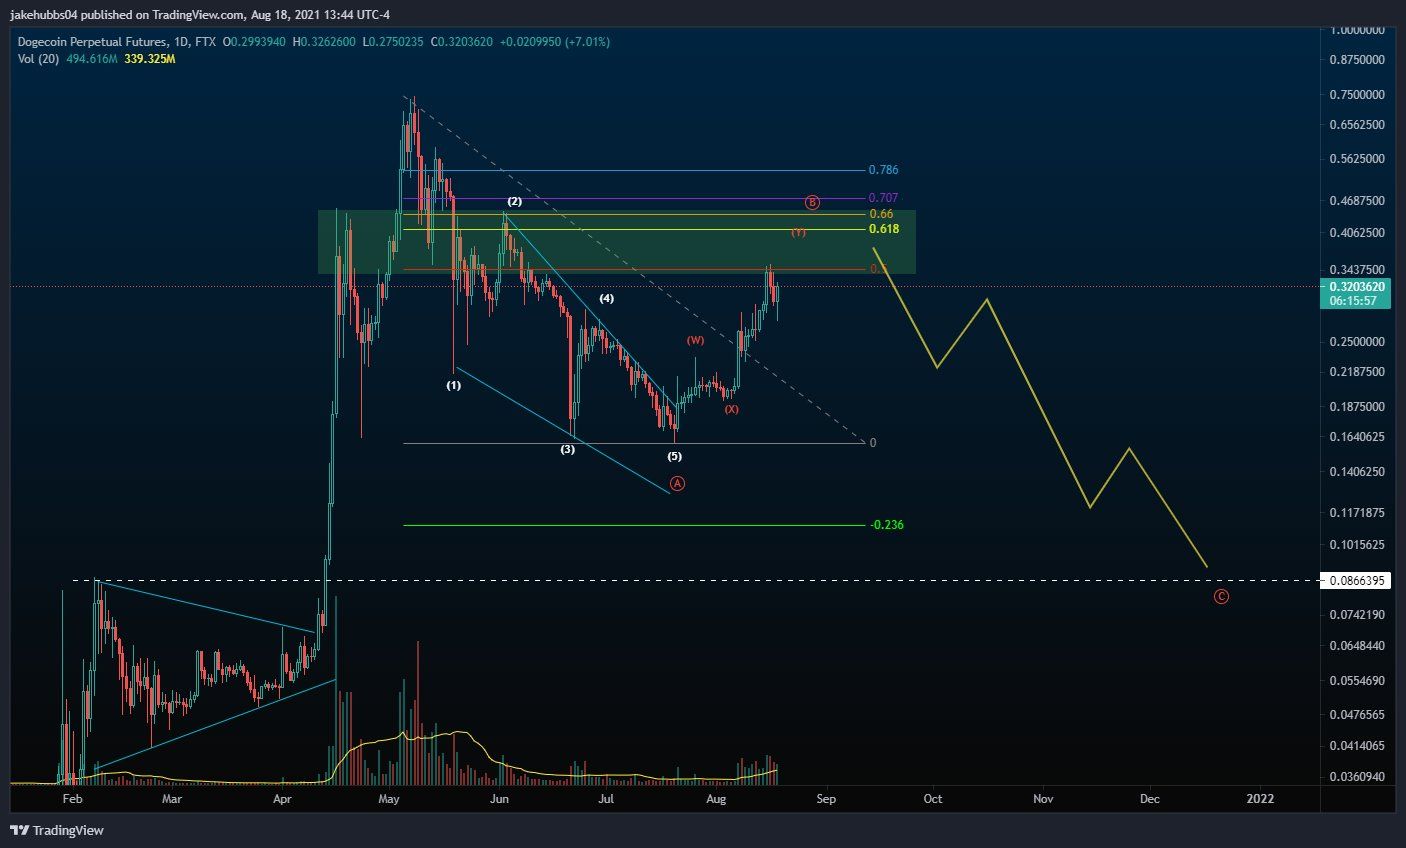
The downward movement following the May 8 all-time high price does indeed resemble a leading diagonal (black). Therefore, it is very likely that it is part of wave A of an A-B-C corrective structure (orange). In this case, the ensuing breakout from the wedge is part of wave B.
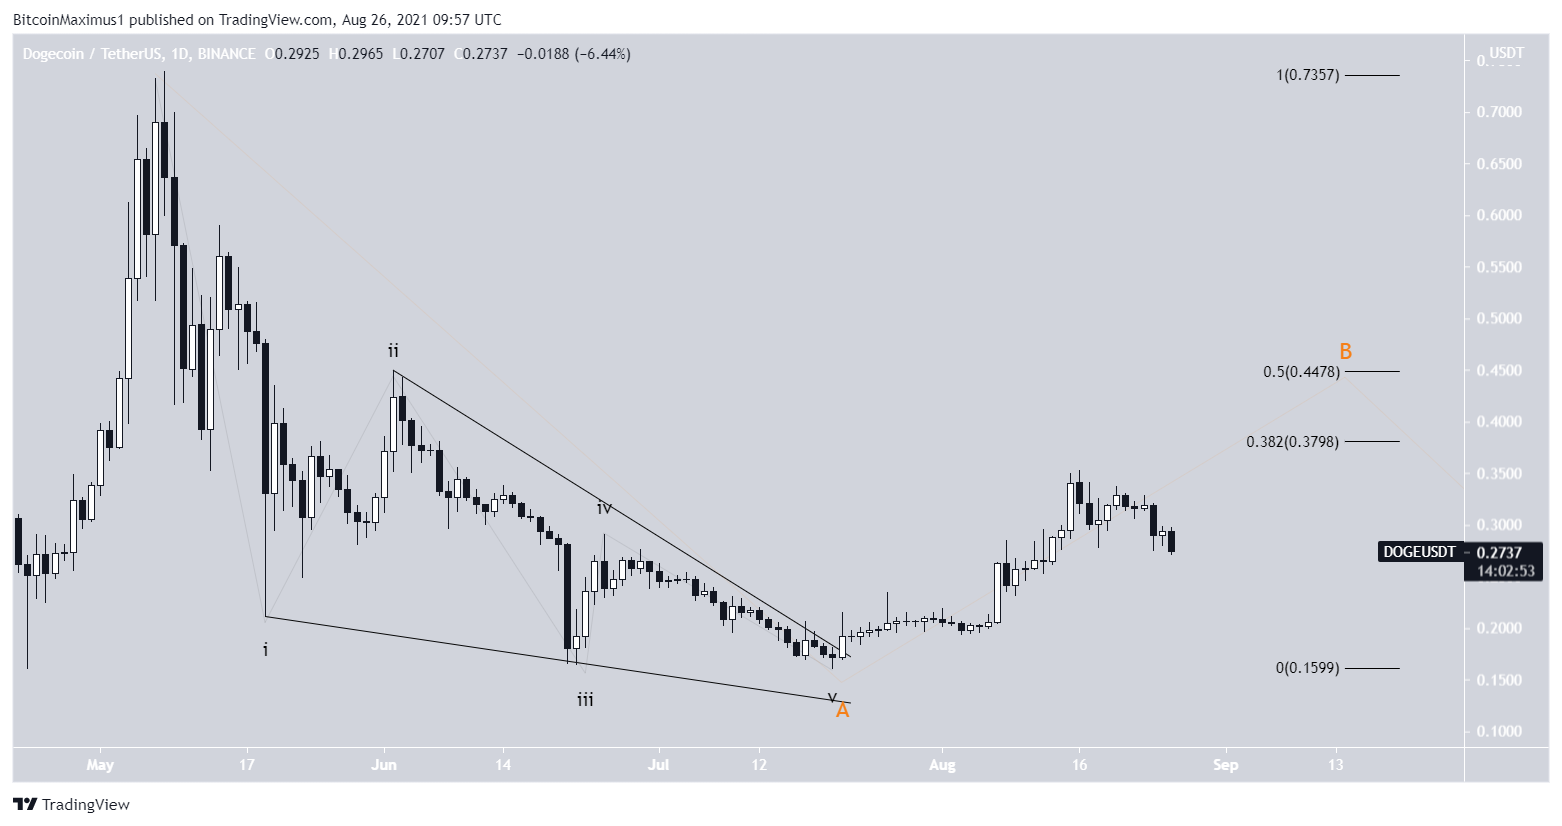
An interesting development is that fact that wave B has yet to reach even the 0.382 Fib retracement resistance level. This is unusual, since corrective B wave are expected to at least reach this level.
Therefore, it is likely that another upward movement will follow after the bounce at the aforementioned support area.
For BeInCrypto’s latest Bitcoin (BTC) analysis, click here.
