
The Bitcoin price has been decreasing since Feb 13, when the price reached a local high of $10,504. However, things took a turn for the worse on March 12, as the price plummeted by more than $3,000 in a single day.
Since the aforementioned decrease, the Bitcoin price has been gradually moving upwards, already recouping the majority of its losses. At the time of publishing, BTC is only less than 3% below the price on March 12.
Nevertheless, the current movement is still considered a retracement rather than a new upward trend, since the price has yet to reach a higher-high relative to the price before it crashed.
Well-known trader @Pentosh1 outlined a plan to short BTC if the price gets to his target area found at $7,950. A price that also coincides with the 200-day moving average (MA).
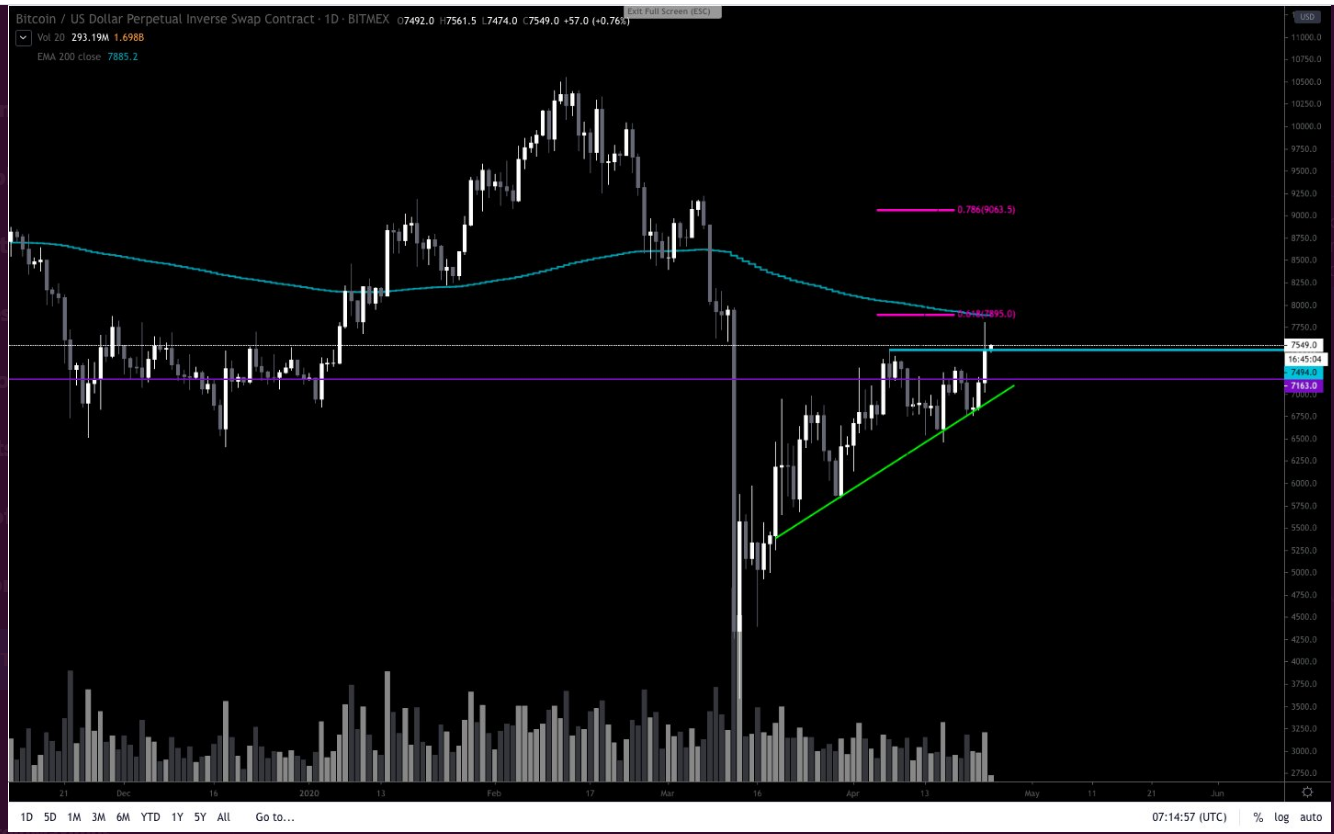
Pentosh remains worried about the CME expiry date and important Fib levels, that could provide strong resistance to the price on the way up:
Worried that CME is gunna do me a bamboozle We are pumping into expiry day, into the .618 and 200D EMA. I’ve gotten so excited by all the fun I’ve almost completely ignored this trade plan from a month ago. Time to pay attention
Bitcoin’s Overhead Resistance
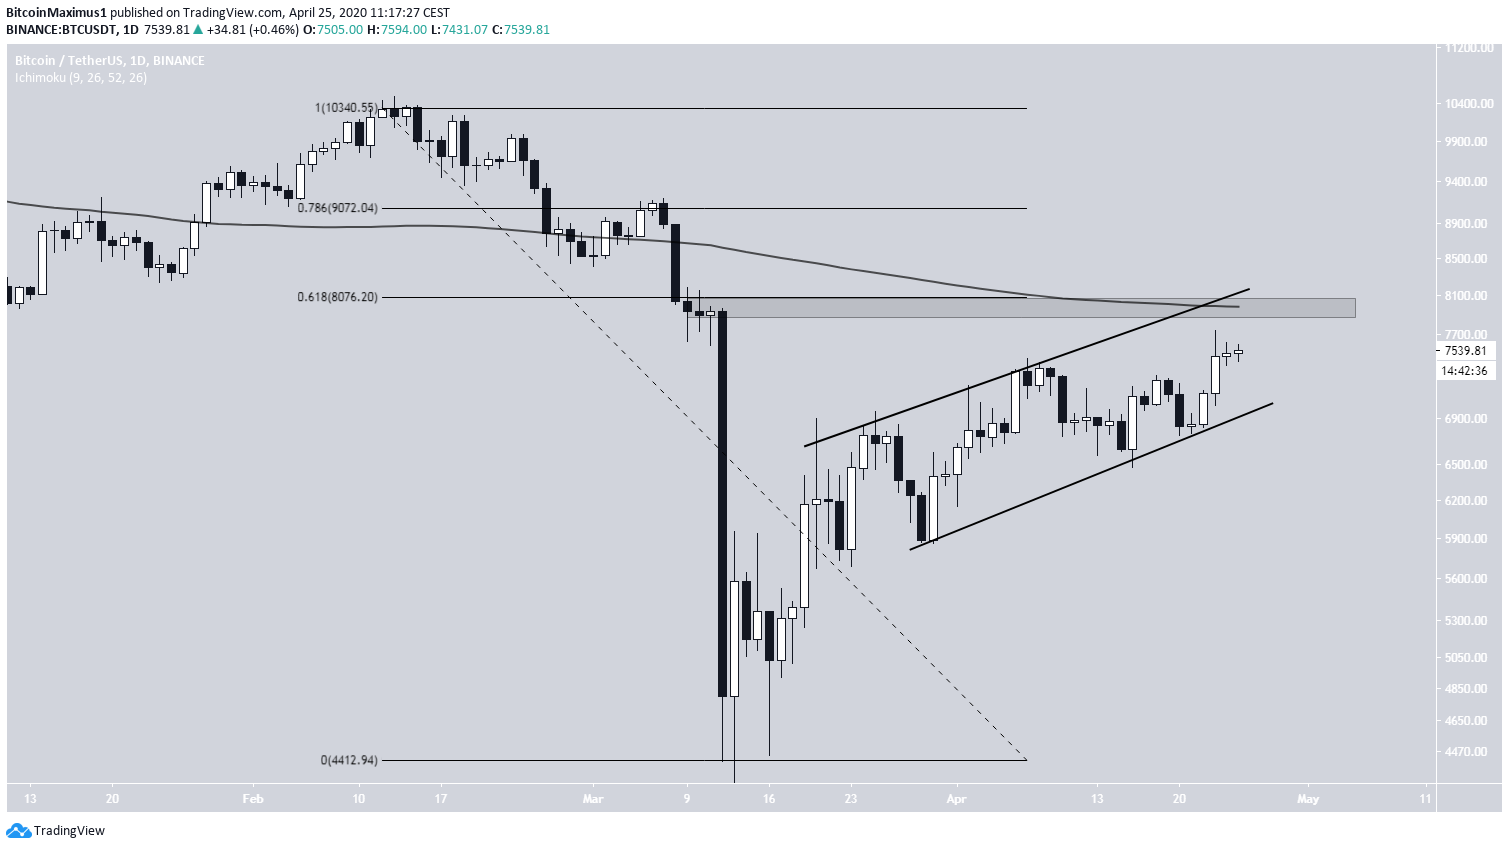
The Bitcoin price has been increasing since March 13. In addition, it has been trading inside an ascending channel since March 20. At the time of writing, it was trading in the middle of this channel.
The most important level is found between $8,000-$8,100. This is a confluence of several important resistances:
- The 0.618 Fibonacci level
- The 200-day moving average (MA)
- The resistance line of the channel
- Minor horizontal resistance
Therefore, as is outlined in the tweet, this could be an interesting level to look for shorts, due to the numerous resistance levels outlined. The next important resistance areas are found at $8,500 (minor) and $9,100.
Short-Term Movement & Conclusion
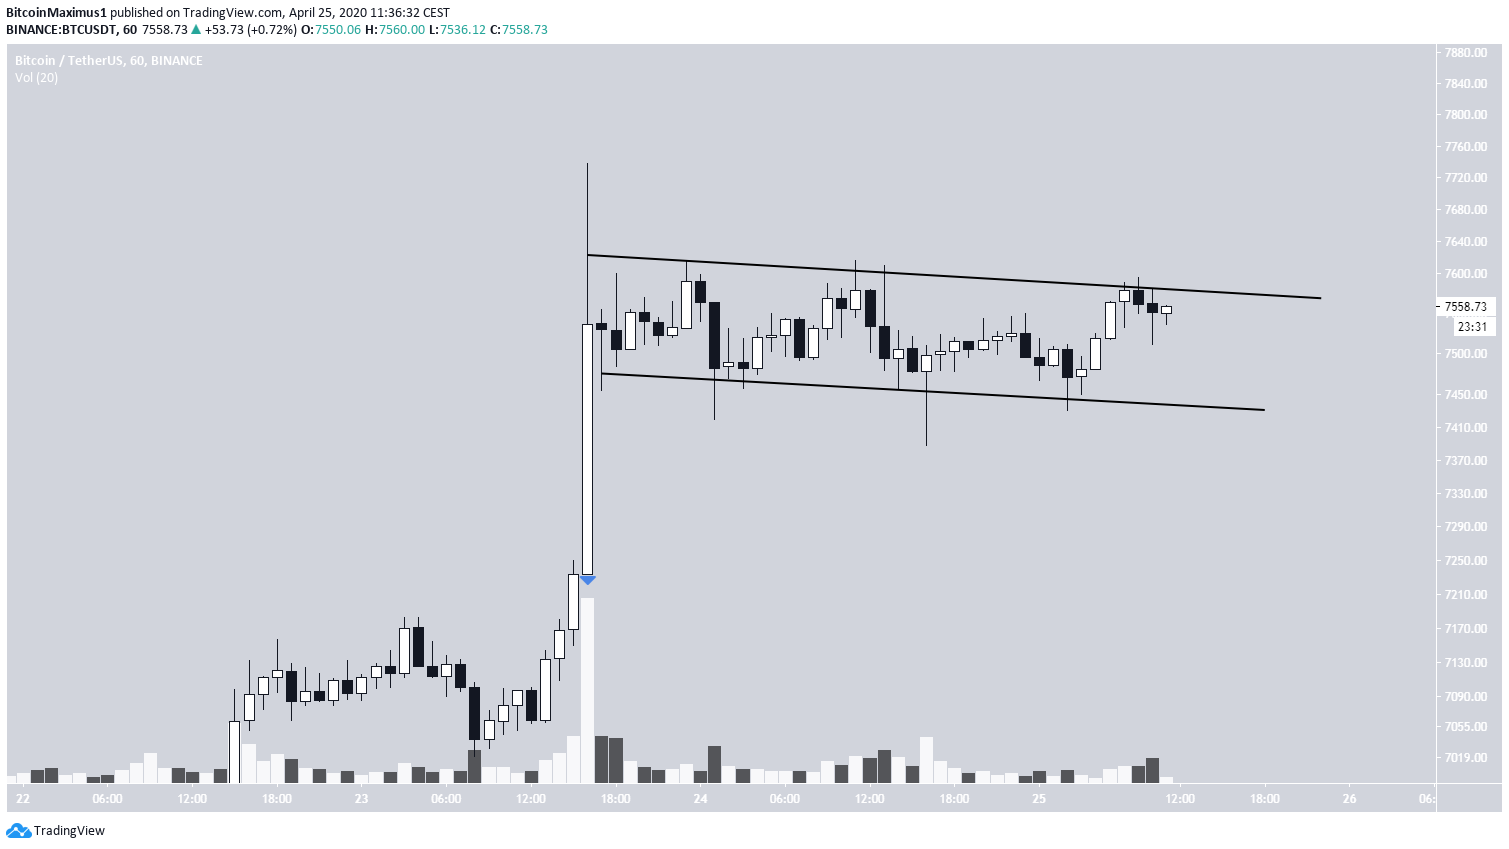
In the short-term, the price is trading inside a descending channel and has been doing so since initiating an upward move on April 23. The move occurred with significant volume, increasing its validity.
The descending channel is considered a neutral pattern, but since it is transpiring after an upward move, it is likely to act as a continuation pattern and cause a breakout. This proposed breakout could be the one that takes the price to the target of $8,000.
To conclude, the BTC price is approaching several important resistance levels. A breakout above would indicate a new bullish trend, instead of being just a retracement in response to the previous downward move. The likeliest level for a reversal is found at $8,000.
