


Dock (DOCK) has been decreasing inside a descending parallel channel since reaching an all-time high on April 3.
While the longer-term outlook indicates that a breakout from this channel is likely, short-term indicators point to a decrease prior to the eventual breakout.
DOCK attempts breakout
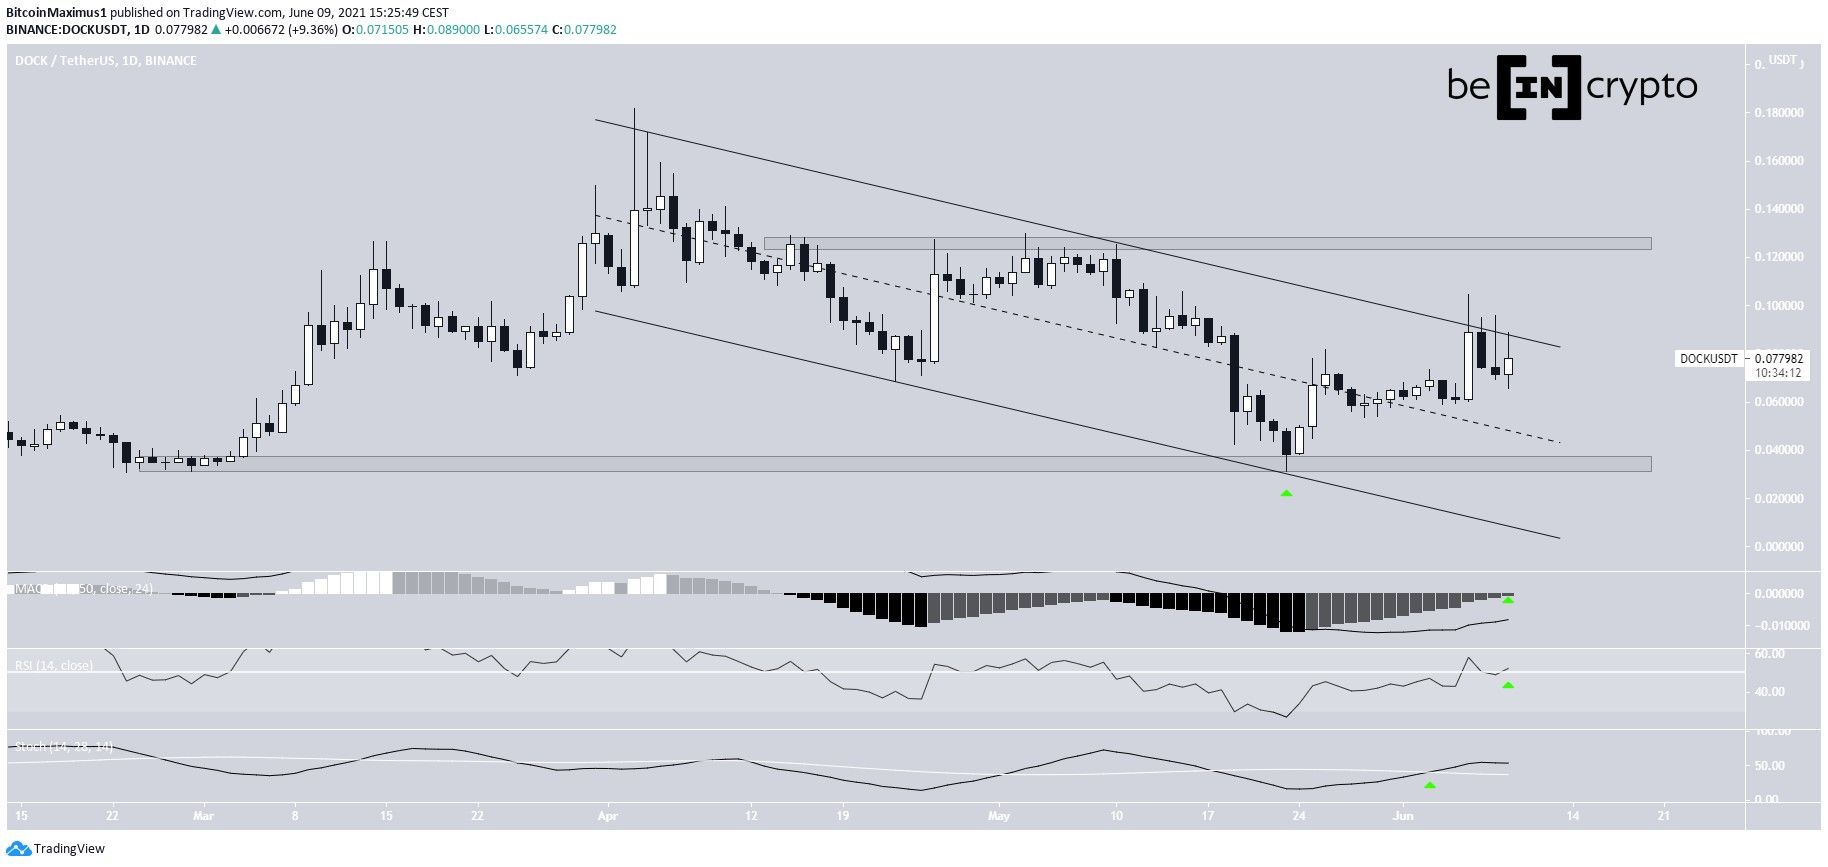
DOCK has been trading inside a descending parallel channel since April 3, when it reached an all-time high price of $0.182. Such channels often contain corrective movements.
On May 23, it bounced at both the support line of the channel and the $0.035 support area (green icon). It has been moving upwards since. The support area represents a level that had previously not been reached since Feb. 2021.
DOCK has been moving upwards since and is currently back at the resistance line of the channel. Furthermore, technical indicators have turned bullish. The RSI has just crossed above 50 and the MACD is close to moving into positive territory. In addition, the Stochastic oscillator has just made a bullish cross (green icons).
If a breakout occurs, the next resistance area would be at $0.126.
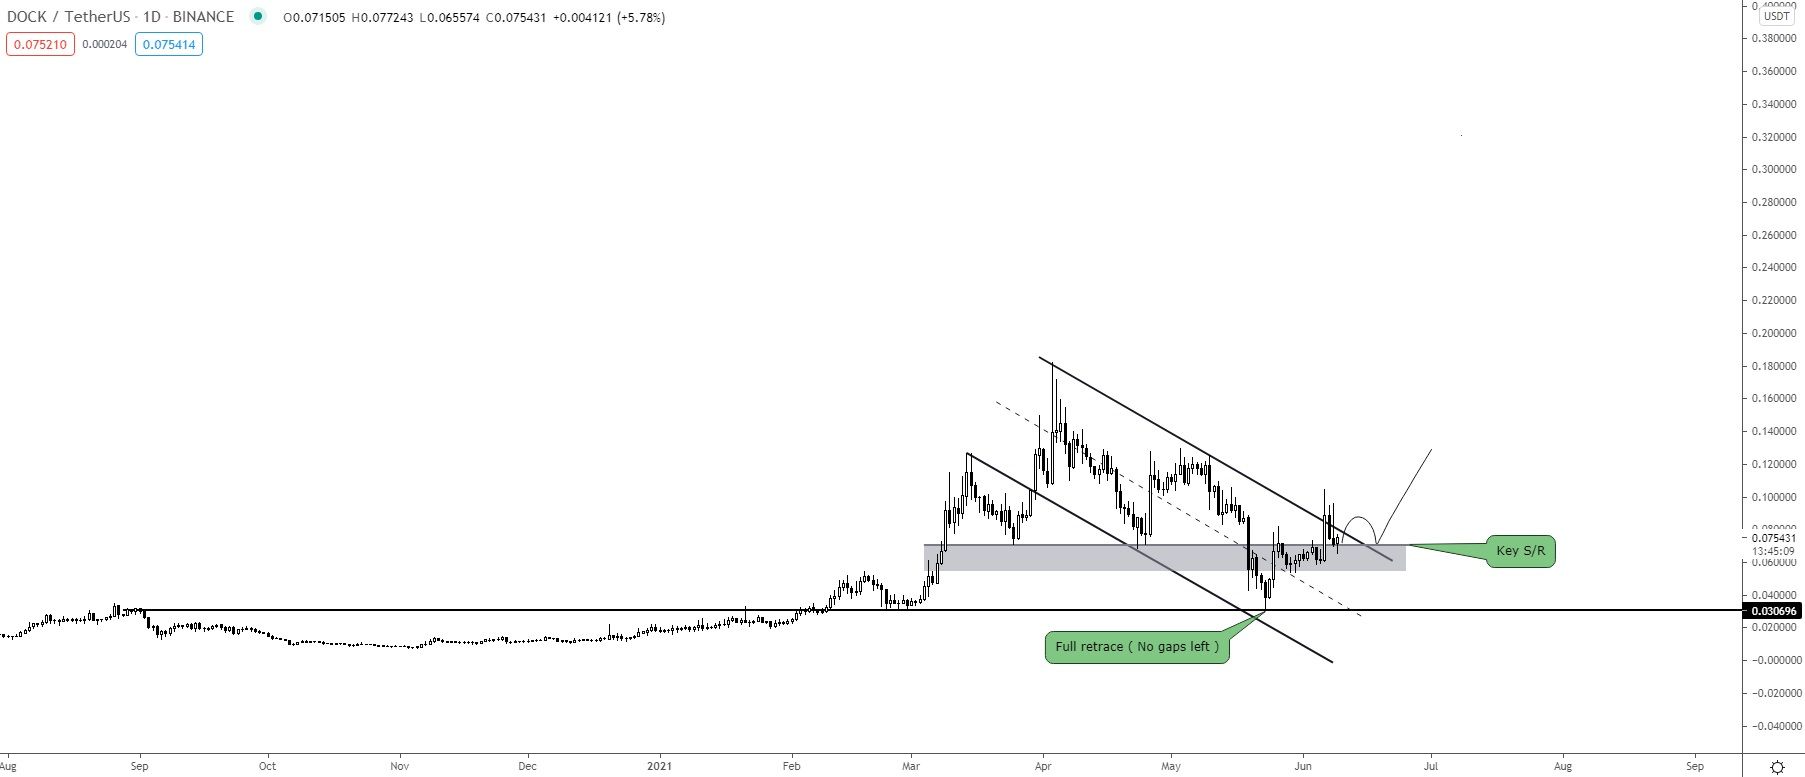
Cryptocurrency trader @TheEuroSniper outlined a DOCK chart, stating that he is looking for a flip above the resistance line of the channel in order to enter new positions. As seen above, the token is currently in the process of attempting to break out.
Short-term breakout
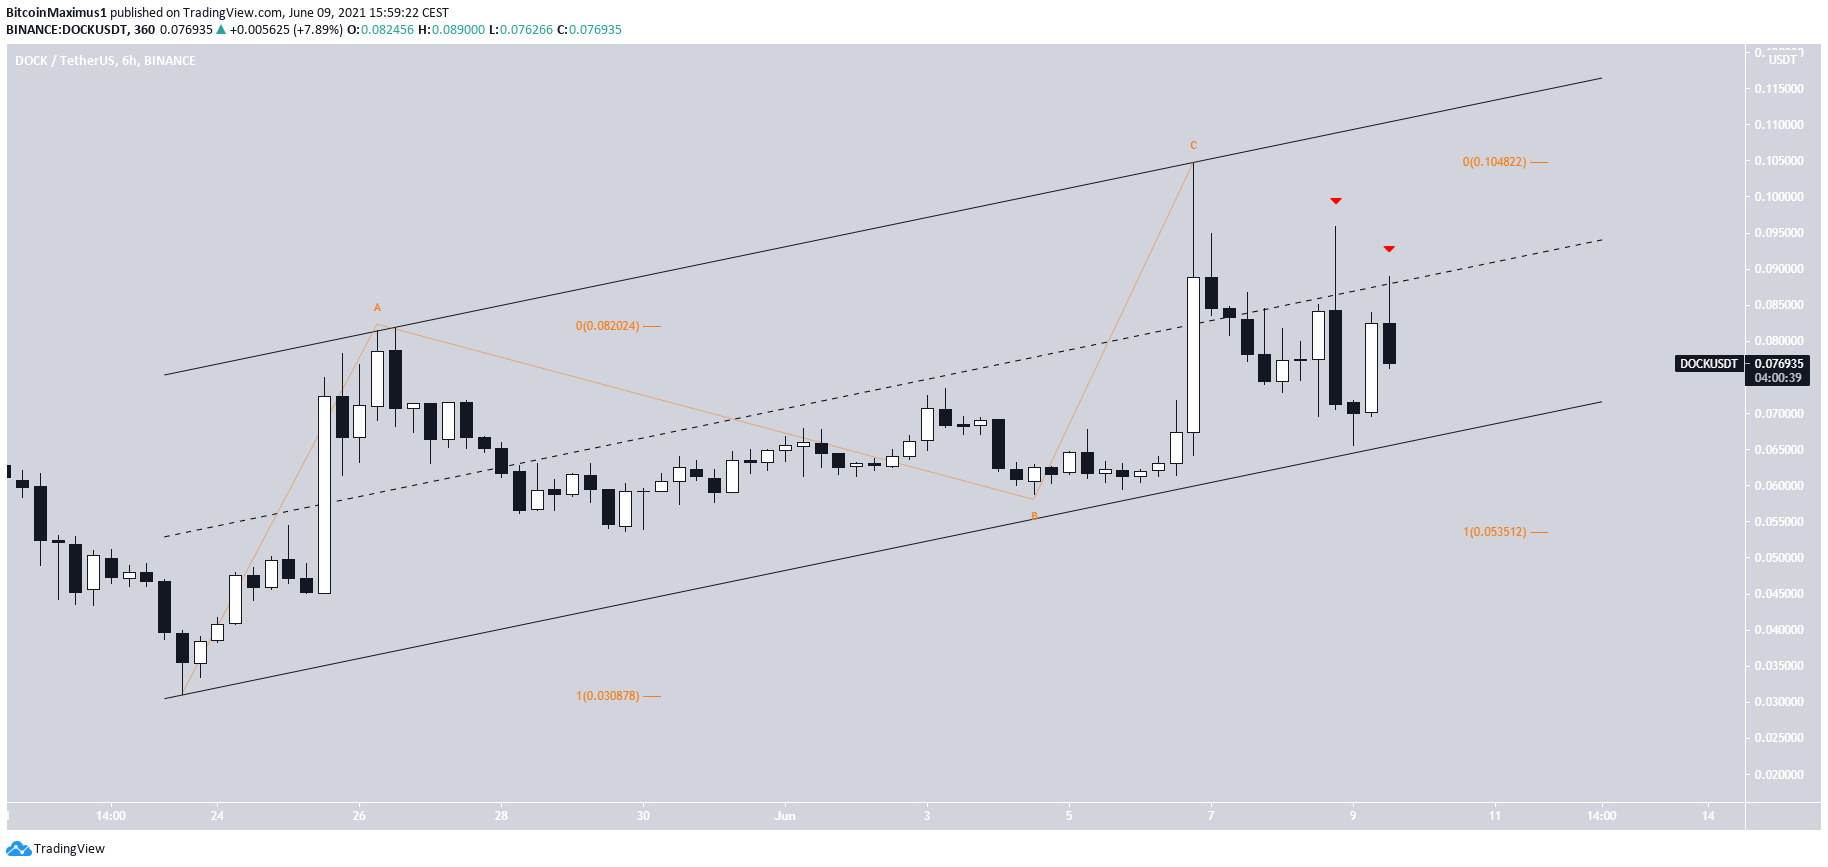
Despite the bullishness from the daily time-frame, the shorter-term six-hour chart provides numerous bearish signs.
The ongoing bounce looks like an A-B-C corrective structure, which has significant overlap and is contained inside an ascending parallel channel. In addition, waves A:C have an exactly 1:1 ratio.
In addition to this, the middle of the channel has now turned to resistance, twice rejecting the token (red icons).
Therefore, a breakout from the channel could occur, which could take DOCK back to the long-term support area before a potential breakout.
DOCK/BTC
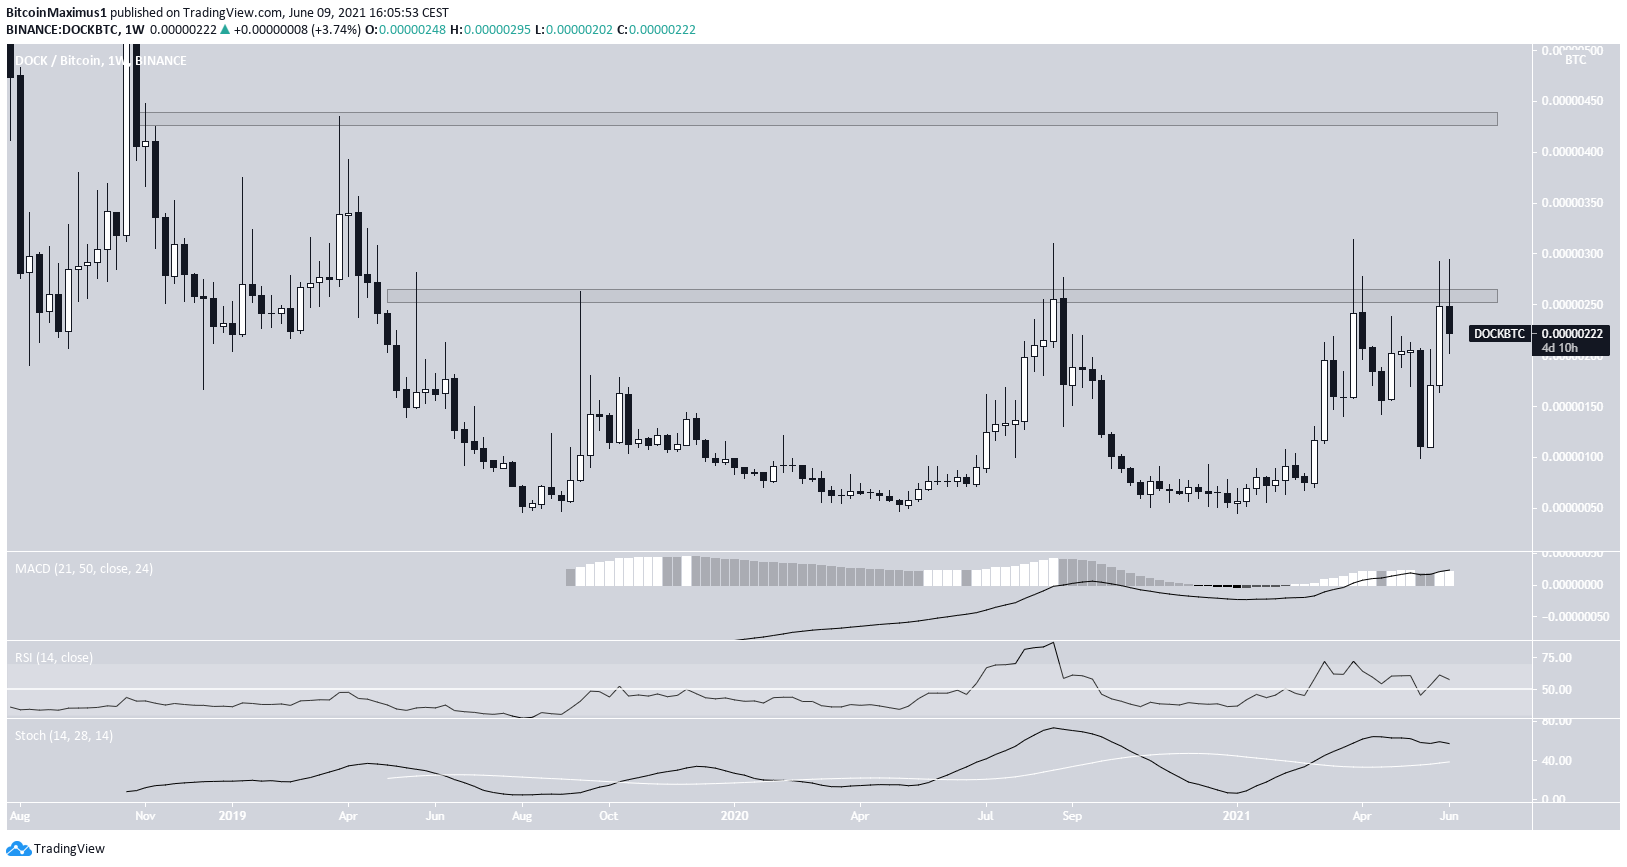
The DOCK/BTC chart looks more bullish than its USD counterpart. The token has been trading below the 260 satoshi resistance level since April 2019. So far, it had made four unsuccessful breakout attempts and is in the process of making the fifth one.
Technical indicators are bullish. The MACD & RSI are increasing, the latter being above 50. Furthermore, the Stochastic oscillator has made a bullish cross.
Therefore, an eventual breakout is likely. If so, the next resistance area would be found at 435 satoshis.
For BeInCrypto’s latest bitcoin (BTC) analysis, click here.


