
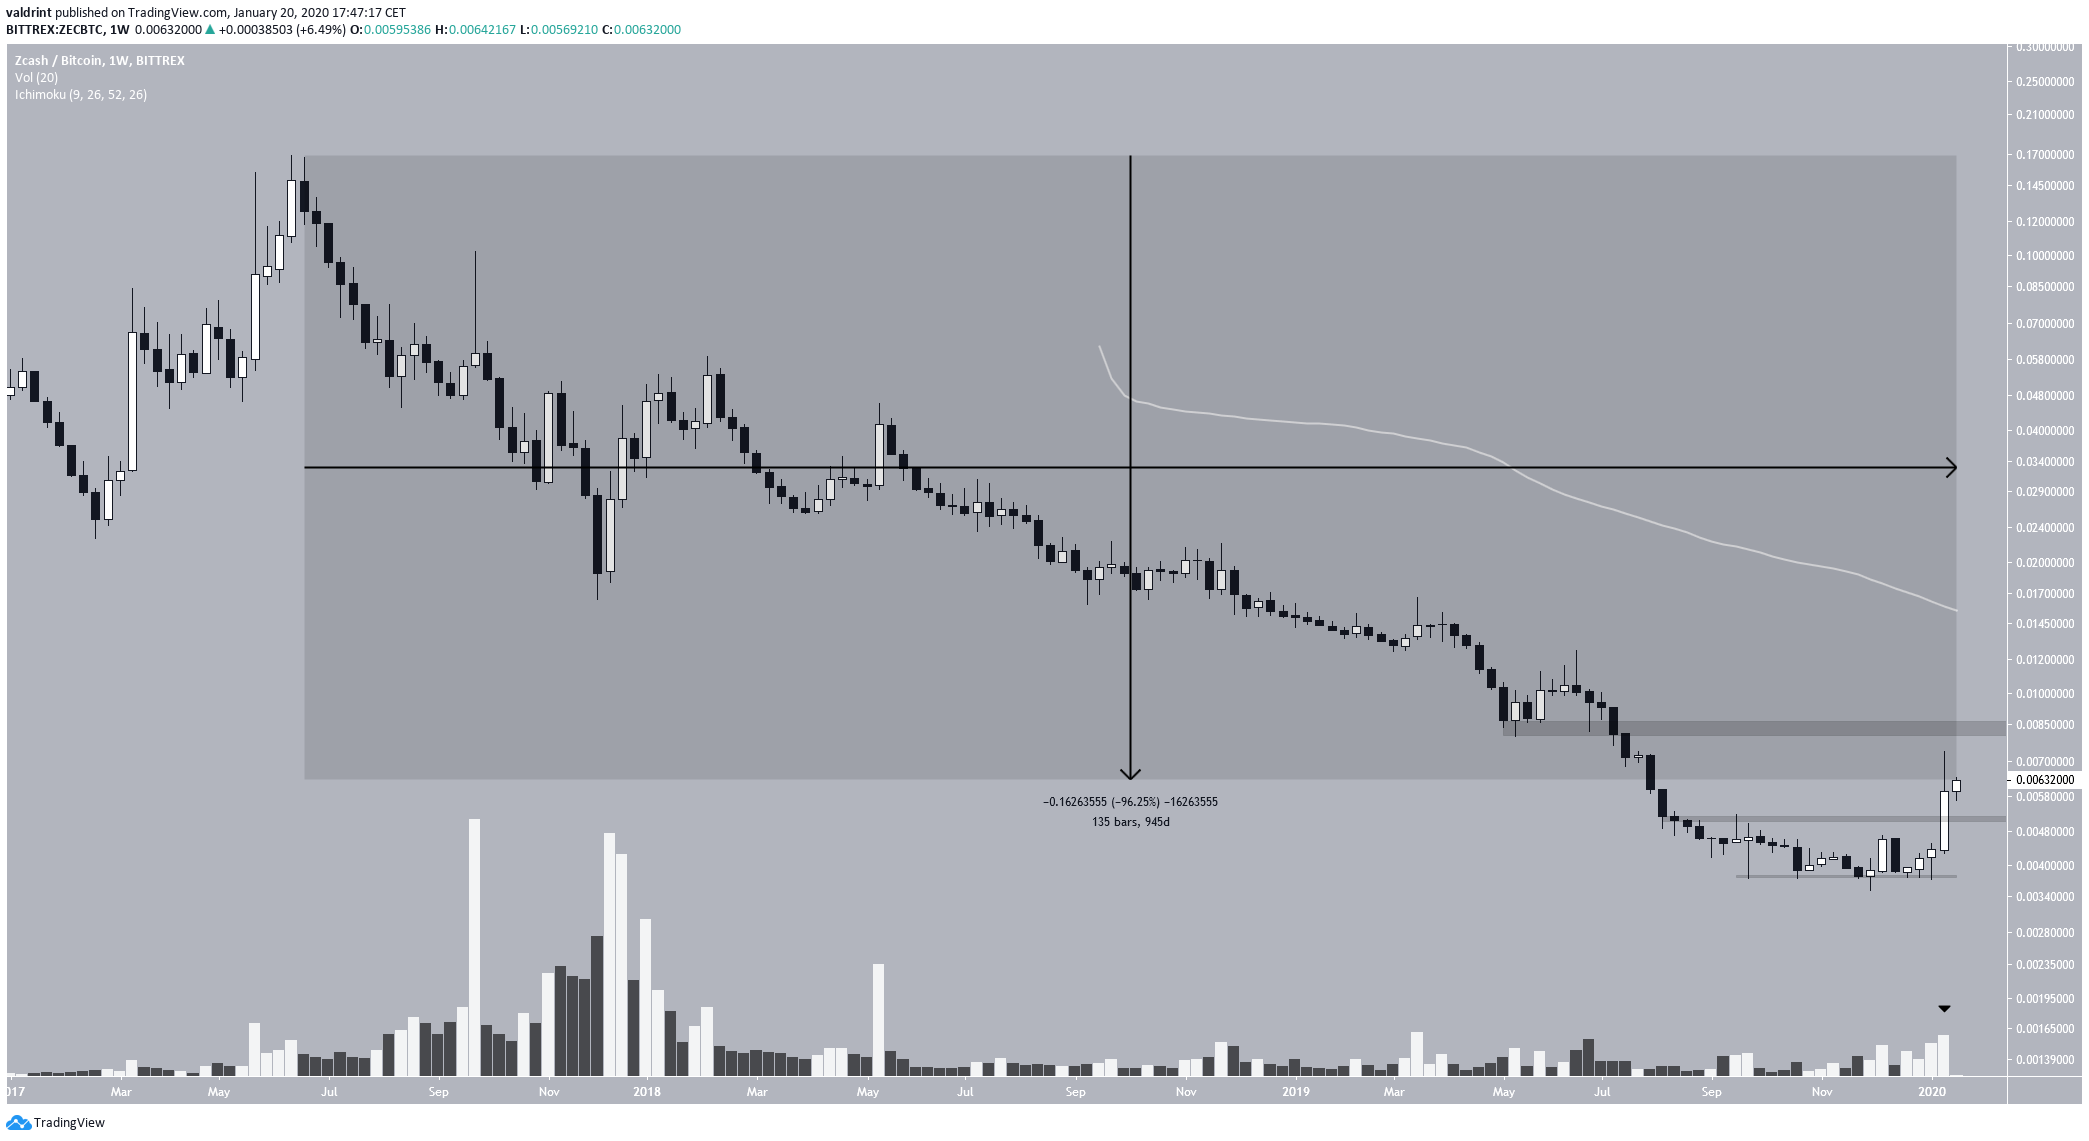
The Zcash price has decreased by more than 98 percent over the current downtrend trend that has lasted for 945 days.
However, over the past 10 days, it has increased by 65 percent, causing some to believe that it has broken out above its nearly three year downtrend. Until it breaks out above ₿0.0085, we cannot confidently state that it has done so.
However, its price movement has shown a lot of strength. @CryptoNTez outlined the ZEC price chart, noting that it has increased by more than 65 percent in the past 10 days. The price is currently testing the ₿0.007 resistance, and if successful he gave a target of ₿0.008.
Over 65% run up in less than 10 days…
UCTS Buy signal on the 2D signalling the start of the rally
Now testing again the ~.007 sats resistance level with volume retracing…If crossed, then ~.008 as 1st target
Updating your SL to latest HL just in case it retraces#ZEC pic.twitter.com/PsKzjjdvGR— Nico (@CryptoNTez) January 18, 2020
Will ZEC be successful in reaching the target? Continue reading below if you are interested in finding out.
Zcash Consolidation
In a 175 day period from August 2019 to January 2020, the ZEC price consolidated between ₿0.0051 and ₿0.0038 satoshis. The price broke out with considerable volume on January 14 and reached a high of ₿0.0073, before decreasing slightly.
The entire consolidation period was combined with very strong bullish divergence in the RSI — a bullish sign prior to a breakout.

However, the price did not return to validate the previous breakout level as support. In addition, it created a bearish engulfing candlestick on January 18, which closed slightly below the opening of the prior bullish candle.
A retrace to the breakout level would be customary and several altcoins have performed this type of movement.

The short-term outlook supports this scenario. The ZEC price has possibly created a head and shoulders, which is combined with decreasing volume and bearish divergence in the RSI.
A breakdown from this pattern would take the price right to the ₿0.0051 support area.

Breakout or Not?
We need to take into account just how long and crushing this downtrend has been. The price has been in a downtrend for 945 days and has decreased by a massive 96.25 percent. In addition, the current weekly volume pales to those reached in December 2018 or even May 2019.
We are not ready to call this a reversal as of yet, at least not until the price flips the previous breakdown level and the 100-week MA which are at ₿0.0085 and ₿0.0150.
To conclude, the ZEC price has broken out above a significant resistance level. However, we are not yet ready to say that it is in an upward trend since it has failed to flip the previous breakdown level.
Finally, the short-term outlook is bearish.
