


The XLM price has been rapidly decreasing since Feb. 16. However, it reached a low of $0.024 on March 14, which caused a quick upward bounce. The price has been increasing ever since.
Stellar (XLM) Price Highlights
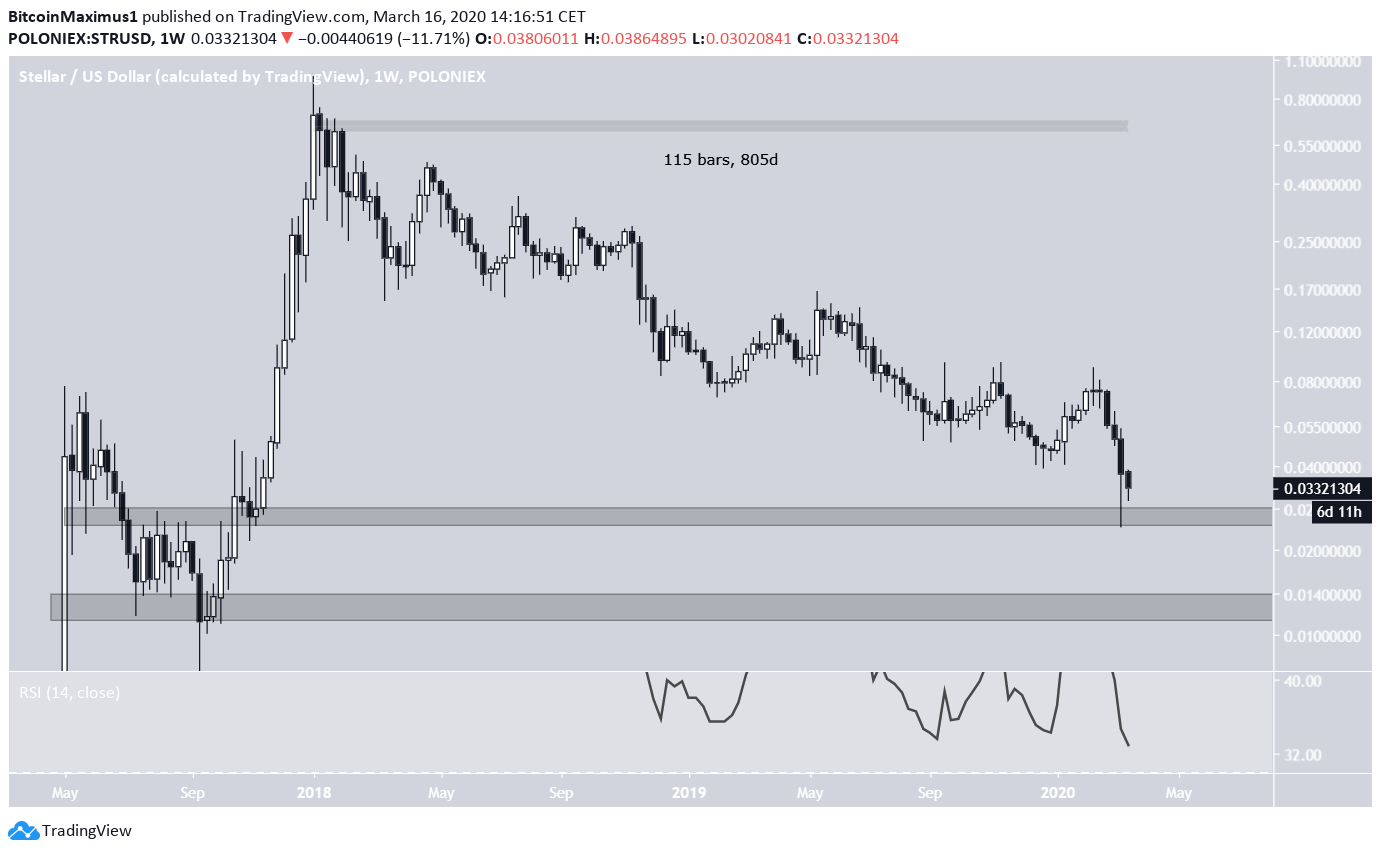
- There is support at $2.5 and $1.
- The weekly RSI is at its lowest level.
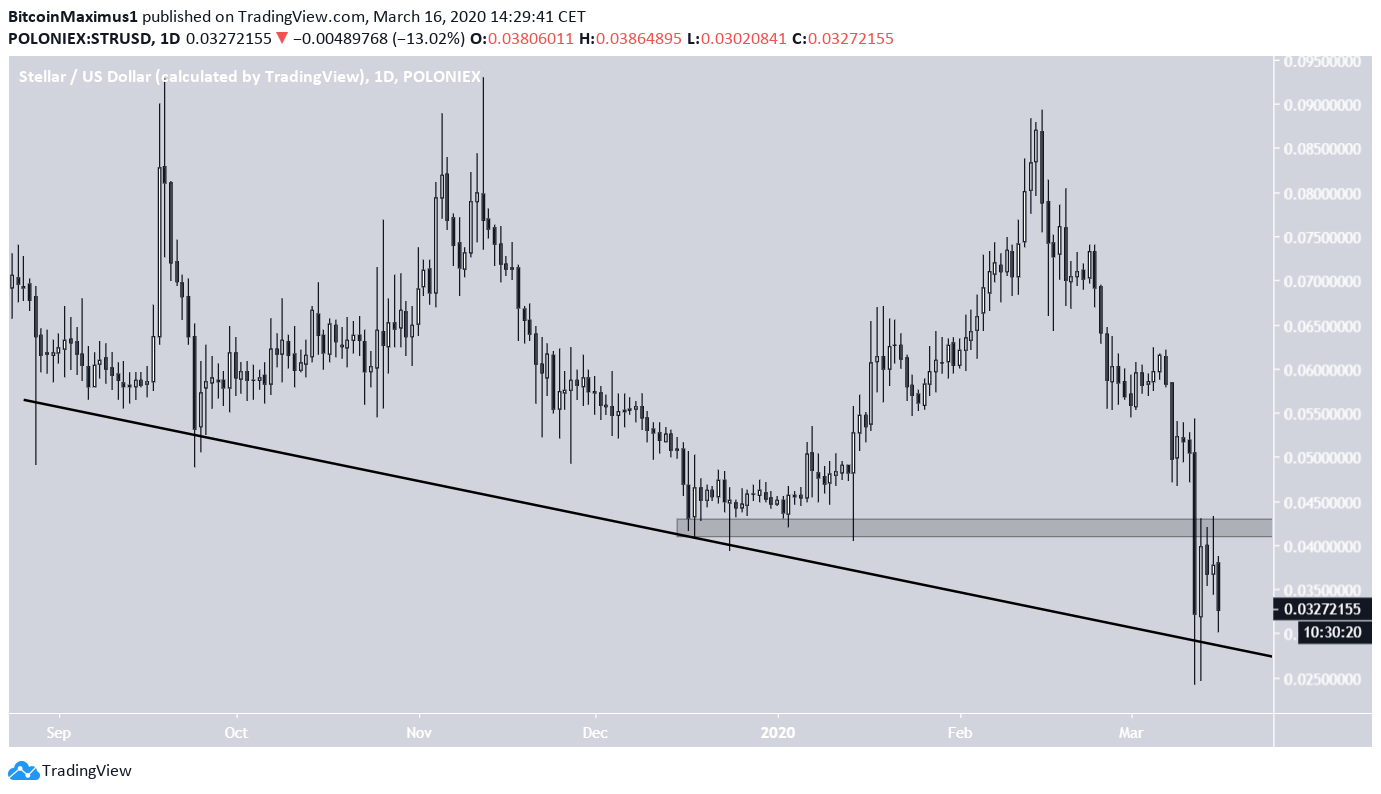
- There is resistance at $0.042.
- The price is following a descending support line.
Cryptocurrency trader @Mesawine1 outlined an XLM chart, stating that while the wave count for XLM suggests that the price has reached a bottom, the main support area at $1 is still considerably below the current price level.
$xlm update:
There's something fishy with #xlm. The count suggests a bottom is near, but PA is way off it's prime buy zone.
Now, nothing says that this level must be reached, but with everything going on in the world the 0,5 fib just doesn't seem enough to me.
hmmm 🤔#crypto pic.twitter.com/NxPpYdQ7lK
— Cryptotoad (@Mesawine1) March 15, 2020
Will the XLM price decrease all the way to the target, or has it already reached a bottom? Continue reading below if you want to know the answer.
Possible Bottom
The XLM price has been on a downward trend for the past 805 days, more specifically since reaching a high of $0.98 in January 2018.
The main support areas are found at $2.5 and $1.2. In addition, while the weekly RSI is not oversold, it is at the lowest level ever recorded, making an eventual reversal likely.
It is possible that the support line combined with the support area outlined in the previous section will initiate a reversal. This scenario is especially likely if the price successfully completes a double bottom, which is considered a bullish reversal pattern.
However, the price has to initially to flip the $0.042 resistance level and turn it into support in order to move upward.
Until it does, we are considering the current upward move as a retracement rather than a reversal.
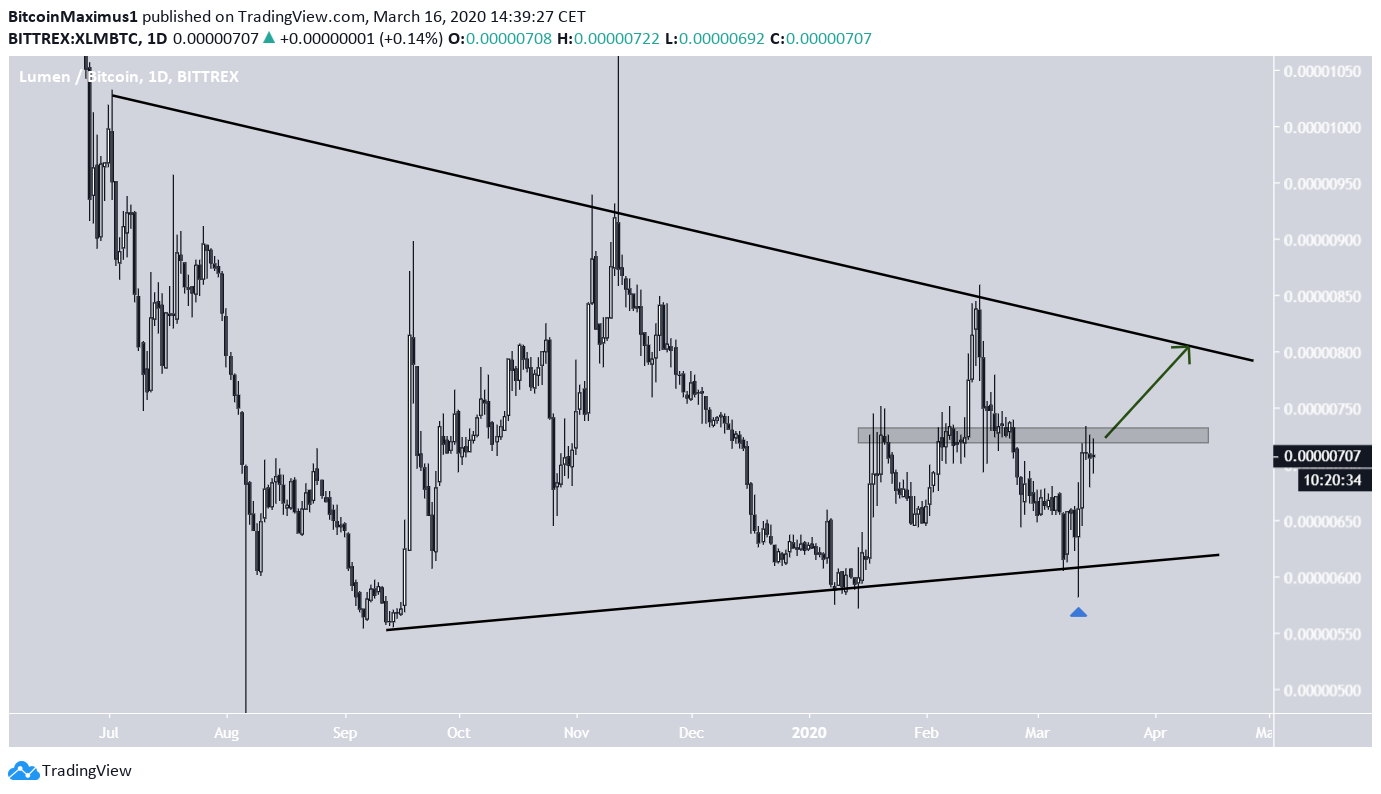
XLM/BTC
The XLM/BTC price has been trading inside a symmetrical triangle since July 2019. Surprisingly, the price has shown some strength during the recent BTC price decrease, having bounced on March 11.
If the price is able to successfully stay above the 720 satoshi resistance area, it is likely to move toward the resistance line of the triangle.
To conclude, the XLM price has reached a significant support area and created a long lower wick once it got there. Until it successfully flips the $0.042 level as support, we cannot confidently state that the price has reversed its trend.


