
The DIA (DIA) price has been struggling to move above the $1.85 resistance area since it first broke down at the beginning of September.
The price action and technical indicators suggest that DIA will reach this area once again and could potentially break out after.
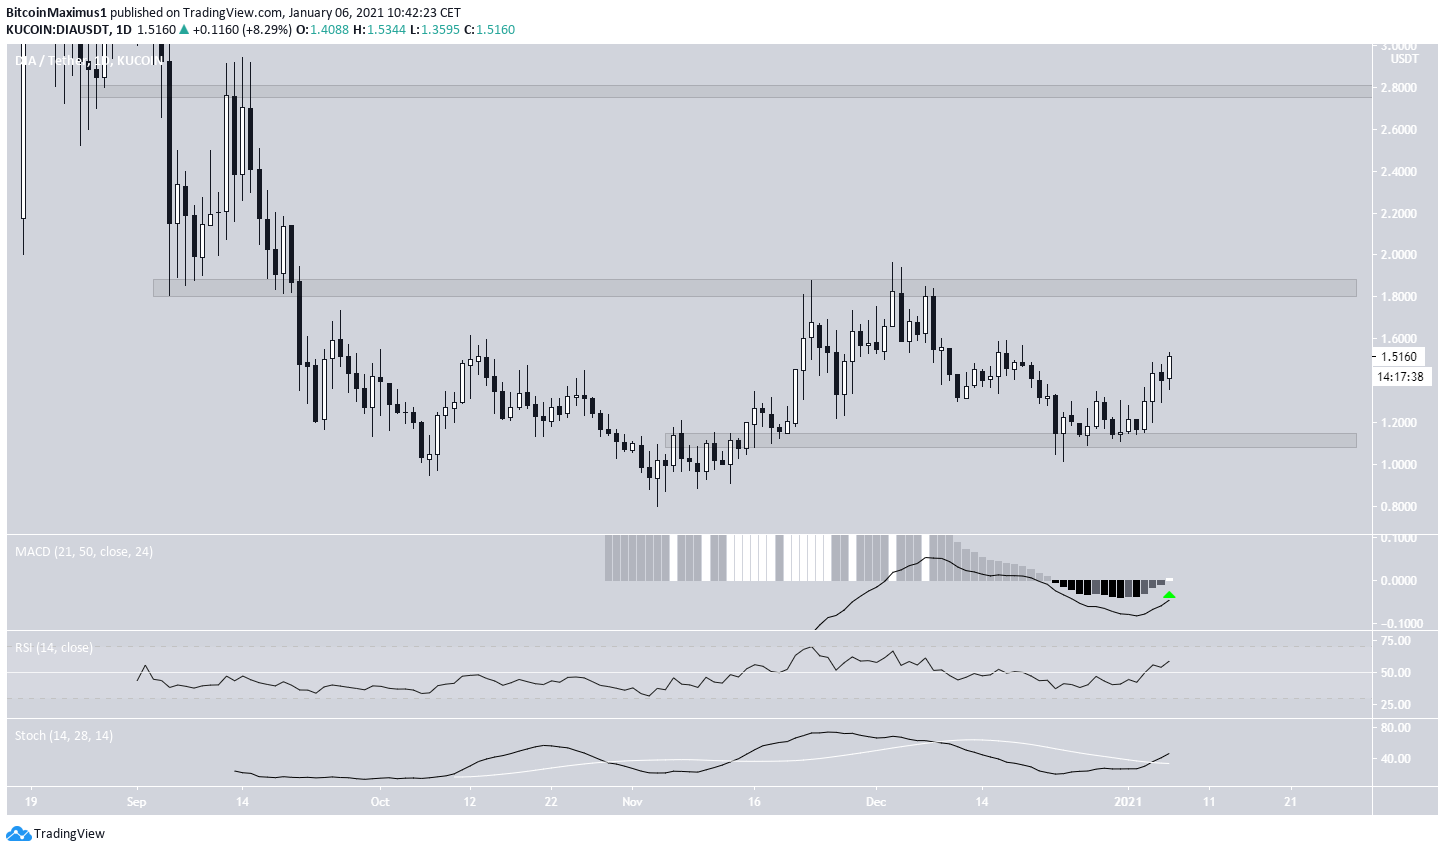
DIA Trading Range
DIA is currently trading in a range between $1.10 and $1.85. While it has been trading below the resistance area since it initially broke down in September, the support area has been in place since DIA validated it on Dec. 21.
Technical indicators in the daily time-frame are bullish, supporting the possibility that DIA will increase towards $1.85.
If DIA were to break out, the next closest resistance area would be found at $2.80.
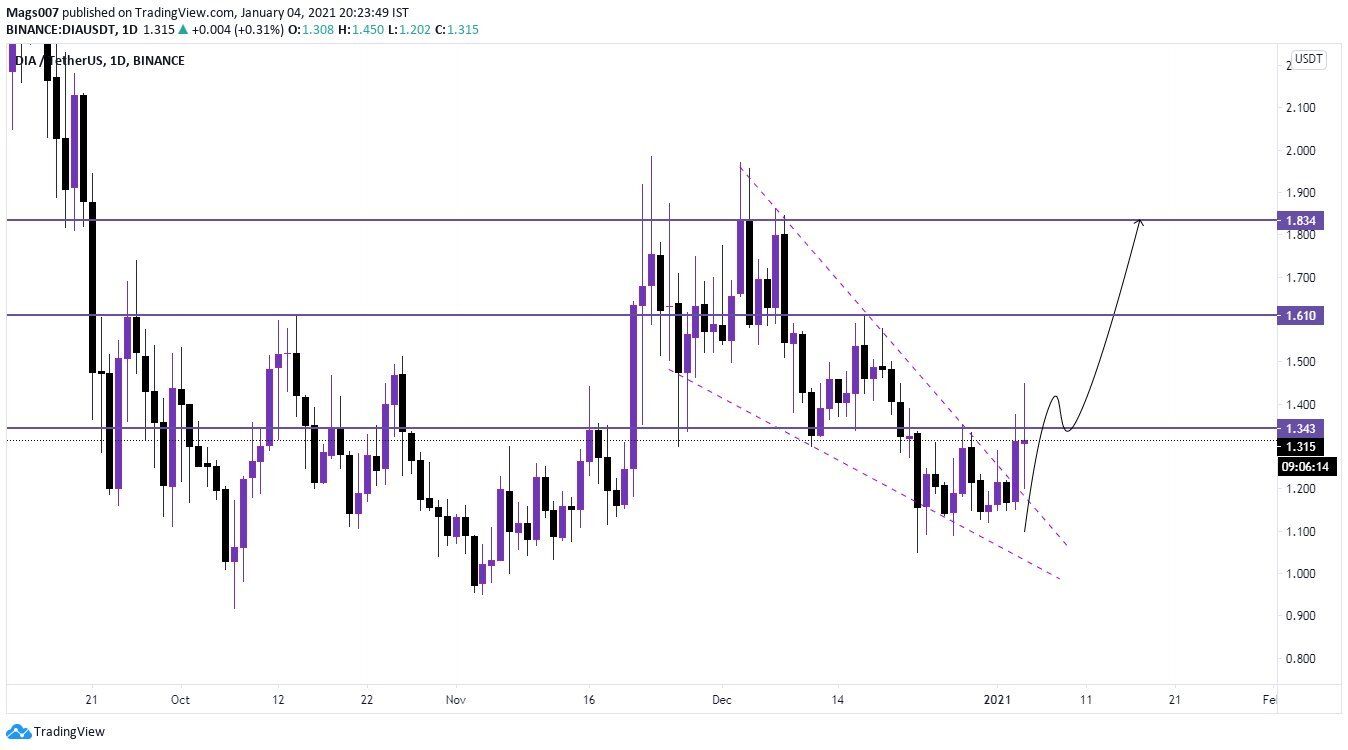
Cryptocurrency trader @Binancescalping tweeted a DIA chart that shows a possible breakout from a descending wedge. They commented that it looks bullish and suggested that an upward move toward $1.85 is likely.
This fits with our analysis and would take the price right to the resistance area of the range.
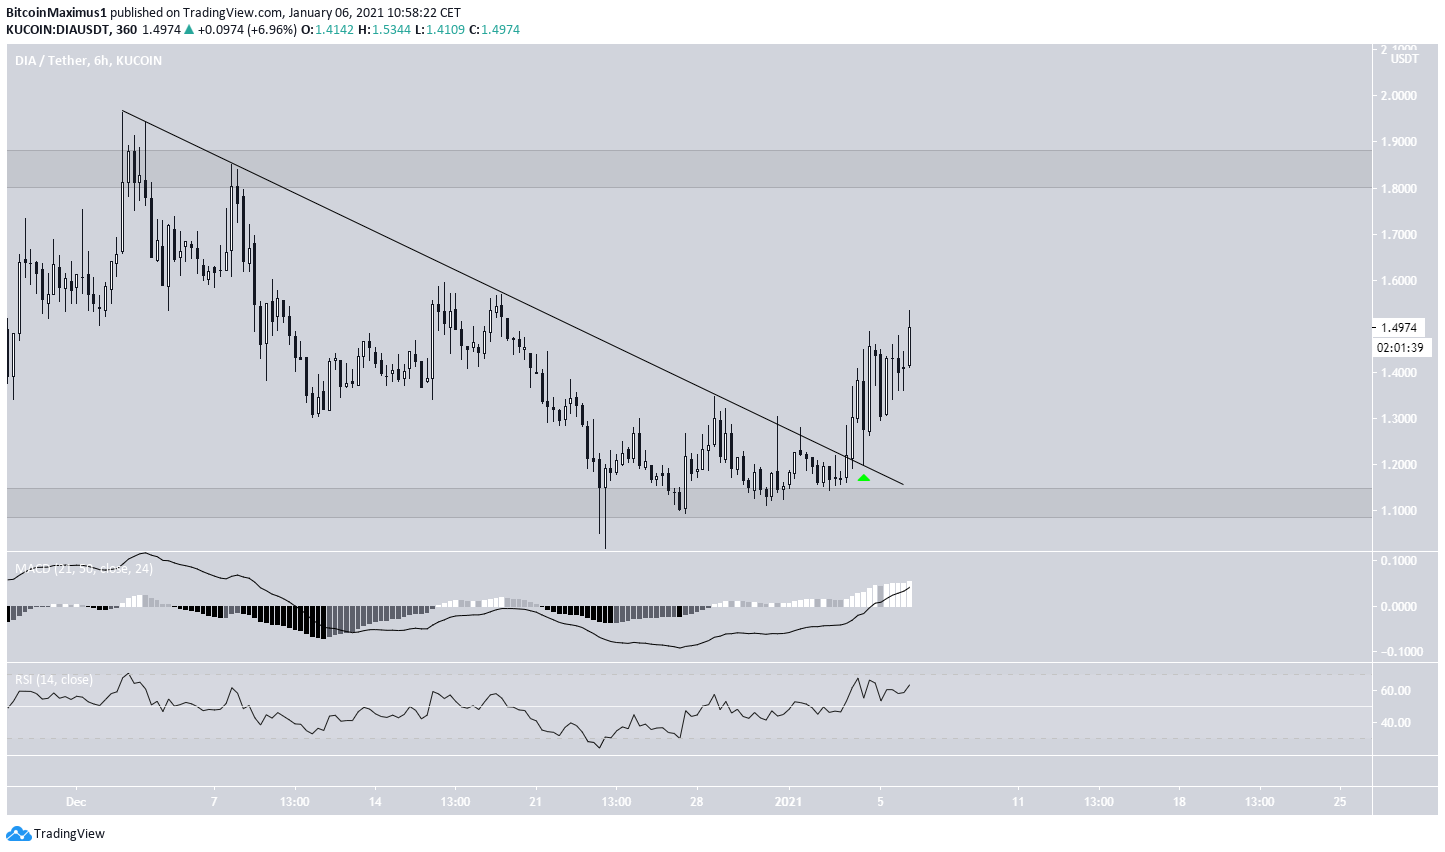
Short-Term Movement
A closer look at the six-hour chart shows that DIA has already broken out from a descending resistance line and validated it as support after (shown with the green arrow below).
Technical indicators are similarly bullish, indicating that an upward move toward the $1.85 area and a potential breakout are likely.
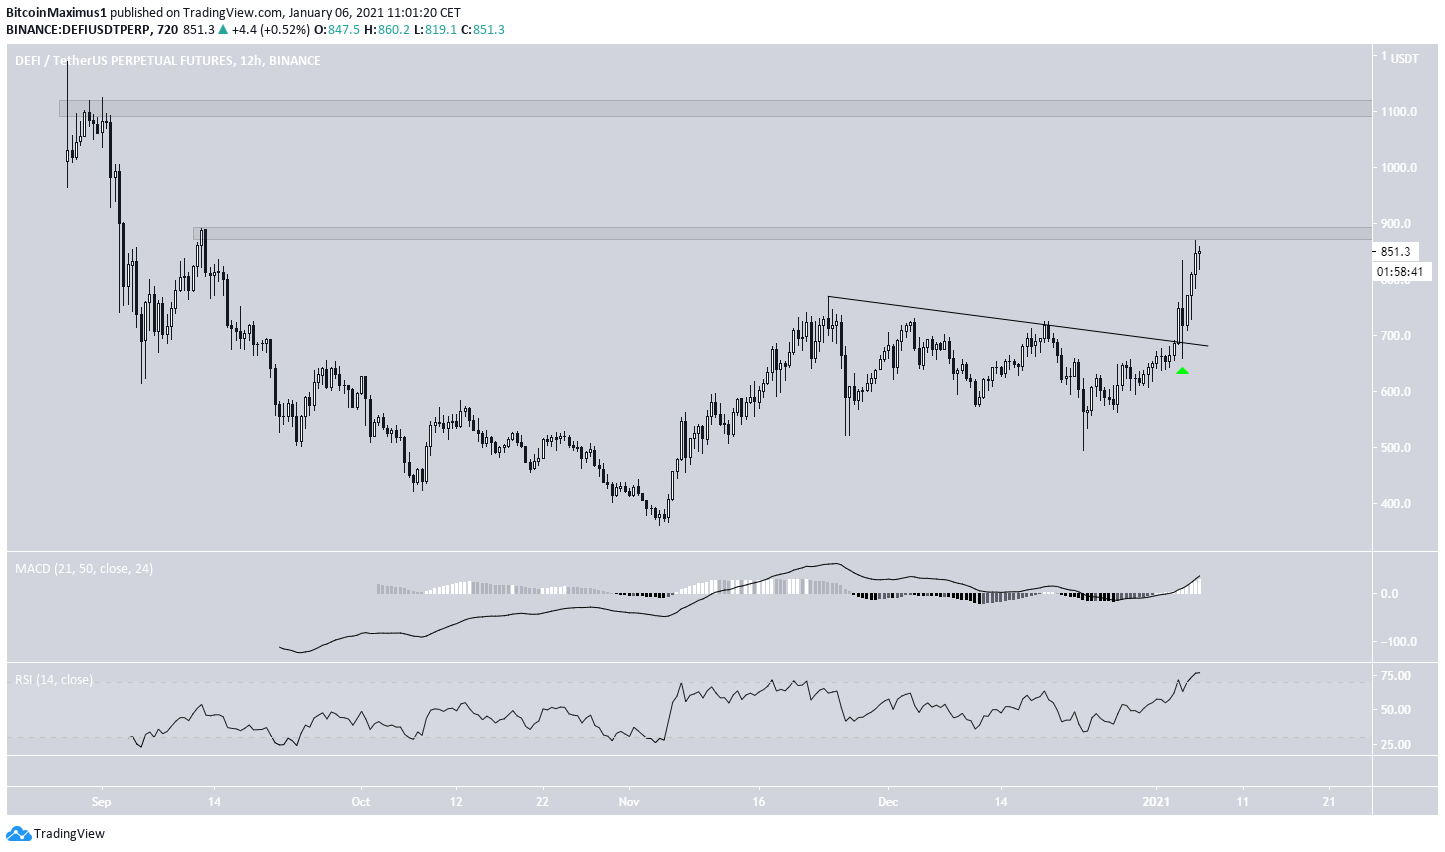
DeFi Index
The DeFi Perpetual Futures Index (DEFIPERP) has been increasing since breaking out from a descending resistance line and validating it as support on Jan. 4.
Currently, DEFIPERP is approaching the $870 resistance area, with the next being the all-time high resistance of $1,100.
Technical indicators are bullish, backing up its prospects of continuation toward the resistance areas.
Conclusion
DIA is expected to gradually increase towards the $1.85 area and possibly break out. If it is able to do so, it will likely accelerate.
Similarly, DEFIPERP is expected to increase towards the resistance areas at $870 and $1,100.
For BeInCrypto’s latest Bitcoin (BTC) analysis, click here!
Disclaimer: Cryptocurrency trading carries a high level of risk and may not be suitable for all investors. The views expressed in this article do not reflect those of BeInCrypto.
