


DIA (DIA) has been moving upwards since June 22 and broke out from a descending resistance line on July 7.
Technical indicators support the continuation of the upward movement towards the closest resistance area.
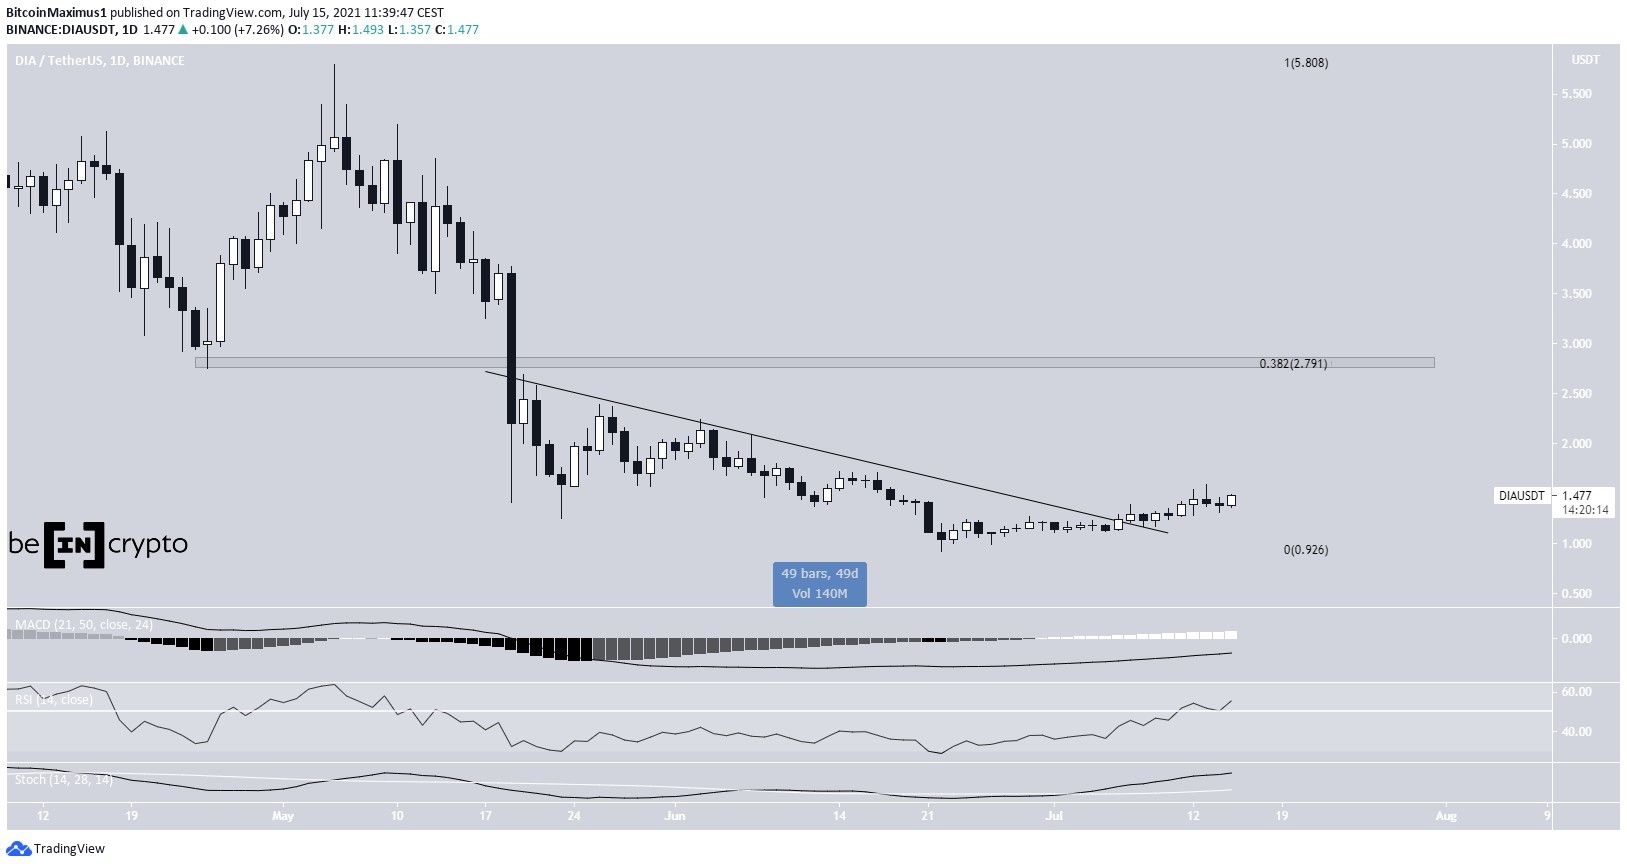
DIA breaks out
DIA has been increasing since reaching a low of $0.921 on June 22. On July 7, it managed to break out from a descending resistance line that had been in place for 49 days.
The token has been moving upwards since.
Technical indicators are bullish, supporting the continuation of the upward movement. The RSI is above 50, the Stochastic oscillator has made a bullish cross and the MACD is nearly positive.
The closest resistance is at $2.79. This is both a horizontal resistance area and the 0.382 Fib retracement resistance level.
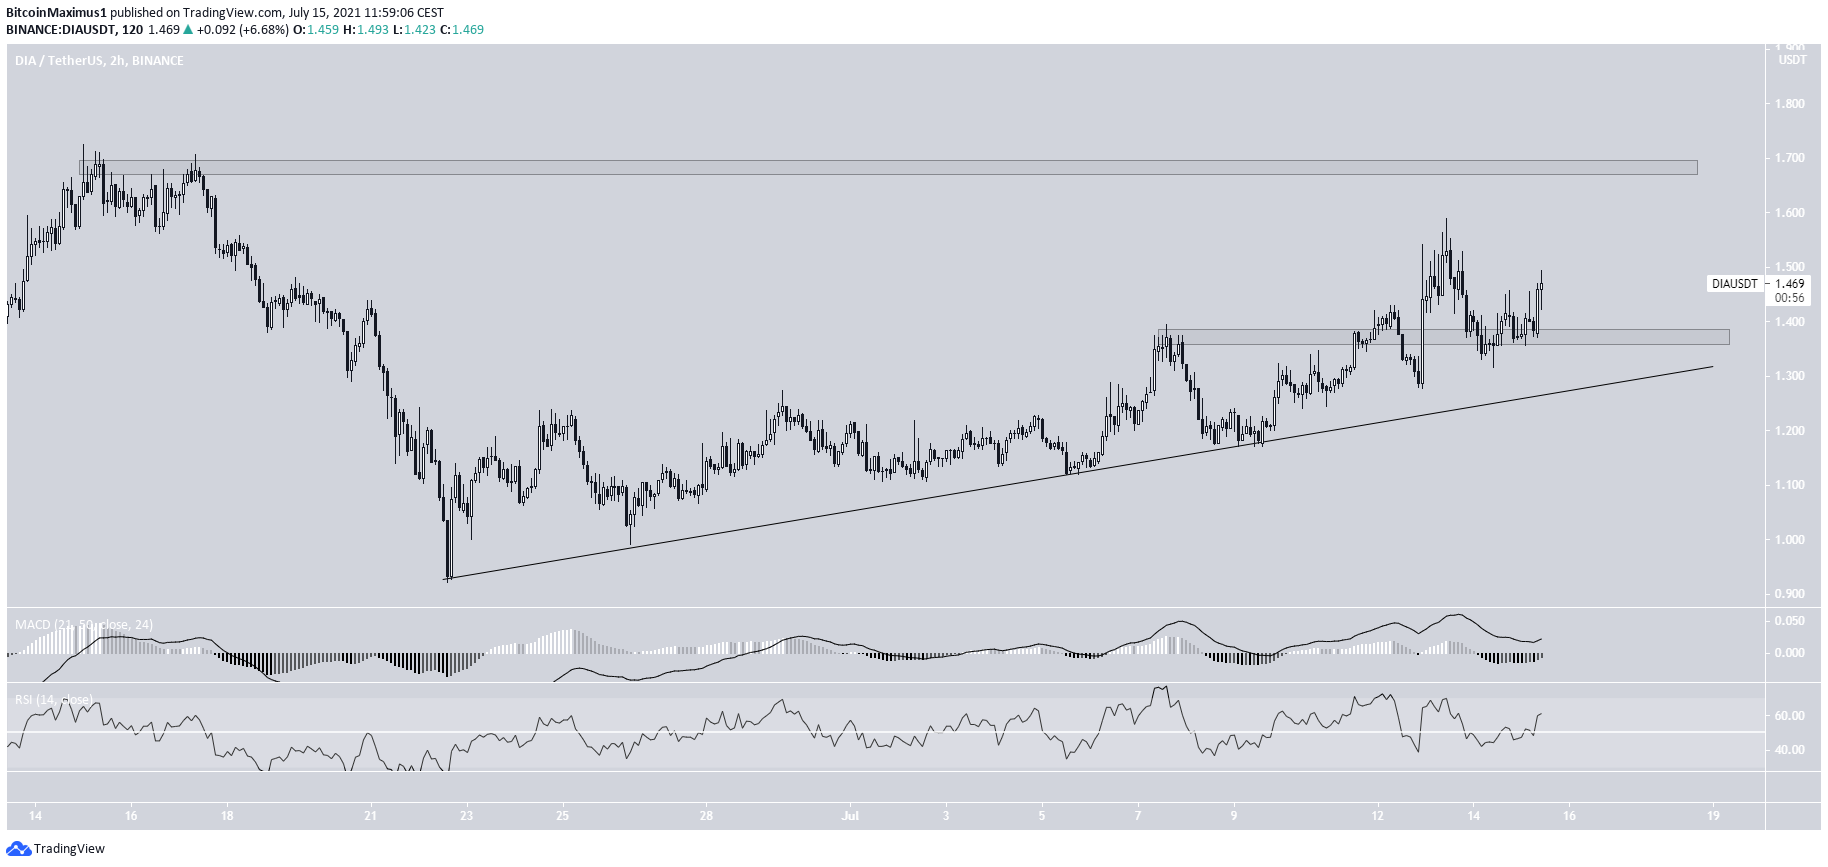
Short-term movement
In the short-term, DIA has been following an ascending support line since the aforementioned low on June 22. Most recently, it bounced at the line on July 9.
The bounced caused a reclaim of the $1.37 area and its subsequent validation as support. The next closest resistance is at $1.68. If it manages to clear it, the token would be expected to move towards the previously outlined resistance at $2.79.
Similarly to the daily time-frame, the two-hour MACD & RSI are both bullish.
DIA/BTC
Cryptocurrency trader @CryptoMichNL outlined a DIA/BTC chart stating that a flip of the current resistance area will likely lead to prices near 4800-5000 satoshis.
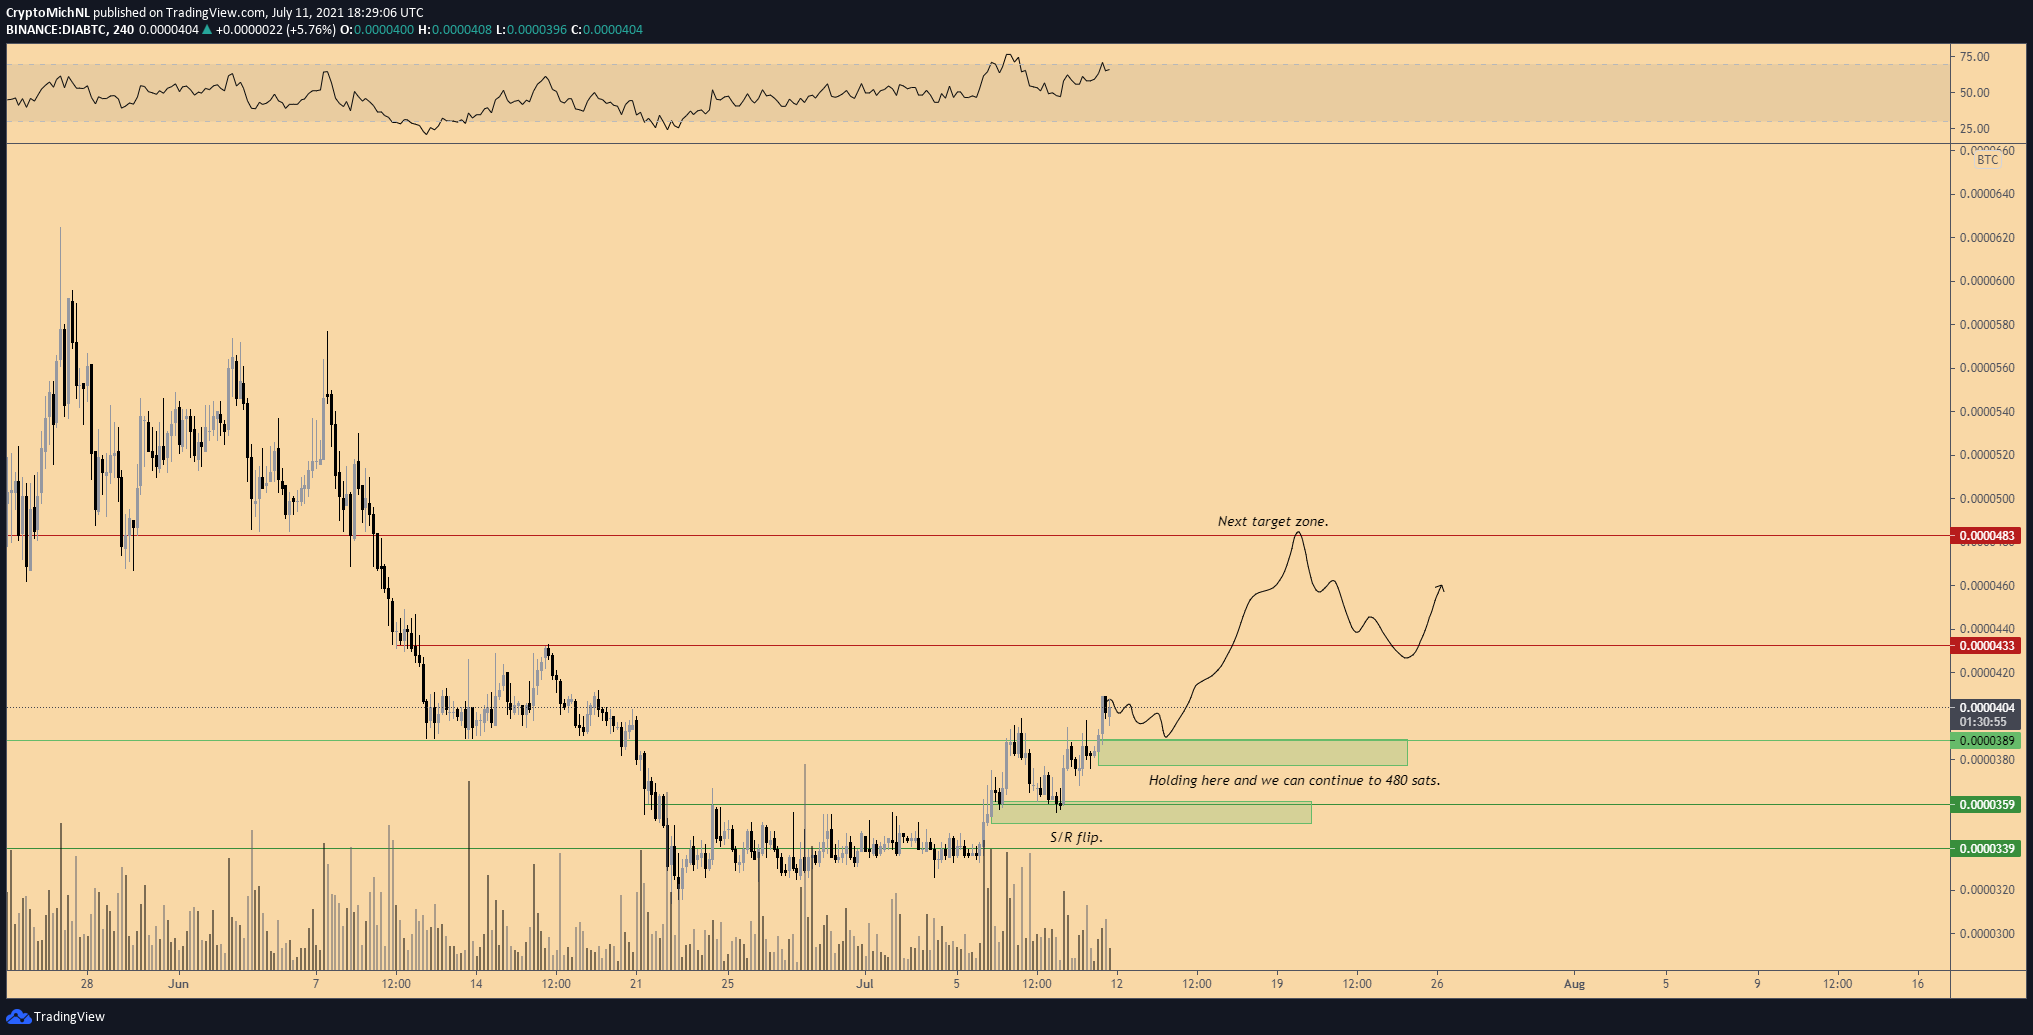
Similarly to the USD pair, the DIA/BTC pair has been increasing since reaching a low on June 22. It has just reclaimed the 4200 satoshi area and potentially validated it as support.
Technical indicators are bullish, supporting the continuation of the upward movement.
The next closest resistance area is at 5920 satoshis. This is a horizontal resistance area and the 0.382 Fib retracement resistance level.
For BeInCrypto’s latest bitcoin (BTC) analysis, click here.


