


Key Highlights For March 8, 2019
- The price of Digibyte (DGB) reached a high of $0.0119 on Mar 5, 2019.
- DGB dropped to a low of $0.011 on Mar 6.
- DGB has been making higher highs since.
- DGB is trading inside an ascending wedge.
- There is bearish divergence in the RSI and the MACD.
- There is resistance near $0.012 and $0.013.
- There is support near $0.0109.
Tracing The Resistance
The price of Digibyte (DGB) on Poloniex was analyzed at 30-minute intervals from Mar 5 to Mar 8.
The price reached a high of $0.0119 on Mar 5. A sharp drop ensued followed by subsequent price increases. Several market cycles over the next few days saw higher highs reached at the peak of each rise.
Tracing these highs creates an ascending resistance line. It also illustrates a slight upward trend in DGB’s price since Mar 5.
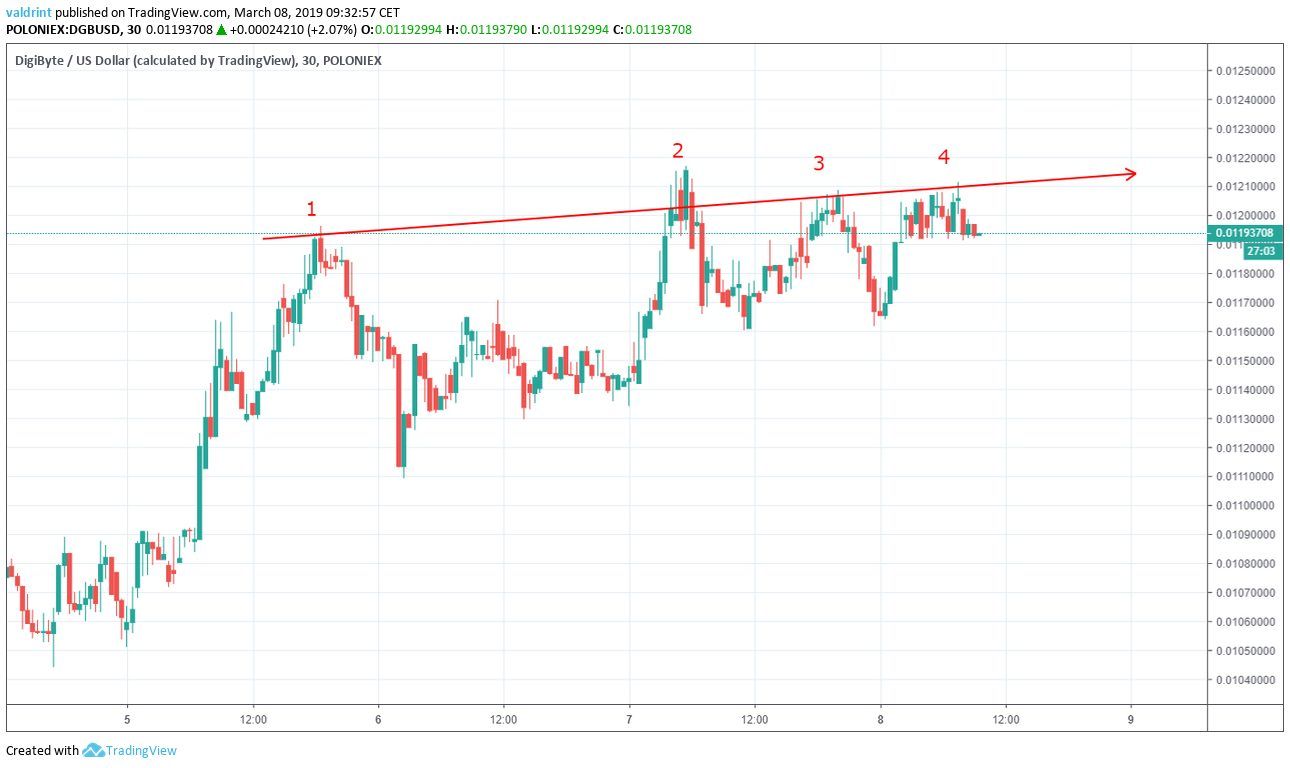
The dates in which the line was touched are:
- Mar 5
- Mar 7 (twice)
- Mar 8
The resistance line can effectively act as a ceiling to price, preventing further upward movement. However, a breakout above the line can lead to rapid price increases.
Initially, the price increased at a faster rate than predicted by the line, but it reverted to the mean on Mar 7 and 8.
The breakout above the resistance line by a wick in a volatile market is relatively unimportant as long as it is not succeeded by continued breakouts. It appeared as if a breakout was possible around the time of the second high traced on the line. However, the price subsequently dropped as part of a normal market cycle back into the resistance area.
Currently, price appears to be decreasing below the resistance line as part of a dip following Mar 8’s highs. This dip appears to be part of a normal cycle and suggests that immediate price decreases may occur within the next several days followed by a rise which may lead DGB to a fifth high along the resistance line.
Ascending Wedge
After the Mar 5 high, the price dropped to $0.011. The price has made successive higher lows since. Tracing these lows creates the ascending support line.
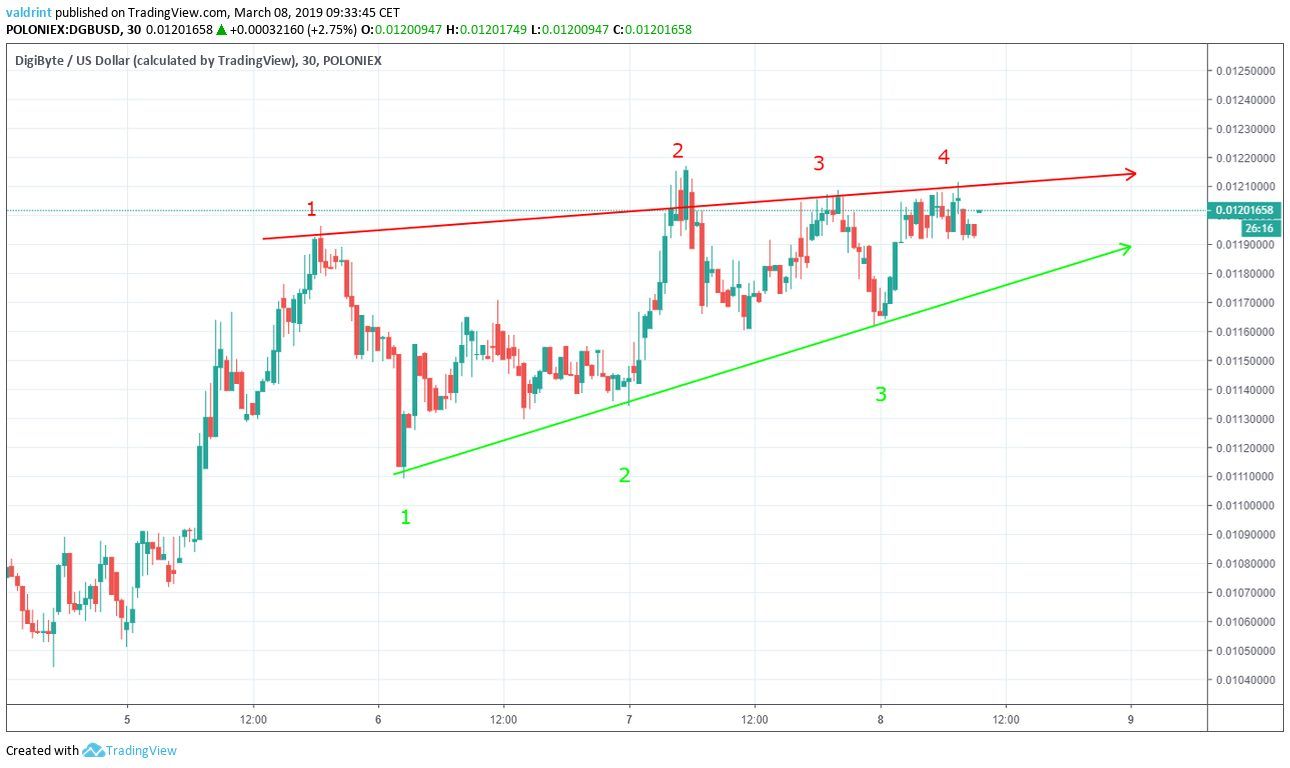
- Mar 6
- Mar 7
- Mar 8
The support and resistance lines combine to create an ascending wedge, which is a bearish pattern. It suggests a price decrease in the near future.
As prices continue to increase, the price of DGB may continue trading inside this wedge until a point of convergence between the resistance and support. At that time, the price will be forced to either breakout or breakdown. With the current pattern in place, a breakdown appears more likely.
In short, there may be immediate price decreases followed by a subsequent rise. The price is then predicted to dip below the support line where more significant price decreases may be experienced. However, the dip may be preceded by a subsequent rise which leads DGB along its current upward trend.
After a breakout or breakdown, new support and resistance lines will likely emerge.
Looking For a Reversal
The moving average convergence divergence (MACD) is a trend indicator that shows the relationship between two moving averages (long and short-term) and the price. It is used to measure the strength of a move. The relative strength index (RSI) is an indicator which calculates the size of the changes in price in order to determine oversold or overbought conditions in the market.
Combining MACD and RSI bullish/bearish divergence with support/resistance essentially predicts price fluctuations.
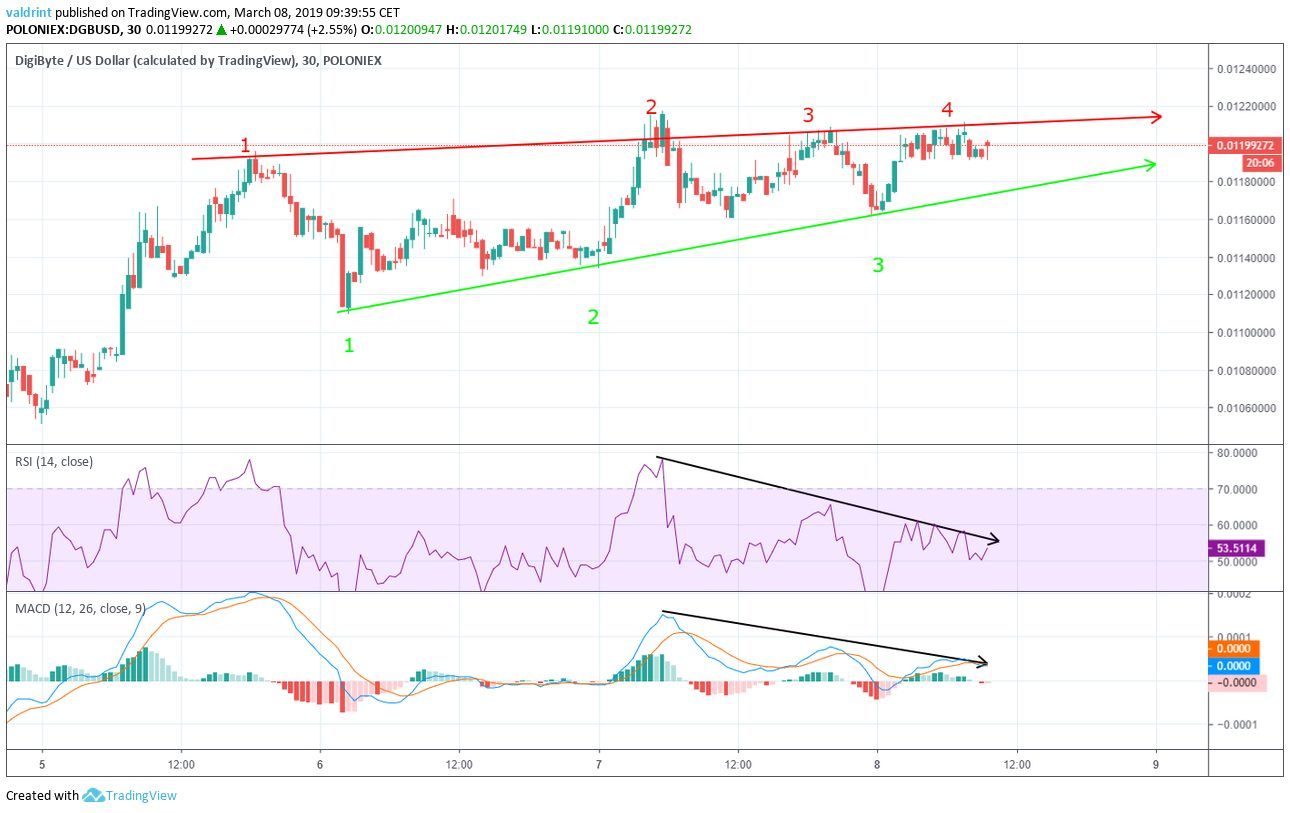
On Mar 7, the price reached a high of $0.0121. It reached a similar level twice more on Mar 7 and 8.
Similarly, the MACD and the RSI reached a swing high on Mar 7. However, the subsequent highs were significantly lower.
This is called bearish divergence and often precedes drops in price. It is especially effective when there is a bearish divergence on a bearish pattern and vice versa. If both indicators are in agreement, they can be used to further add validity to the divergence analysis. This is the case in DGB.
Using these indicators combined with resistance and support, price decreases appear forthcoming.
Future Movements
A larger data set may be helpful in predicting future price fluctuations. For this reason, the price of DGB on Poloniex is analyzed at two-hour intervals from Feb 7 to Mar 8.
The price made a low of $0.081 on Mar 7. It has created higher lows since. Tracing these lows gives us the ascending support line.
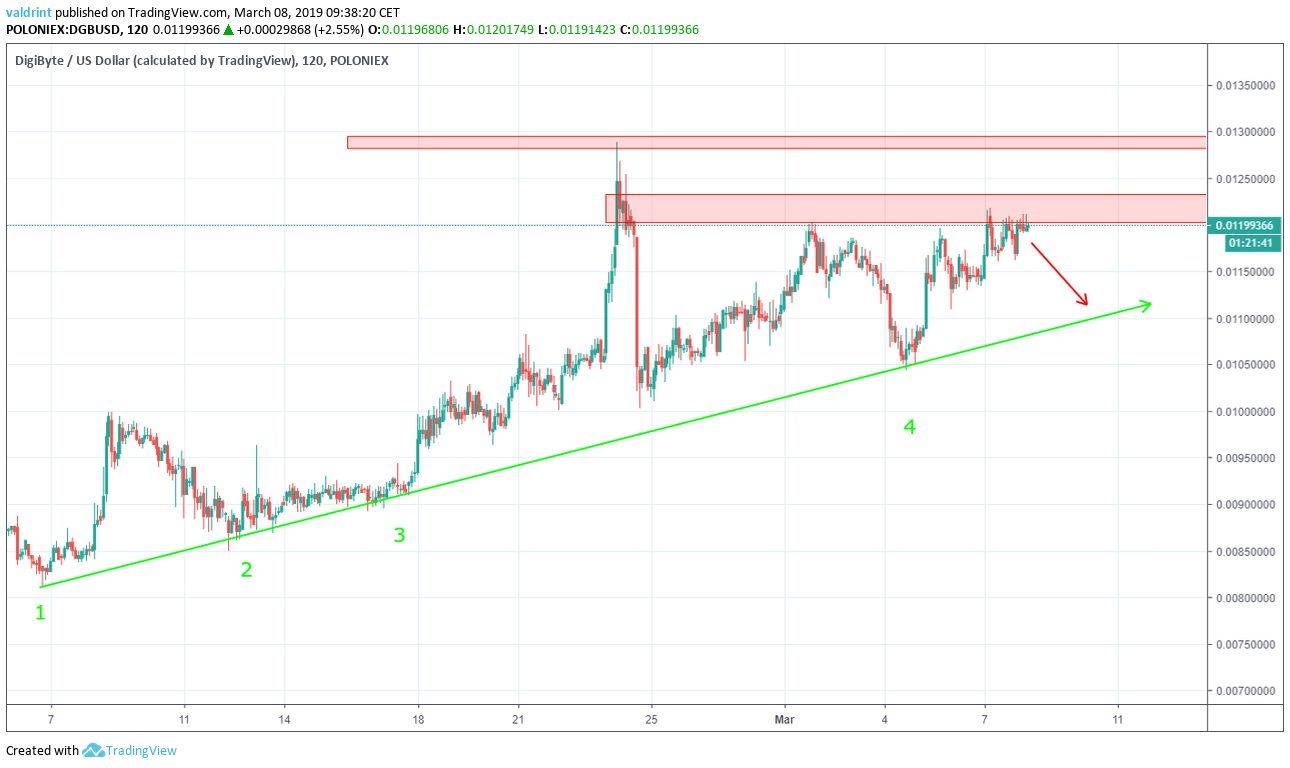
- Feb 7
- Feb 13
- Feb 17
- Mar 4
The support line is currently at $0.0109
Resistance and support areas are formed when the price reaches a certain level several times. They can act as a ceiling/floor that prevents the price from moving further in that direction.
The closest resistance area is found near $0.012. The next resistance area is found near $0.013.
These two areas can be a likely place to provide a reversal.
Based on this analysis, the price of DGB is more likely to breakdown from the ascending wedge and fall to the long-term support line at $0.0109. If the price breaks down from the wedge, the prediction would be partially validated. If it reached the support line, it would be fully validated.
Do you think that DGB will break down from the wedge and experience price decreases in the near future? Let us know your thoughts in the comments below.
Don’t Forget to Check Out Our Latest Bitcoin Price Analysis!
Disclaimer: This article is not trading advice and should not be construed as such. Always consult a trained financial professional before investing in cryptocurrencies, as the market is particularly volatile.


