


The Bitcoin price has been trading inside a descending wedge since June 1. While a breakout from this pattern is expected, the long-term trend cannot be considered bullish until BTC breaks out above $10,500.
Long-Term Resistance
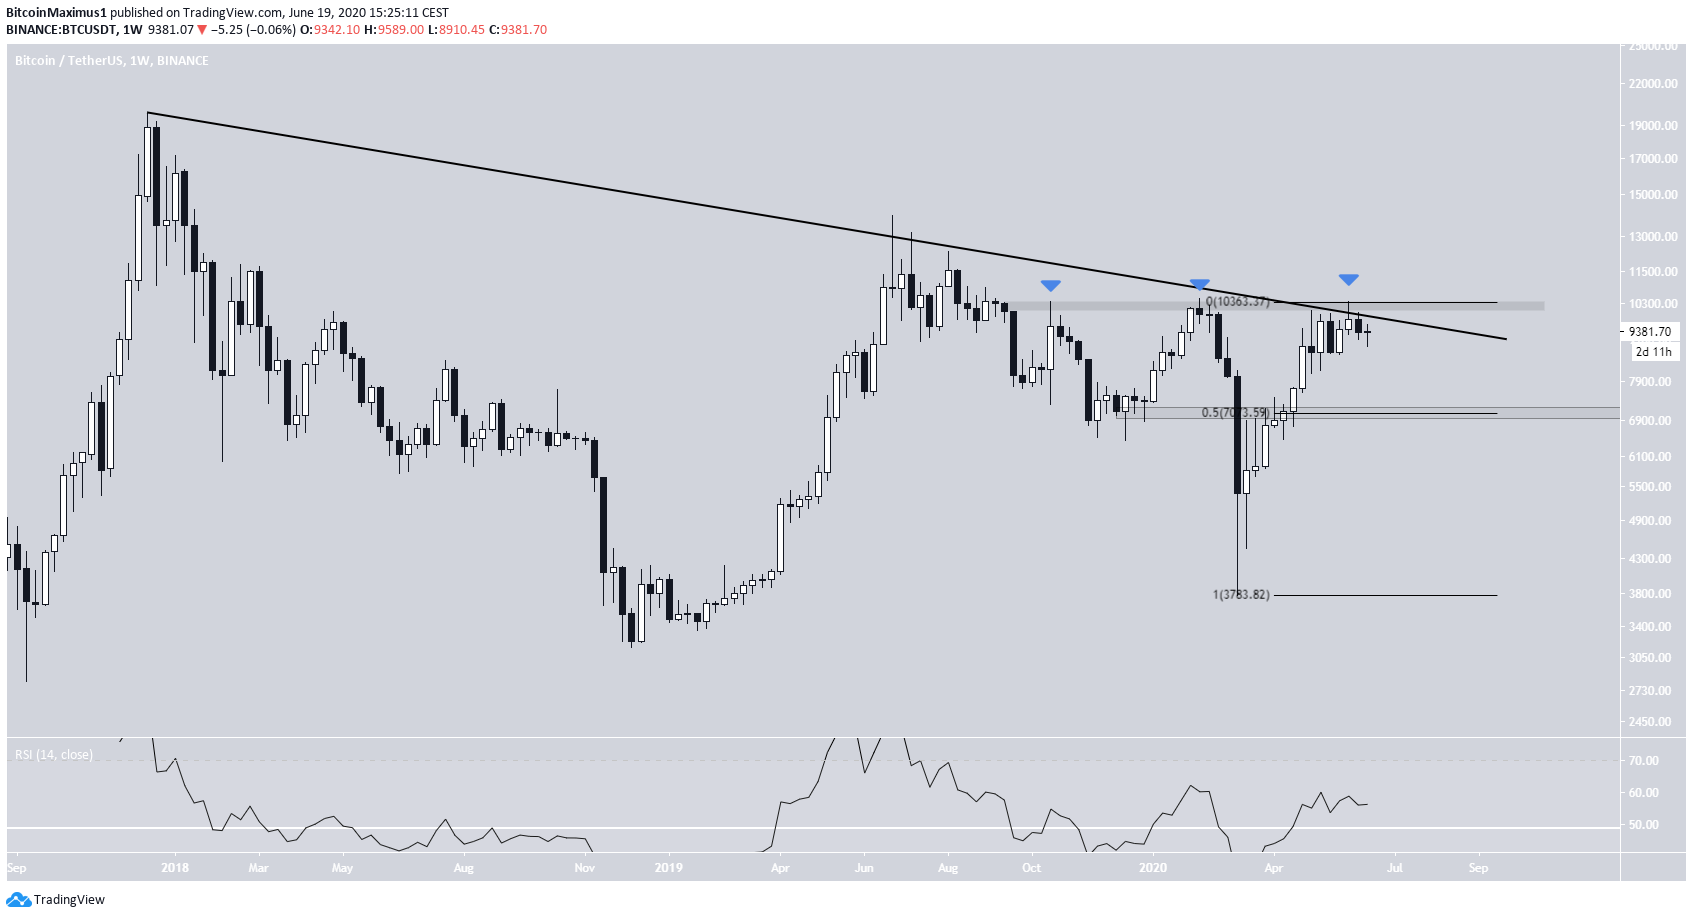
The Bitcoin price has been following a long-term descending resistance line since the all-time high reached in December 2017. It has validated the line five times until now, most recently on June 1. In addition, there is very strong resistance at $10,500.
The price has reached this resistance area three times, getting rejected each time. Furthermore, bearish divergence is forming on the weekly RSI following the last two touches.
If a decline were to occur, there is a lack of support until $7,000, the 0.5 Fib level of the entire upward move beginning in March. In other words, the drop could be quite swift.
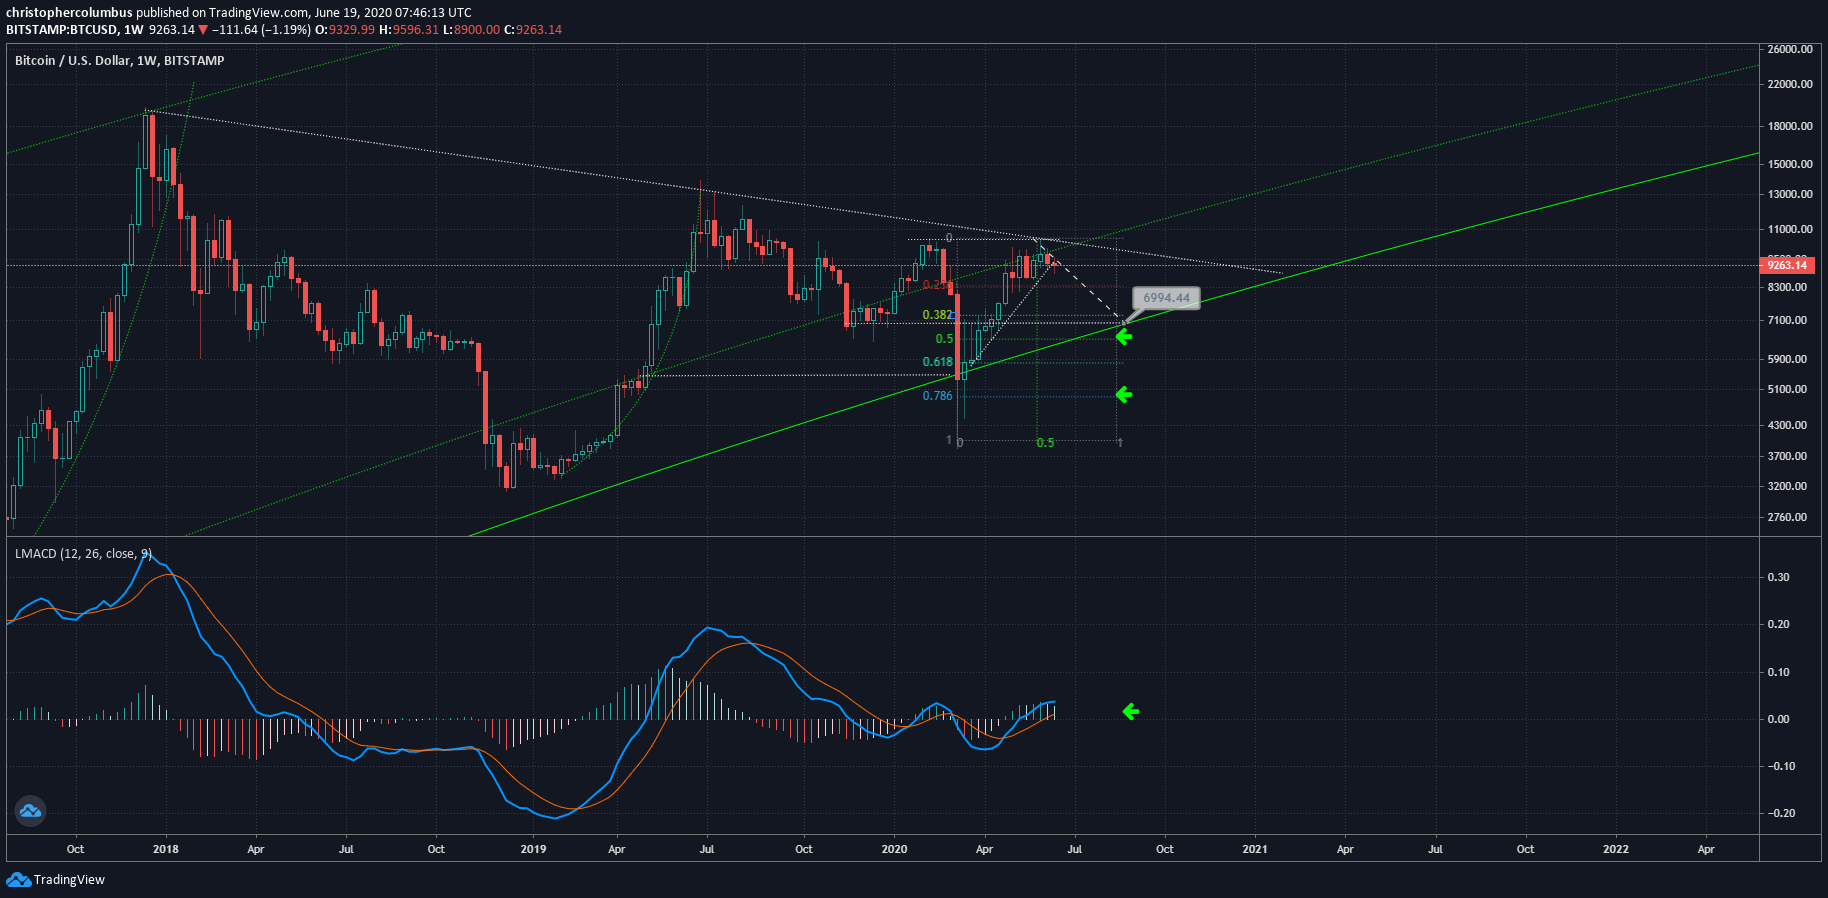
Well-known trader @Davthewave explains the situation:
“MACD is rolling over, and resistance is trumping support”.
He posted a scenario where BTC could fall all the way to $6,994. This is an almost identical target to our 0.5 Fib level support.
Descending Wedge
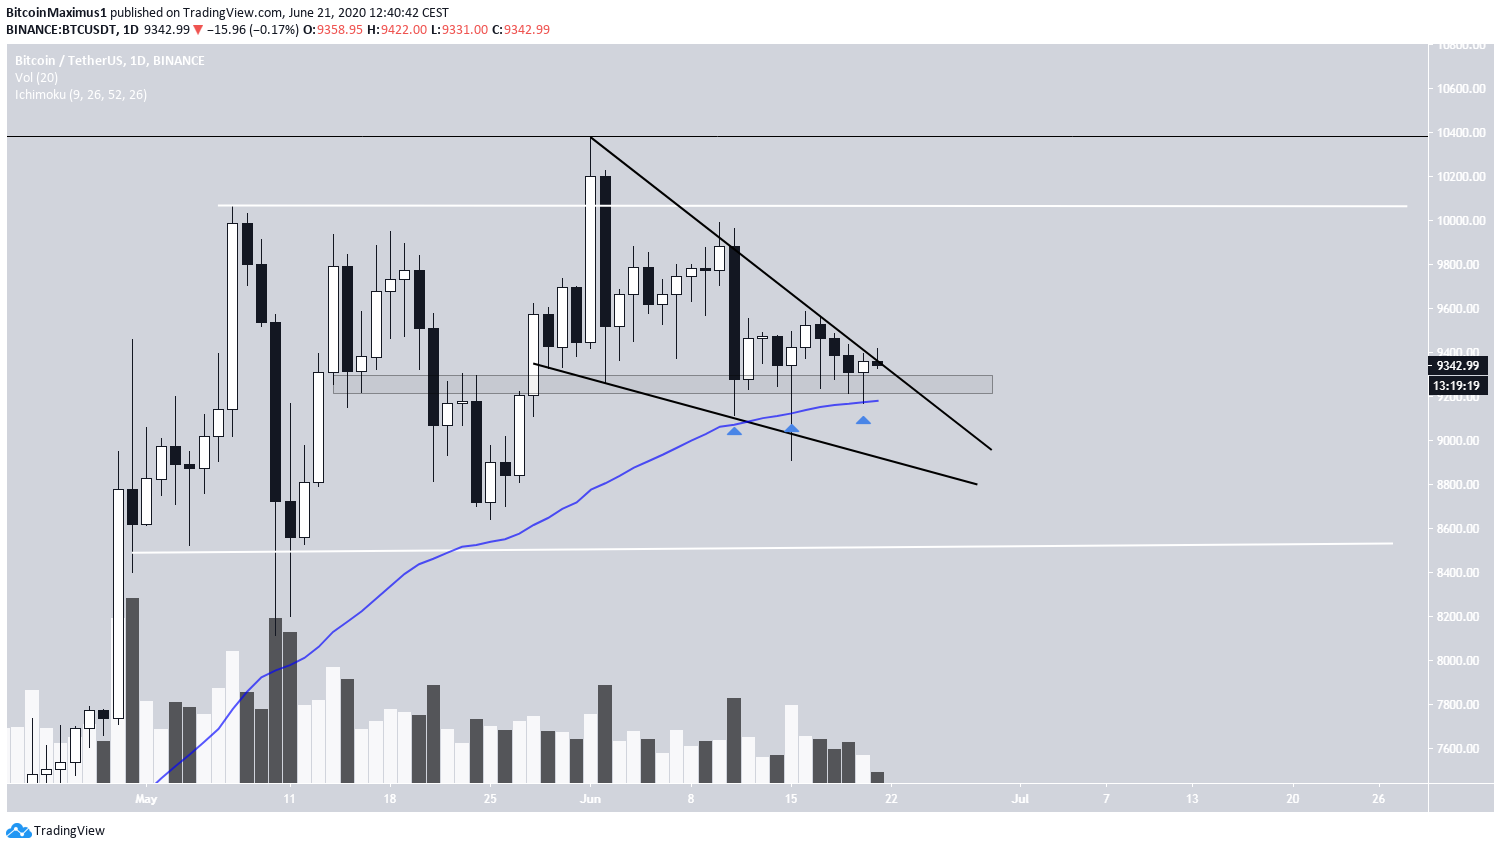
On the daily chart, we can see that BTC is trading inside a descending wedge, and has been doing so since reaching a high on June 1. At the time of writing, it was trading right at the resistance line of this wedge.
Besides the formation of this bullish reversal pattern, there are several reasons to suggest that BTC Will break out. One to watch is the $9,300 support area, inside which BTC has created several long lower wicks, a sign of buying pressure.
In addition, there is the 50-day moving average (MA), which is supporting the price. A breakout from this pattern would likely take the price to the $10,100 resistance area, which is the upper limit of the trading range.
However, until the price breaks out from the long-term descending resistance line and resistance area outlined in the previous section, the long-term trend remains neutral.
To conclude, even though a breakout from the current pattern is expected, the long-term trend is not bullish until BTC closes above $10,500 on the weekly chart.


