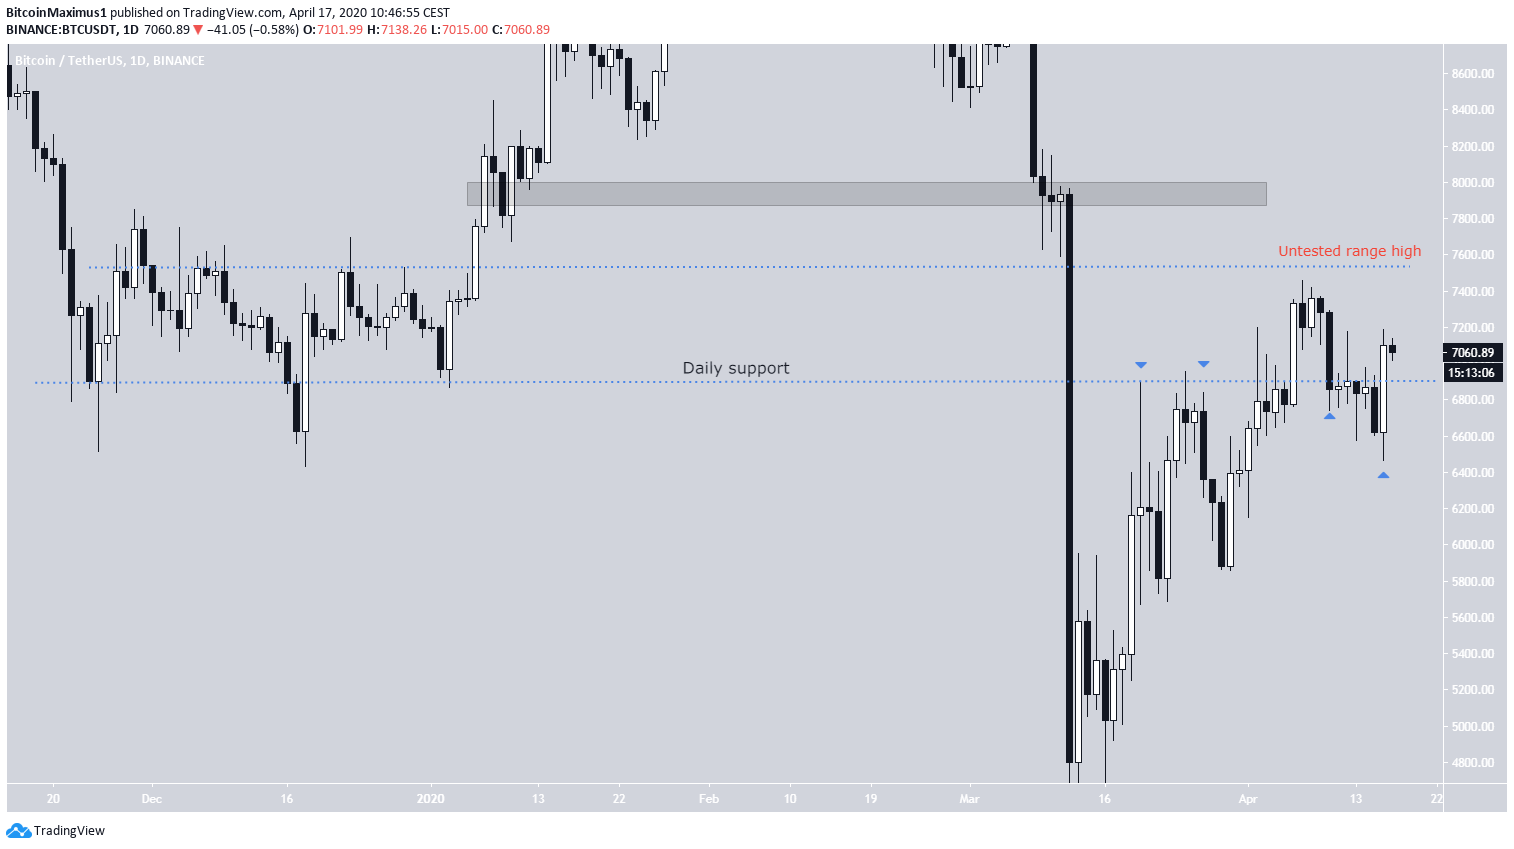
Since the price reached a close above $6,900, the bias has turned to bullish and he states that his next target is $7,500. However, the proposed bias would be invalidated if the price were to decrease below $6,900.$BTC
— Cred (@CryptoCred) April 17, 2020
Daily closed at $7200 resistance but more importantly above $6900.
Directional bias is bullish as range low reclaimed.
I'll look to act on that bias either via a pullback to ~$6900 or a continuation entry through ~$7200.
Objective would be ~$7500.
Wrong if $6900 fails. pic.twitter.com/xHzDi9fNh5
Bitcoin Daily Bias
The most important level on the daily chart right now is found at $6,900. This area initially acted as support throughout the end of 2019 and was the catalyst for the ensuing upward move. The price broke down from this level on April 10 and the downward move continued until the price reached a low of $6,481 on April 16 before reversing. The price reached a close above this area the same day. Therefore, the daily time-frame does not offer a clear verdict on whether the directional bias is bullish or bearish. While yesterday’s close was well above the $6,900 level, which should act as a gauge of the trend’s direction, we cannot completely ignore the bearish closes of April 10 and 15. It is possible that the breakdown was valid and the increase that followed was just a reactionary bounce since it was also a lower-high relative to the price on April 8. As stated in the tweet, the range high is found at $7,500, a resistance level that has been untested since 2019.
Weekly Bias
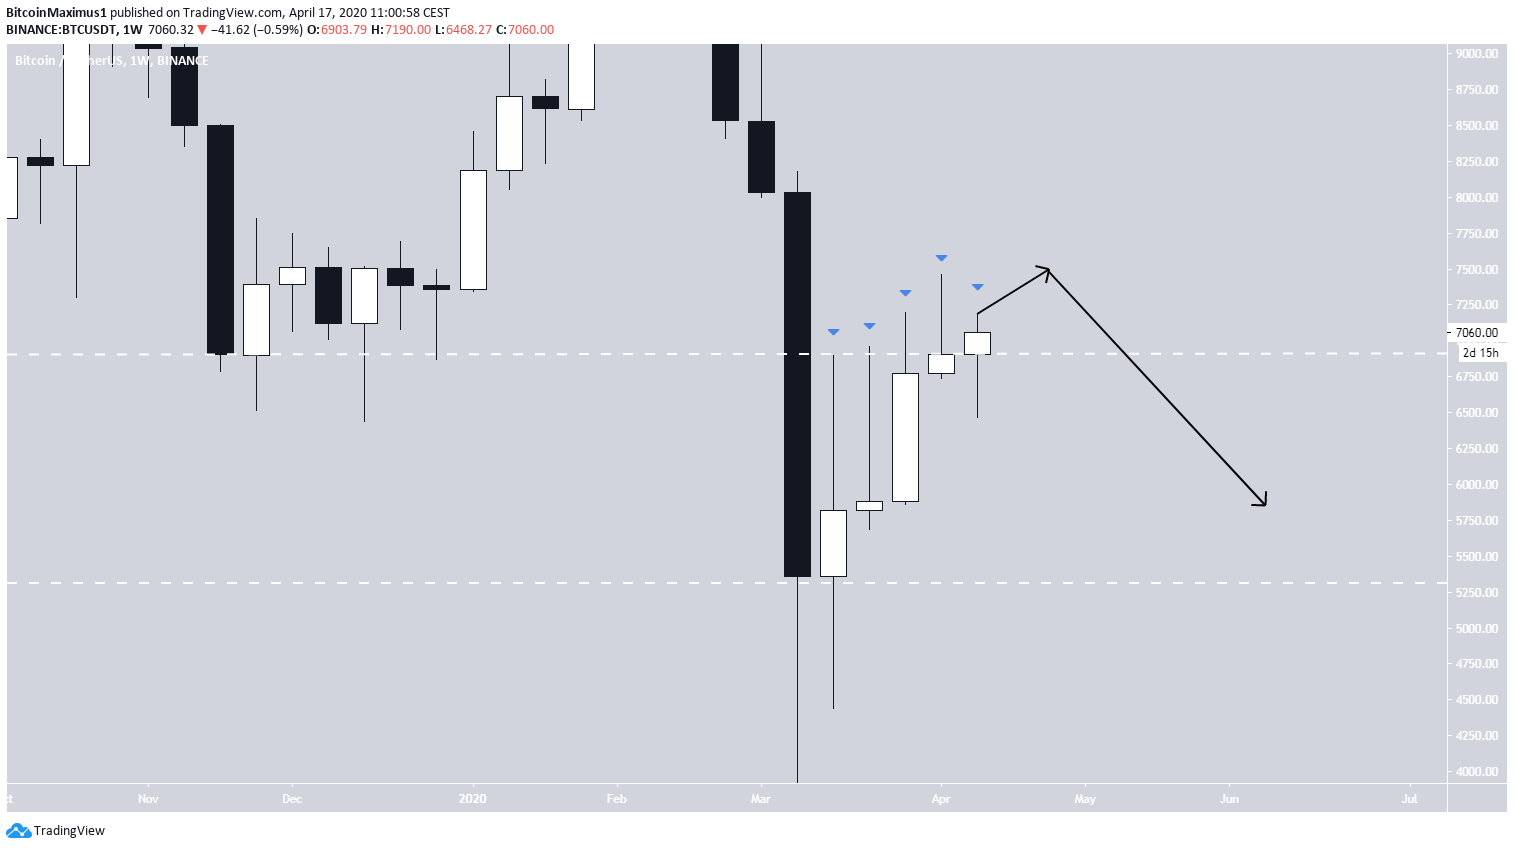
The weekly chart gives a clearer bias that the BTC is still bearish. The price has created four weekly candlesticks in a row which all have had long upper wicks, a sign of heavy resistance. Also, it has yet to reach a close above $6,900. While the current weekly candlestick shows a price higher than $6,900, there are more than two days left until the week closes. Incorporating the daily levels into this, it would make sense for the price to reach the “untested range high” at $7,500 before decreasing back below $6,900. A weekly close above $6,900 would invalidate this hypothesis, and possibly indicate that BTC will continue to move upwards.
Disclaimer
In line with the Trust Project guidelines, this price analysis article is for informational purposes only and should not be considered financial or investment advice. BeInCrypto is committed to accurate, unbiased reporting, but market conditions are subject to change without notice. Always conduct your own research and consult with a professional before making any financial decisions. Please note that our Terms and Conditions, Privacy Policy, and Disclaimers have been updated.


