


The Monero (XMR) price has broken out from and validated the $96 area as support. Technical indicators are bullish and support a continued increase towards the next closest resistance areas outlined below.
Long-Term Movement
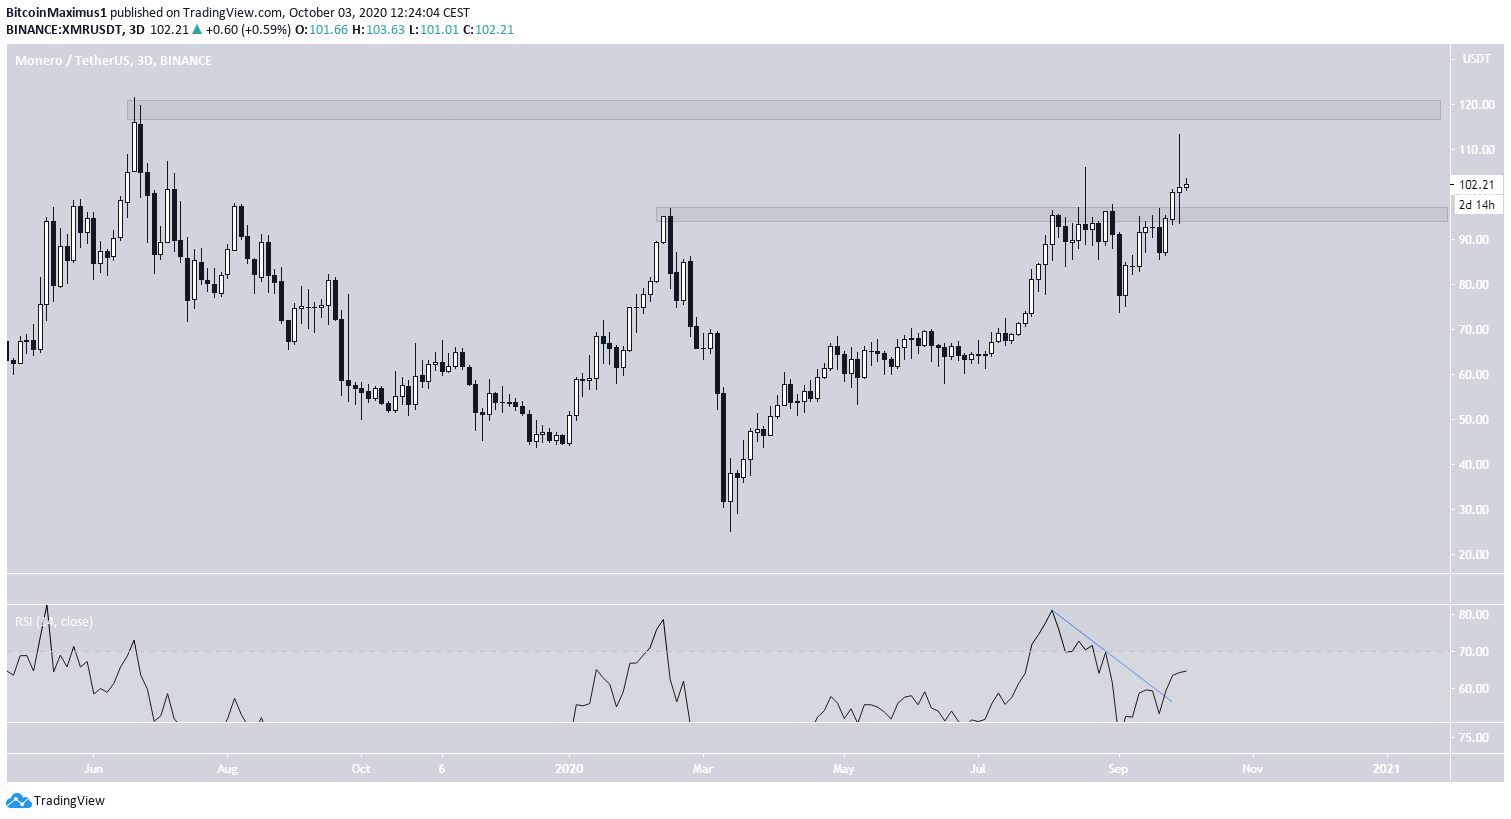
The XMR price is trading above the previous resistance area of $96, which had previously rejected breakout attempts four times prior. The price validated the area as support afterward and has its sights set on the next resistance area at $119.
While the three-day RSI has generated bearish divergence, it broke the divergence trend-line during the most recent increase.
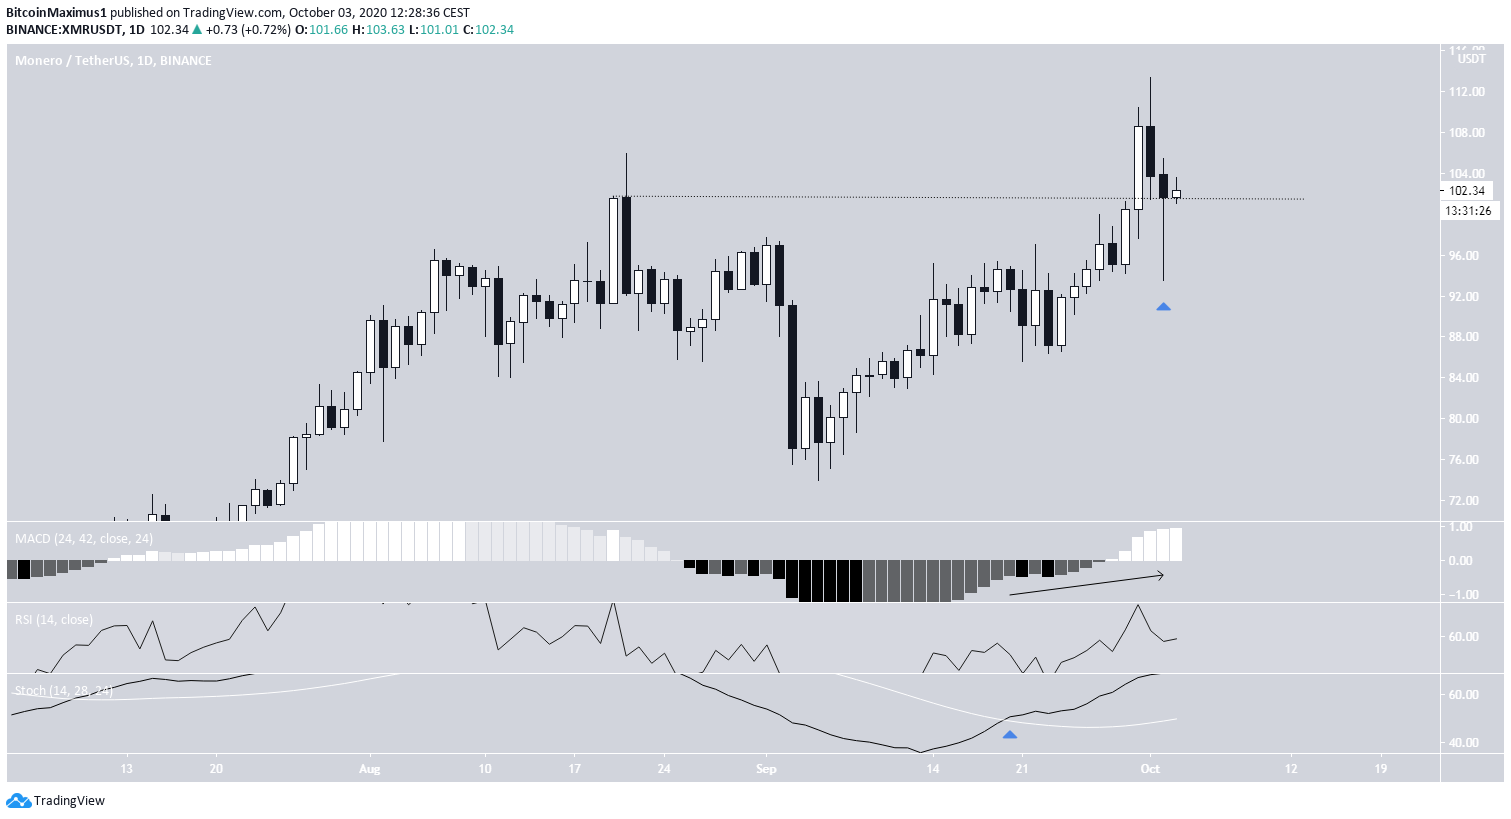
The daily chart shows a very long lower wick that was created on Oct. 2, a sign of buying pressure. Furthermore, Oct. 2nd’s close was above the previous high of Aug. 21, making the current movement a re-test of that resistance area.
Technical indicators are bullish. The Stochastic Oscillator has made a bullish cross and is moving upwards alongside the RSI and the MACD, the latter of which has turned positive. These are signs that the price is expected to continue moving upwards towards the previously outlined resistance area.
Wave Count
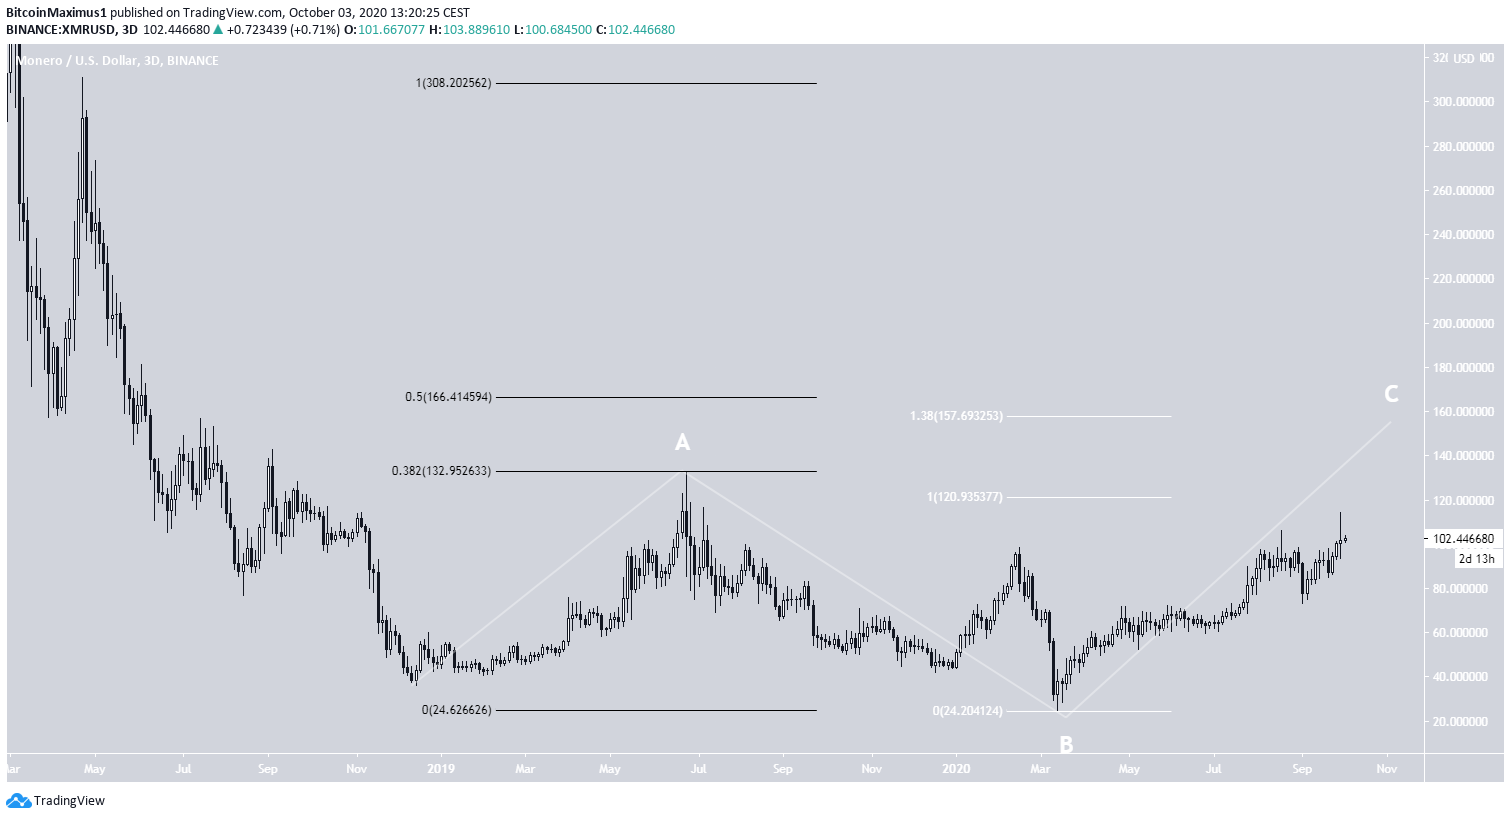
The long-term count for XMR suggests that the price is in wave C of an A-B-C corrective formation (shown in white below). Based on the length of the A wave, a likely target for the top of the current increase would be found between $157-$166, between the 1.382 Fib length of wave A and the 0.5 Fib level of the entire previous decrease.
A shorter C wave, one which would travel only the length of A, would end near $120.
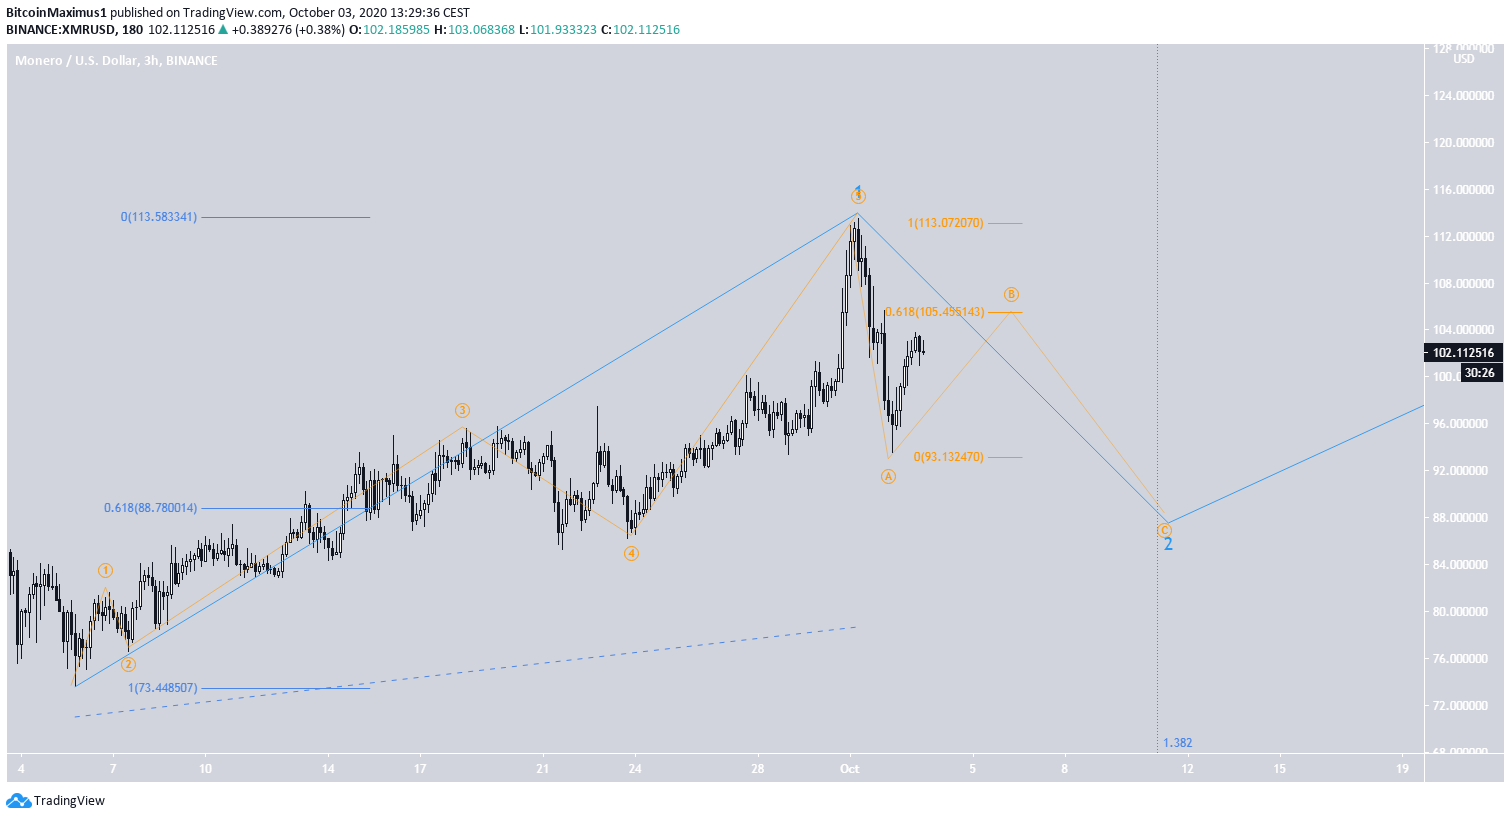
The shorter-term chart shows that the price is in the final sub-wave (blue) of wave five (black) in the aforementioned C wave.
Similar targets of $149-$155 are also given using various fib levels.
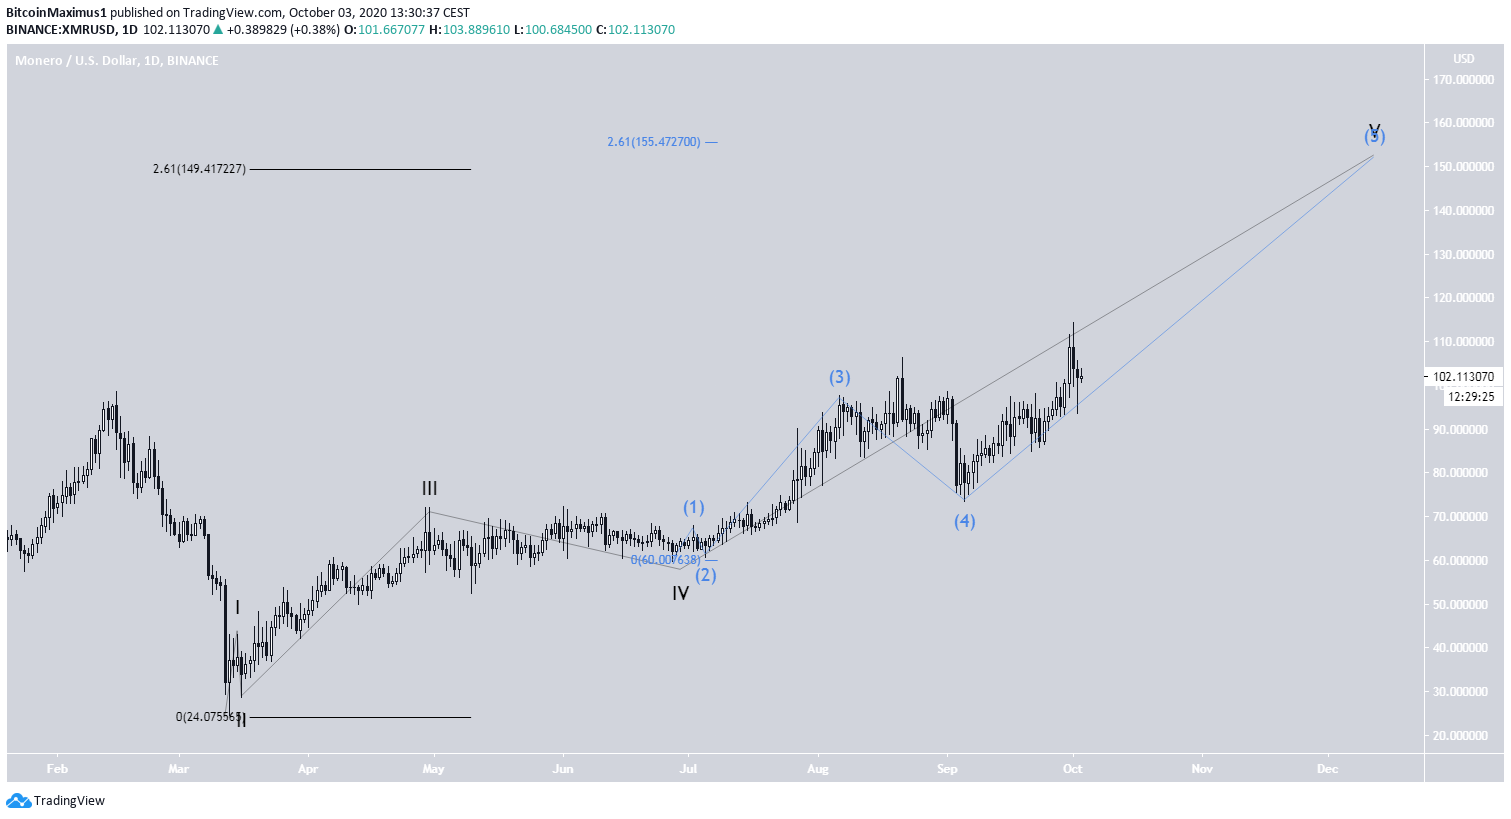
Finally, the shorter-term chart shows a completed impulse, which should be minor sub-wave 1 inside the previously mentioned sub-wave 5 (both in blue). If the count is correct, the price will retrace for a period of time towards $88, the 0.618 Fib level of the previous increase, before eventually resuming its upward movement.
XMR/BTC
Cryptocurrency trader @Cryptoelite outlined an XMR/BTC chart which shows an ongoing breakout from an accumulation channel and an important moving average.
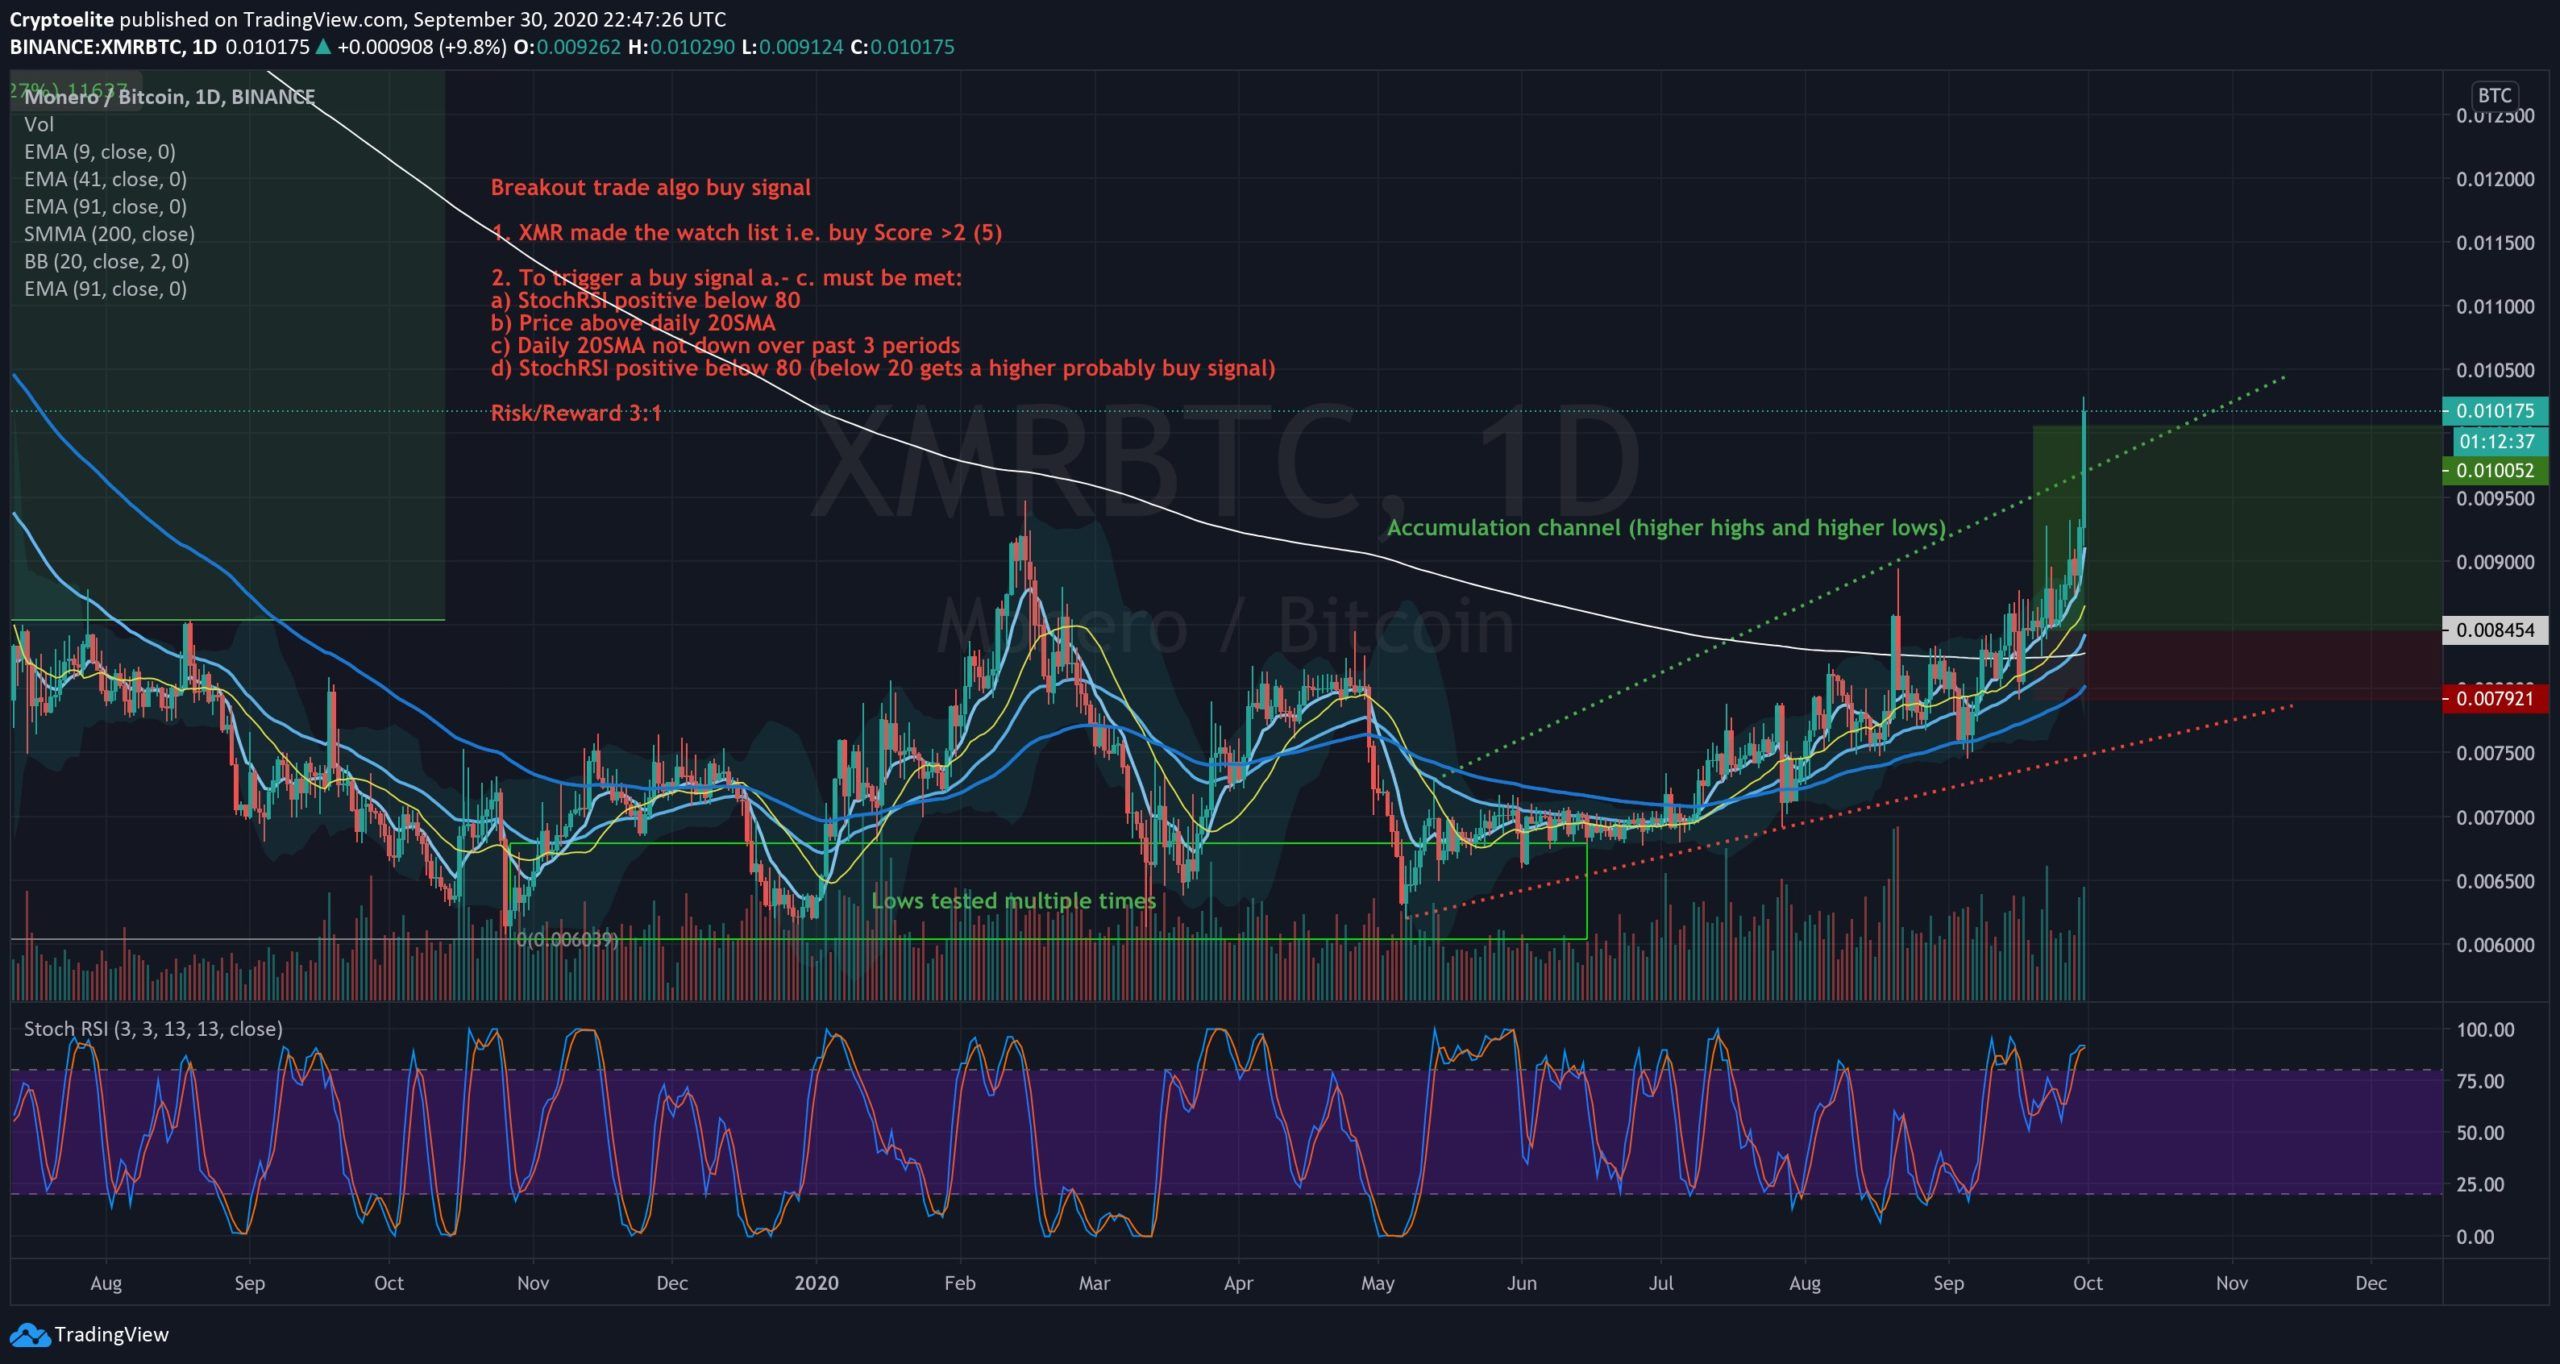
The XMR/BTC price had been accumulating near ₿0.0065 since the beginning of February. The price began an upward movement in July and is currently moving towards the next resistance area, which is found at ₿0.014.
Technical indicators are bullish, suggesting that the price will eventually reach the area. The Stochastic Oscillator has made a bullish cross and is increasing alongside the RSI and MACD.
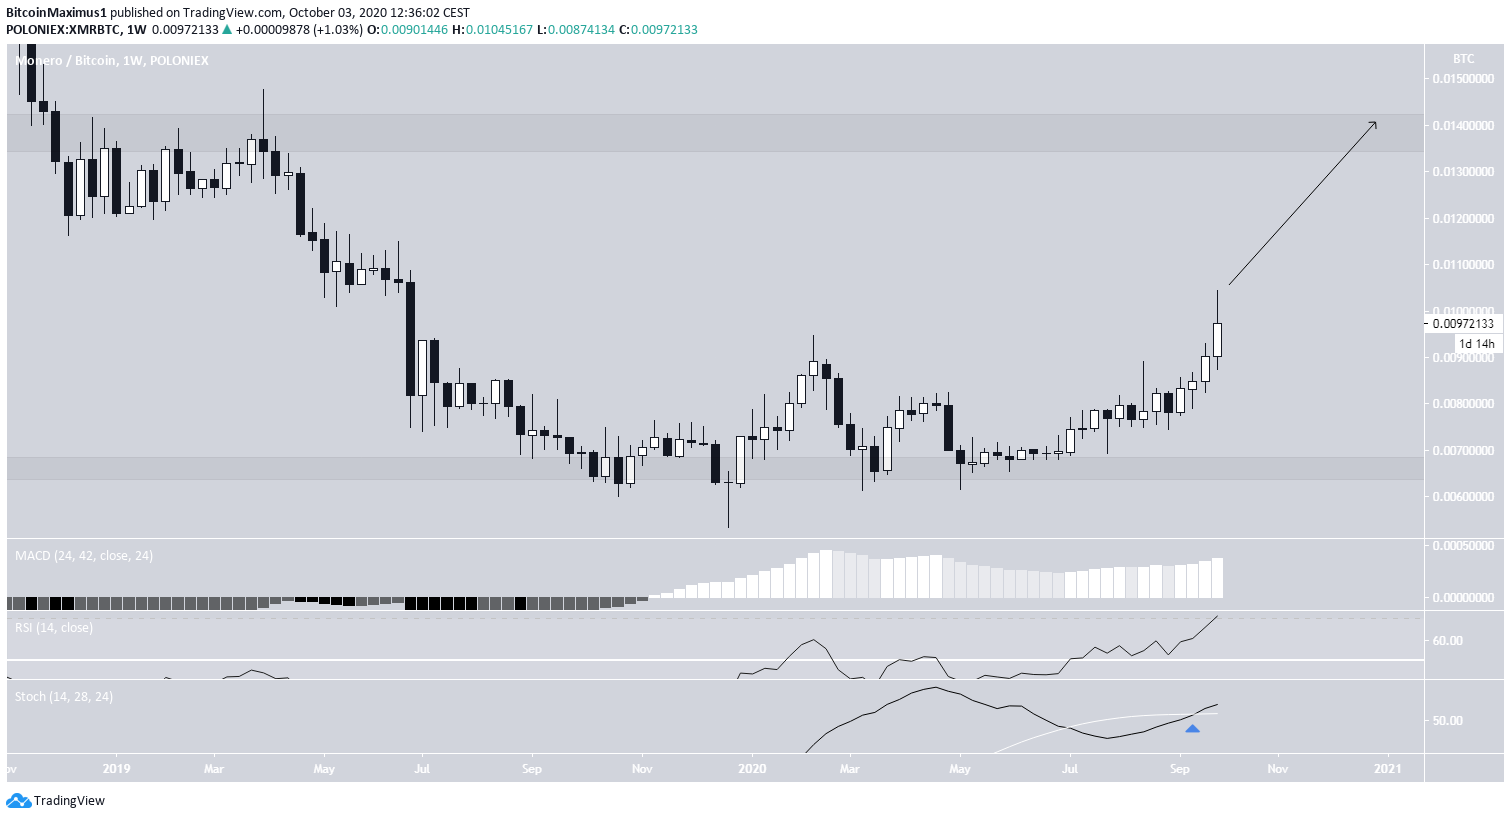
Therefore, the price is expected to gradually increase and eventually reach the ₿0.014 area.
Disclaimer: Cryptocurrency trading carries a high level of risk and may not be suitable for all investors. The views expressed in this article do not reflect those of BeInCrypto.


