


The altcoin market cap (ALTCAP) has been decreasing since the beginning of September. However, the bullish structure is still intact and will remain so unless ALTCAP decreases below $110 billion.
Long-Term Support
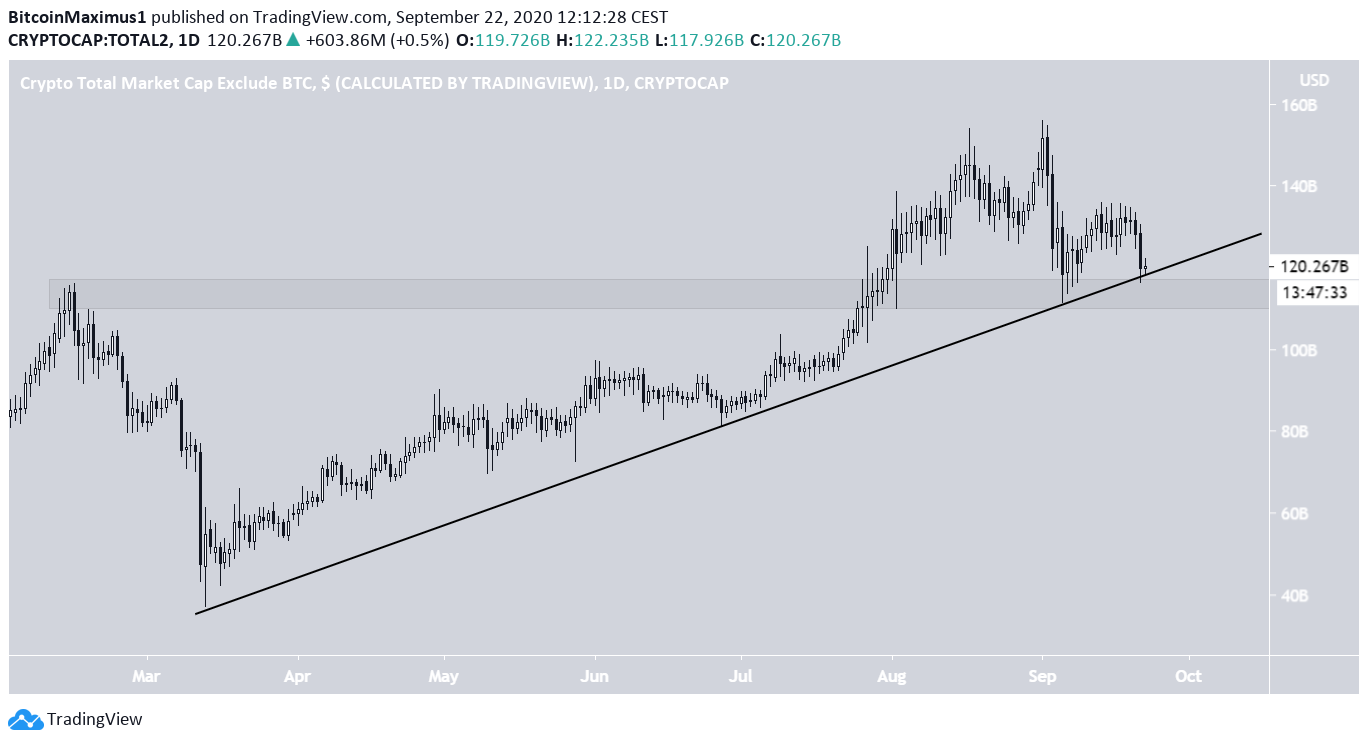
The ALTCAP price has been following an ascending support line since it reached a bottom on March 13. The CAP reached a high of $156.1 billion on Sept. 1 and began to decrease.
Despite the decrease, the price is still trading above the ascending support line and the $110 billion support area. If the price manages to hold this level, it could still create a higher low relative to that of the beginning of September, indicating that the trend is still bullish.
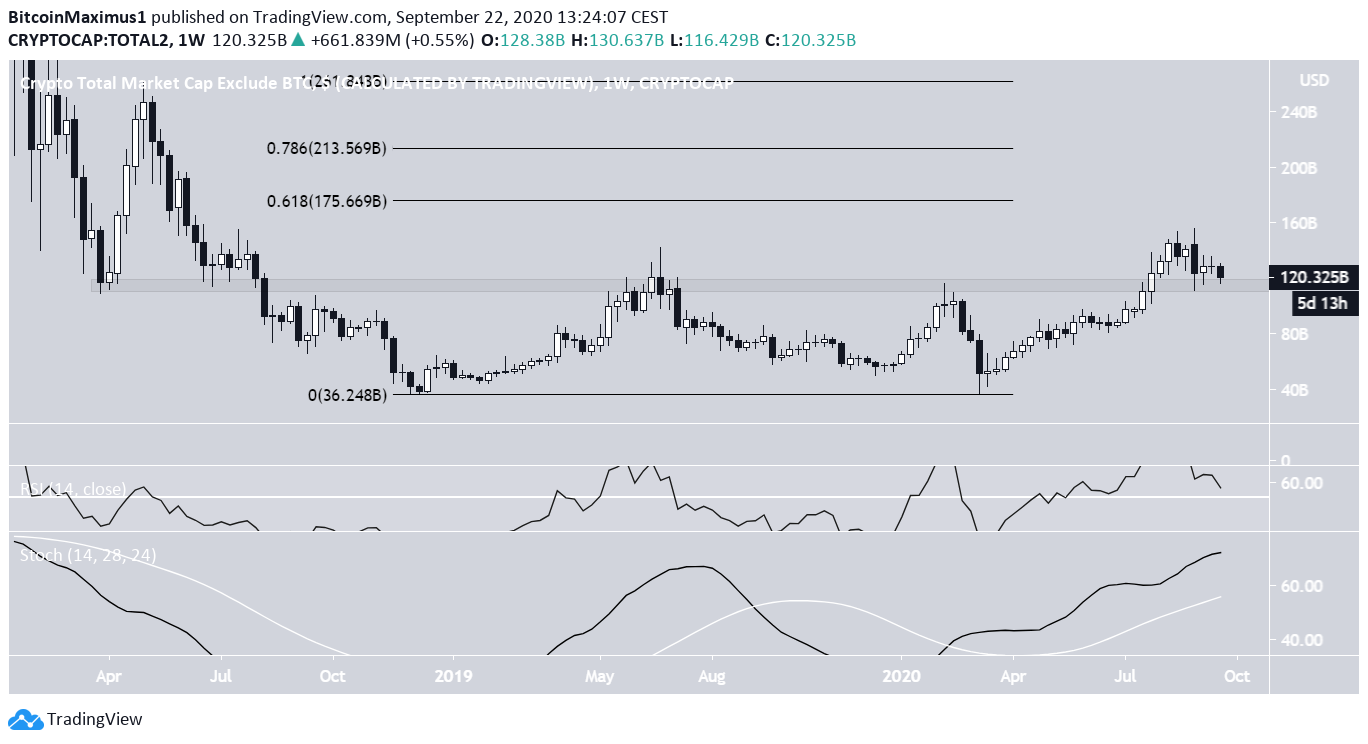
The importance of this level is also shown by the weekly chart. The same area has intermittently acted as support and resistance since April 2018.
As long as the price does not fall below this level, the previous increase is considered a breakout that created a higher high, a sign that the price is trending upwards.
If it continues doing so, the closest resistance area would be found between 175-213 billion, the 0.618-0.786 Fib levels of the entire previous downward move.
Possible Reversal
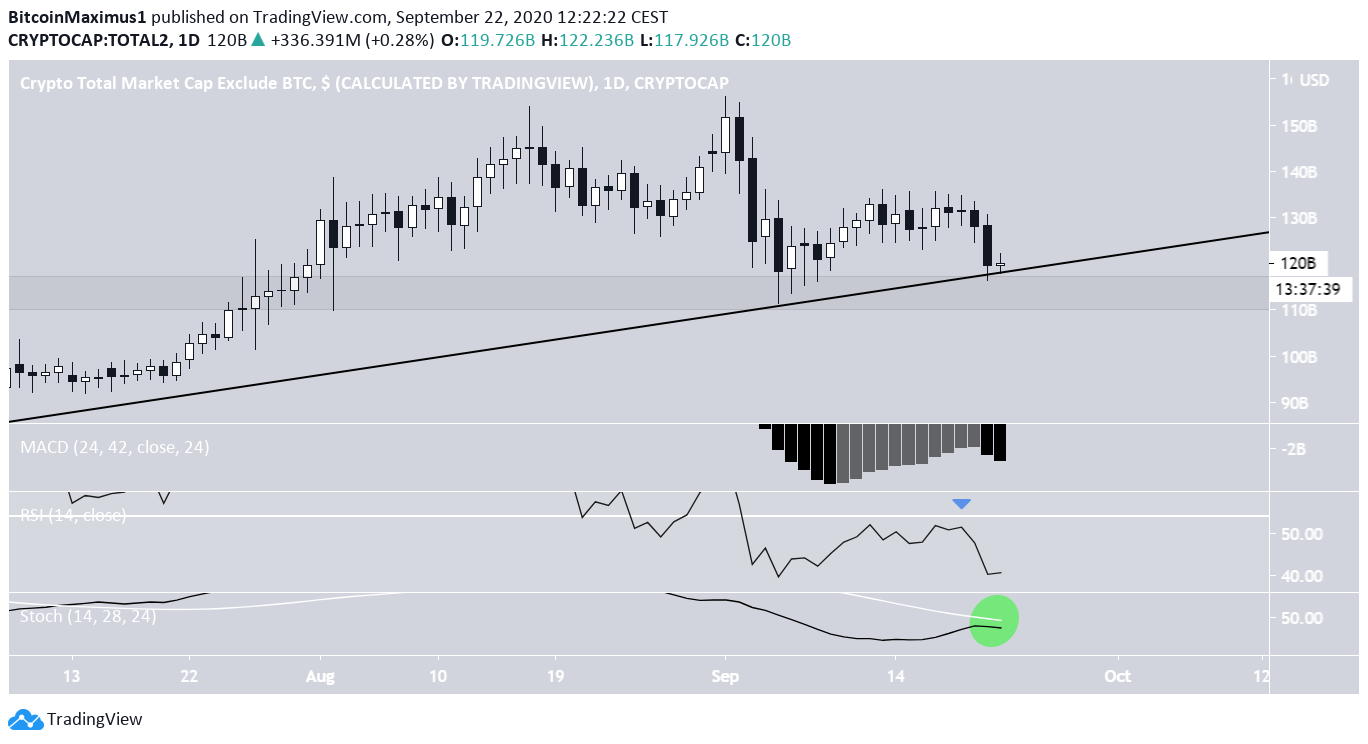
Technical indicators do not yet suggest a reversal is near. The RSI was rejected at the 50 line and is decreasing. While the MACD was previously moving upwards, yesterday’s decrease also caused a sharp drop.
Whether the Stochastic Oscillator makes or rejects a bullish cross, alongside the possible breakdown from the support line will likely determine if the trend is bullish or not.
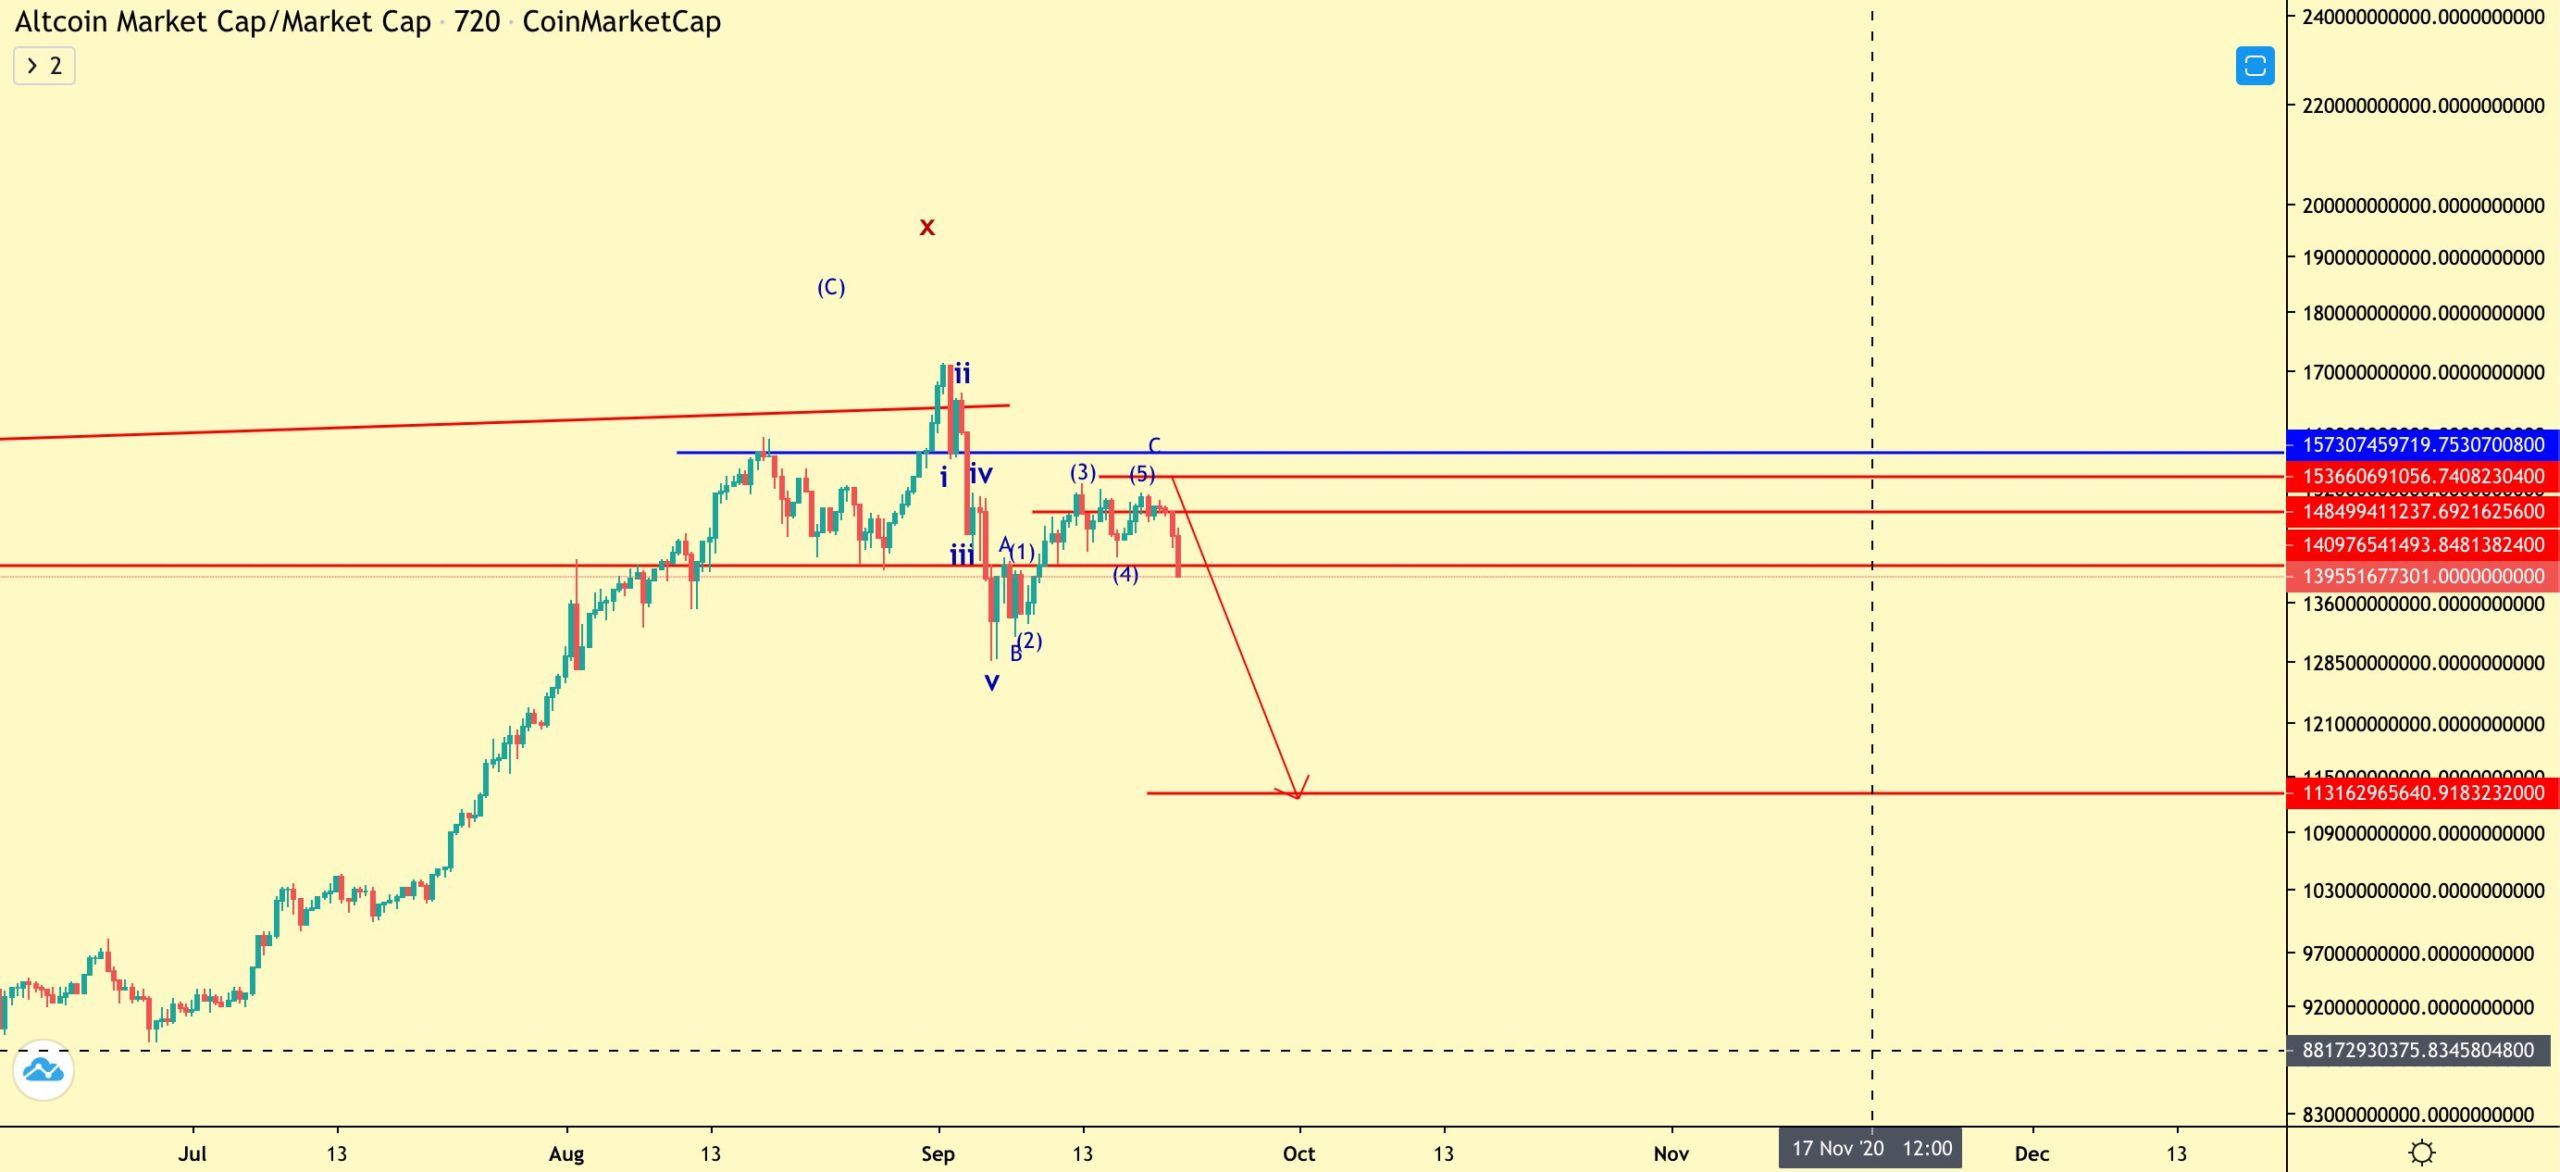
Cryptocurrency trader @Theewguy stated that the alt market cap is expected to decrease considerably, dropping all the way to $113 billion. Since then, the market cap has fallen to this level, and whether it bounces or falls below will be crucial in determining the future trend.
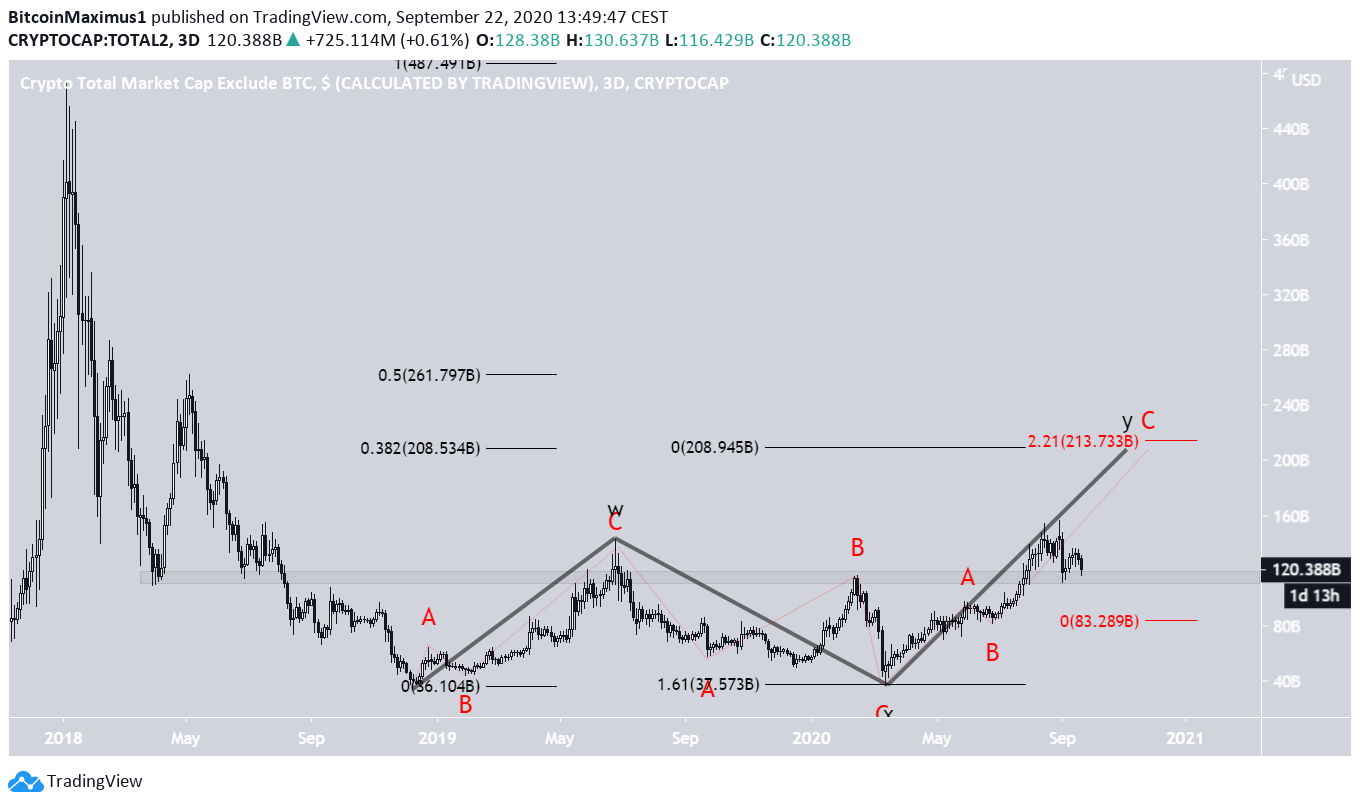
Wave Count
Even though the ALTCAP has been increasing since the beginning of 2019, the movement looks corrective rather than impulsive, possibly taking a complex W-X-Y formation (shown in black below).
Furthermore, since the 2018 drop, the price has not even reached the 0.382 Fib level at $208 billion, which should be the minimum retracement level even if the movement is corrective.
The $208 billion area also offers other Fib confluence, such as the 1.61 length of wave W (black) and 2.21 length of wave A (red), making it a likely level for a top.
To conclude, the altcoin market cap remains bullish as long as it is trading above $110 billion. If the support holds, it is possible that it will increase all the way to $208 billion.


